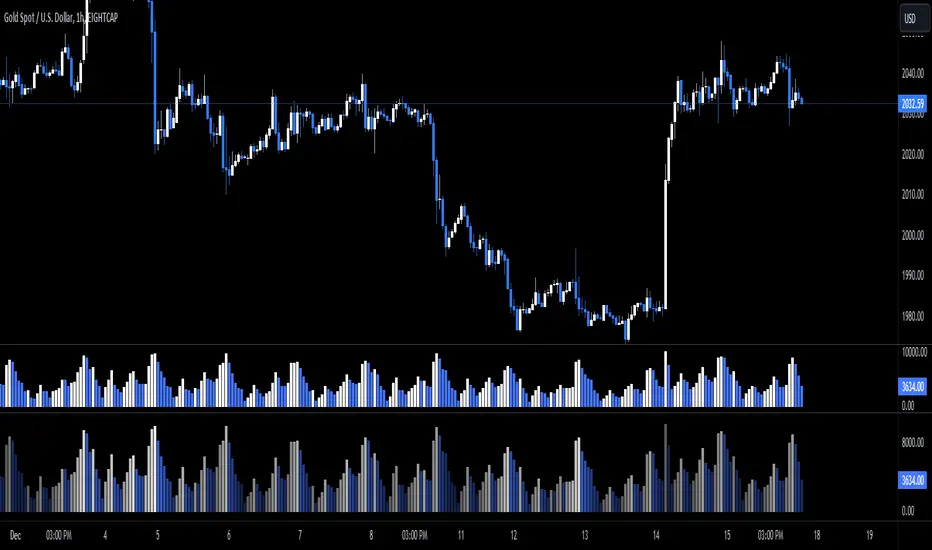
[g8] Volume Observer BasicA simple indicator to highlight surges and drops in recent average volume with custom settings and alerts.
How to interpret the signals: A white signal indicates a surge in recent average volume, meaning we expect a probable move in the direction of the highlighted candle. A gray signal is the opposite: a drop in volume suggesting the current move is losing momentum and may be nearing it's conclusion. Keep in mind that a surge does not always mean bullishness and a drop does not always mean a drop in price is coming, but rather view these signals as the market's interest in continuing or ending the current move.
I made this indicator because I'm terrible at interpreting regular volume bars. I hope you find it useful.
Cerca negli script per "volume"

Cumulative Volume Delta with SignalThis premium-grade technical indicator provides deep insights into market sentiment by tracking the difference between buying and selling pressure through volume analysis. SCVD offers a sophisticated approach to volume profile analysis, helping traders identify potential trend reversals and momentum shifts before price action confirms them.
Key Features:
Real-Time Volume Delta Analysis: Visualizes buying vs. selling pressure through color-coded candles
Smart Signal Line Integration: EMA-based signal line helps identify trend changes and trading opportunities
Multi-Timeframe Capabilities: Automatically selects optimal lower timeframes for precision or can be customized
Daily Reset Option: Anchor period functionality for intraday delta analysis
Professional Visualization: Clean, color-coded display with zero reference line
Trading Applications:
Identify divergences between price action and volume delta for potential reversals
Spot accumulation/distribution patterns through delta behavior
Use signal line crossovers for entry/exit timing
Confirm trend strength by analyzing delta momentum
Detect potential false breakouts through volume confirmation
Perfect for day traders, swing traders, and institutional investors who rely on volume analysis for decision-making. This indicator combines sophisticated volume delta metrics with an intuitive interface to provide actionable trading insights across all markets and timeframes.

Projected VolumeCalculates Projected Volume for the current trading day. Builds on Pocket Pivot Breakout Script by simatricks.

Ticker Screener by Volume Heatmap [SS]Fun little screener that creates a heatmap by daily volume trend.
The numbers expressed are the Sell to Buy ratio (Selling volume / buying volume). The % is the % change over the lookback period.
The default lookback period is 25 days, but you can adjust it as you see fit. The brightness of the green and red will change based on the extent of buying / selling.
Anything 1 or over means there is a lot of selling. A percent change in the negatives is good, it means that selling is decreasing and buying is increasing. Vice versa for a percent change in the positives.
It will accomodate up to 12 tickers, there are some pre-set but you can obviously customize it with your own tickers of interest.
And that's pretty much the indicator, pretty simple indicator but I hope you enjoy!
Safe trades everyone!

Ace VolumeThis is volume indicator that can help you identify either the volume is increasing or decreasing gradually.
The color based on the previous volume price.
The bigger the volume from the previous, it will show bull color (white) and vice versa bear color (blue).
The example of the indicator volume as shown above. Feel free to used it. Thank you!
Performante's Average Bitcoin Volume IndicatorThe volume of all major exchanges, including:
Bitfinex, Coinbase, Bitstamp, Bitmex, Kraken, Binance, Bithumb, Flyer, and OkEx

Zanger Volume Profile ZVR v1This is an attempt to make a zanger volume profile indicator, it needs improvement and some sort of forward looking volume estimator.
Last Price minus Open Price Intraday VolumeLast Price minus Open Price Intraday Volume
Change in price from day Open price to Last Price indicate the stock price movement. Last Price minus Open Price Intraday Volume indicator is framed on volume change during change in price from day Open price to Last Price. It takes into account the average intraday volume based on intraday length of bars and actual volume attributed to change in price from day Open Price to Last Price. The indicator reflects the change in trend .By analyzing the position of price on the basis of average change in volume during intraday with that of volume attributed to change in price from day open Price to Last price one may decide upon the course of trade.
DISCLAIMER: For educational and entertainment purposes only. Nothing in this content should be interpreted as financial advice or a recommendation to buy or sell any sort of security or investment including all types of crypto.
LazyScalp Volume in Currency AVGThis indicator displays the volume in the currency of the asset.
It also draws the average for a certain period and the average multiplied by the coefficient. If the volume is higher than the average multiplied by the coefficient, then the histogram bars and candlesticks on the chart are highlighted in color.
Also, the indicator sends alerts at such moments.
The indicator allows you to quickly see when the volume rises sharply. Often these are very interesting points for trading.
The indicator has many settings and display styles.

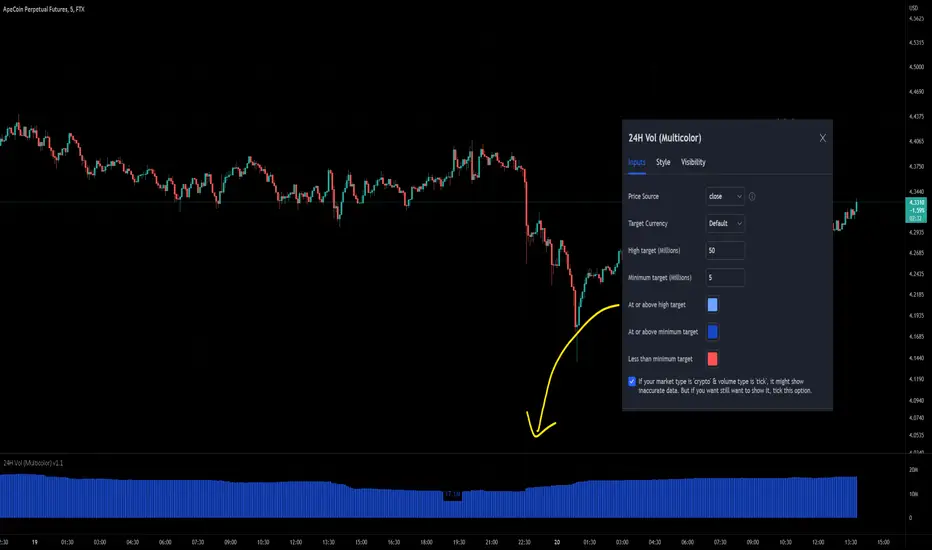
24-hour Volume (Multi-color with target size)This indicator has added the option to set different colors for a size target so you can set and instantly knows if the volume is above or below your target by seeing the different colors. Furthermore, I've added the option to opt-out of the error message that blocked the use of the 'crypto' market with the 'tick' type because maybe some users needed it, for example: BYBIT:APEUSDT is by default not available but personally I want to see it, so I can turn it on in this script.
24H Volume Strategy [Capital Coders]The 24H Volume Strategy measures the 24 Hour Volume of the current Asset. When the Volume Spikes (ATR) the strategy assumes the trend will either continue or reverse and then enter the market on the high volume move to capture the highest volatility of the day. This strategy has options to trade either with the trend, with the reversal, or both.
This strategy also features the new Capital Coders - Custom Strategy Template that features new State of the Art Tools Including:
Robust Time Filter
Built in Money Management
Dynamic Multi-tiered Take Profit
Automation for ANY Platform (Using Webhooks)

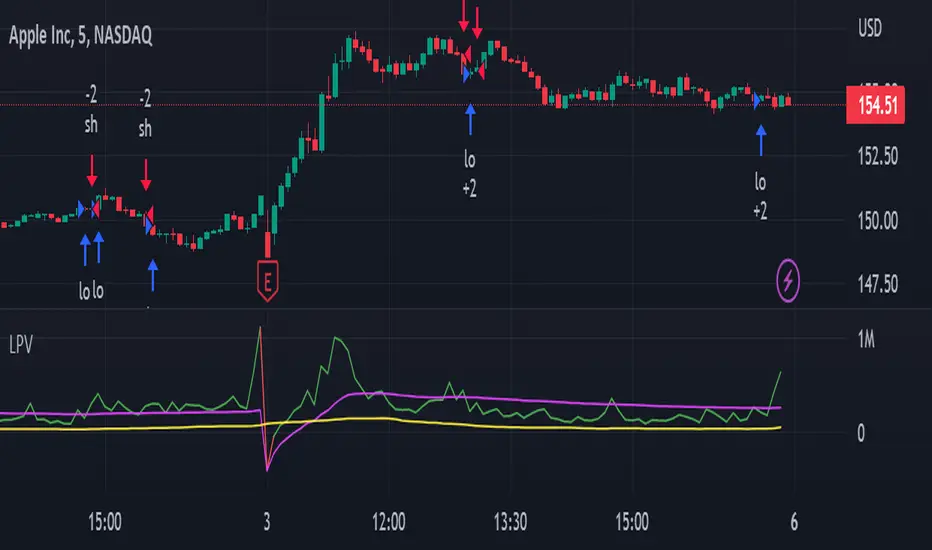
Koalafied Volume Extension BubblesCircles based on extensions from volume Z-Score. Large volume candles can often signal exhaustion or show market strength in reversals or breakouts. Circles can be offset back to the start of the day/profile or left at the time where they occur.
Colours denoting deviations from the mean are
+2 std dev - Green
+1 std dev - Blue
-1 std dev - Red
-2 std dev - Purple
Concept is primarily as a pseudo volume profile delta tool. Obviously it's a very basic heuristic so would recommend further reading and use of actually footprint data to base trading decisions on.

Mehrdad banakar (volume / candle size)This indicator divided volume on size of candle. It developed base on the volume, and its fluctuate make a good perspective to user to analyze the market.

perp-spot Volume of Alts FTXJP※ This indicator works only on FTX.
Integrated "perp-spot" volume of all alts currently tradable by Japanese on FTX Japan that have both PERP and USD pairs.
It subtracts the volume of SPOT from the volume of PERP and integrates them.
Contains : volume of
(BTCPERP - BTCUSD)
(ETHPERP - ETHUSD)
SOLPERP - SOLUSD
XRPPERP - XRPUSD
DOTPERP - DOTUSD
LTCPERP - LTCUSD
FTTPERP - FTTUSD
BCHPERP - BCHUSD
BATPERP - BATUSD

Integration Volume of Alts FTXJPIntegrated volume of all alts (perp) currently tradable by Japanese on FTX Japan.
You can compare the overall trend of altcoins through the volume on the screen of a specific stock (BTC, ETH, etc.).
Contains :
(FTX:BTCPERP)
(FTX:ETHPERP)
FTX:SOLPERP
FTX:XRPPERP
FTX:DOTPERP
FTX:LTCPERP
FTX:FTTPERP
FTX:BCHPERP
FTX:XLMPERP
FTX:BATPERP

Buying Selling Volume v2Builds on Ceyhun's "Buying Selling Volume" indicator. This version allows users to define periods by effortlessly dragging two points or you may define periods by manually entering the start and end times in the settings window. Once the period is defined, both buying and selling volume will be totaled thus displaying the amount of buys and sells in that period.
I have found the information provided from the script helps in defining a period of consolidation as either being accumulative or distributive.

BTC Spot/Futures Volume RatioShows the ratio between the spot trading volume versus futures trading volume for Bitcoin. This ratio may be interpreted as how active the market currently is, and may lead to various interpretations. For example, when the price is at a high level and this ratio gradually decreases, it may imply the end of the distribution phase; when the price is low and the ratio is at the bottom, it may imply the bottom of the price.

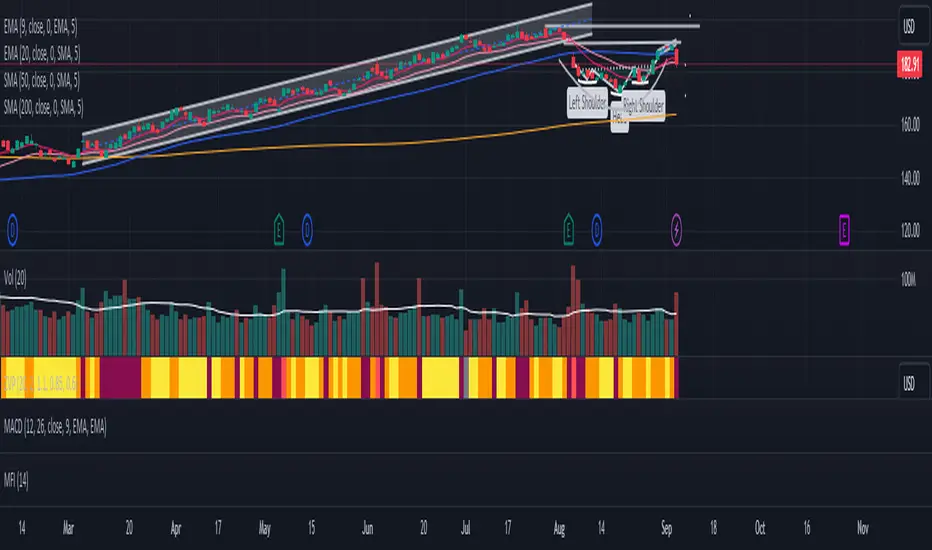
[HuD] MA VolumeMA Volume is a group of moving averages based on :
Value = ( volume ) x ( current price )
There are few Moving Average (MA) :
I. 10 EMA
2. 20 SMA
3. 50 EMA
4. 200 SMA
a) When 10 EMA > 20 SMA, then the band is green, and red when 10 EMA < 20 SMA.
b) Dot green = Golden cross when :
🔹ema10 crossover sma20
🔹ema10 crossover ema50
🔹sma20 crossover ema50
🔹ema50 crossover sma200
The purpose of this indi ( version 1 ), is just to get the overall view of how volume is related to price movement.

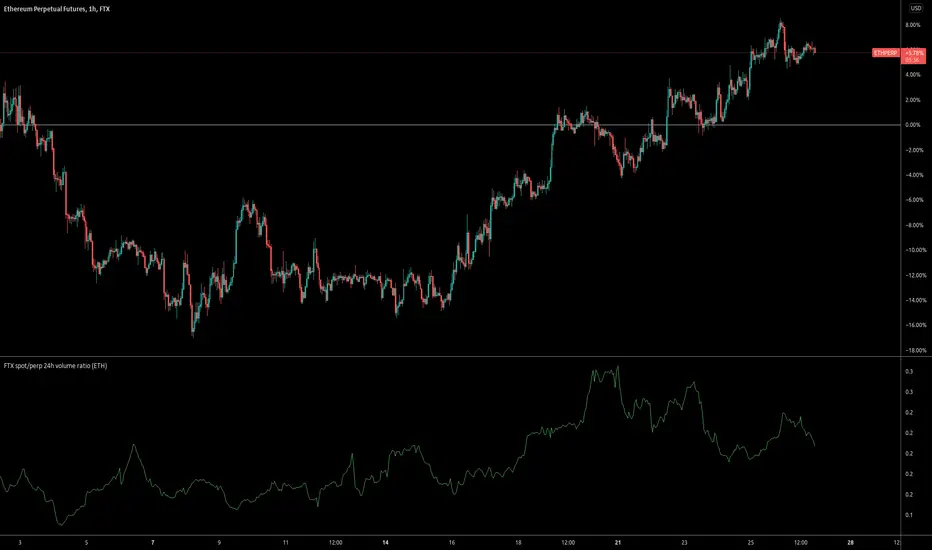
FTX spot/perp 24h volume ratioThis indicator gives the ratio between the 24h volume on the spot instrument versus the perpetual contract on FTX.
Base volumeCalculates volume in base currency. For example, in a pair bnbusdt will show the volume not in bnb, but in usdt (million).

TKP Volume Slope Bar ColoringUsing the slope of the 20 Period Volume Moving Averages to detect trend changes in Volume
*With respect to Indexes only*
Increasing Volume tends to be "Bearish" while decreasing volume tends to be "Bullish".
Color of the slope changes when the current slope is above or below the reading of the slope 3 days prior.

Dip Volume V1the very simple and very effective script, the script fetching the data from future contract data so that you can easily understand what is going inside the future data volume . and this is very important for Nifty and Bank Nifty traders

