Volume with VSAThis script is designed to identify meaningful volume activity using the principles of Volume Spread Analysis (VSA). By focusing on the relationship between price movement and volume, it highlights areas where professional traders may be active. The tool becomes especially powerful when applied to higher timeframes such as 15-minute or 30-minute charts. On these larger intervals, market noise is reduced, allowing true supply and demand imbalances to stand out more clearly. As a result, the zones and signals generated by the script tend to be more reliable and consistent. The combination of structural analysis and volume behaviour helps traders pinpoint potential trend reversals, continuation patterns, and breakout strength with greater accuracy. Overall, this script enhances decision-making by offering a clearer view of genuine market participation, making it well-suited for swing traders, intraday strategists, and anyone looking to understand volume dynamics more effectively.
Cerca negli script per "volume"

Volume CandleThis Volume Candle Strategy indicator highlights the areas where the volume is acting against the prevailing trend.
It is a reliable indicator for identifying locations where big market players are likely to be liquidated or forced to change their positioning due to an ongoing trend.

Volume Imbalances & Gann's Square IndicatorVolume Imbalances & Gann's Square Indicator:
This script is a comprehensive trading toolkit designed to help intraday and swing traders identify high-probability trade setups by combining the strengths of Gann's Theory, price-volume analysis, and multi-indicator signal confirmation in one indicator.
Key Features and Their Roles:
Gann’s S/R Levels:
Calculates main and auxiliary support/resistance lines using Gann’s “odd square” approach based on the current price. Levels are projected historically and into the future to clearly visualize critical zones for potential reversals and breakouts.
Volume*Price (VP) Spike Table:
Detects and displays real-time buy and sell volume spikes above a configurable threshold, highlighting large market transactions. The on-chart table summarizes recent major spikes with time and price for context, resetting every session.
Multi-EMA & VWAP Logic:
Integrates three customizable EMAs, VWAP, and Supertrend. Users can toggle signals from EMA crossovers, price-VWAP positioning, or Supertrend direction to match their preferred trading style and filter signals for trend or mean-reversion strategies.
Buy/Sell Labels and Signal Source Control:
Clearly plots buy/sell marker labels with customizable text, color, and size, based on the chosen signal source (EMA cross, VWAP, Supertrend). Labels offset from candles for easy visibility.
First Candle Range & Session Tools:
Plots the initial range (high, low, and midpoint) of a user-defined session, helping visualize and trade session breakouts or range retests. Session logic ensures all statistical tables and levels reset at session start.
Automated Risk/Reward Table:
Instantly calculates capital allocation, stop-loss, potential quantity, and two profit targets for both long and short trades. Helps traders plan size and risk per trade in compliance with risk management principles.
Highest/Lowest VP Markers:
Highlights the day’s peak and trough volume*price values for context on institutional buying or selling pressure.
Previous Day Range Plotter:
Draws previous session’s high/low levels for reliable reference zones and potential trade targets.
Integration Rationale:
All components are thoughtfully integrated to provide a holistic decision-making workflow:
Volume/price spikes act as momentum or liquidity signals.
Gann levels define the “where” for reaction or breakout trades.
Signal logics (EMA/VWAP/Supertrend) answer the “when,” enabling higher-confidence entries only when multiple conditions align.
How to Use:
Select your preferred inputs for EMAs, VWAP, and risk settings in the panel.
Analyze the chart for signals where buy/sell labels align with fresh VP spikes near Gann or previous day support/resistance.
Use the risk/reward table for strict money management.
Reference spike tables and session range for contextual confirmation.
Visuals and Chart Guidance:
The script displays only essential tables, lines, and labels described above.
All chart elements are explained in this description—no external scripts needed for interpretation.
Each table and marker is linked to actionable trading logic, eliminating clutter.
Closed-source Explanation:
The indicator uses session-based calculations, real-time data arrays, and proprietary math to unify Gann theory logic, large transaction detection, and multi-indicator confirmation. All major trade conditions have alert signals for ready integration with TradingView’s alert system.

Volume + RSI & MA Differential"Volume + RSI & MA Differential," integrates volume, RSI, and moving average differentials to generate trading signals. The script calculates a 14-period RSI to identify overbought or oversold conditions, with customizable thresholds for buy and sell signals. It also computes a 20-period SMA of the volume to smooth out trading activity data, helping to identify trends in market participation.
The script incorporates a fast (50-period) and a slow (200-period) SMA to analyze short-term and long-term trends, respectively. The differential between these moving averages, adjusted by the volume SMA, is used to identify potential trend changes or confirmations. Bars are colored yellow when the RSI is below the buy threshold and volume is high, indicating a potential buy signal. Conversely, bars turn red when the RSI is above the sell threshold and the fast MA is below the current close price, suggesting a potential sell signal. Neutral conditions result in grey bars.
Additionally, the script uses color-coding to plot the volume SMA and a line that changes color based on the moving average differential. A black line indicates a broadening MA cloud and a bullish trend, while a grey line suggests a narrowing MA cloud and a potential selloff. A yellow line signals the beginning of a buyback. This visual representation helps traders quickly identify potential trading opportunities and trend changes, making the script a valuable tool for technical analysis.

Volume Share
It represents the ratio of the trading volume of several major exchanges.
If abnormal transactions occur on a particular exchange, it can be intuitively detected.
The list of exchanges can be changed freely,
It is also possible to set whether to reflect it in the total amount as a reference.
It would be better to use it to reduce uncertain variables for healthy trading rather than unscientific signals.

Volume and Volatility Ratio Indicator-WODI策略名称
交易量与波动率比例策略-WODI
一、用户自定义参数
vol_length:交易量均线长度,计算基础交易量活跃度。
index_short_length / index_long_length:指数短期与长期均线长度,用于捕捉中短期与中长期趋势。
index_magnification:敏感度放大倍数,调整指数均线的灵敏度。
index_threshold_magnification:阈值放大因子,用于动态过滤噪音。
lookback_bars:形态检测回溯K线根数,用于捕捉反转模式。
fib_tp_ratio / fib_sl_ratio:斐波那契止盈与止损比率,分别对应黄金分割(0.618/0.382 等)级别。
enable_reversal:反转信号开关,开启后将原有做空信号反向为做多信号,用于单边趋势加仓。
二、核心计算逻辑
交易量百分比
使用 ta.sma 计算 vol_ma,并得到 vol_percent = volume / vol_ma * 100。
价格波动率
volatility = (high – low) / close * 100。
构建复合指数
volatility_index = vol_percent * volatility,并分别计算其短期与长期均线(乘以 index_magnification)。
动态阈值
index_threshold = index_long_ma * index_threshold_magnification,过滤常规波动。
三、信号生成与策略执行
做多/做空信号
当短期指数均线自下而上突破长期均线,且 volatility_index 突破 index_threshold 时,发出做多信号。
当短期指数均线自上而下跌破长期均线,且 volatility_index 跌破 index_threshold 时,发出做空信号。
反转信号模式(可选)
若 enable_reversal = true,则所有做空信号反向为做多,用于在强趋势行情中加仓。
止盈止损管理
进场后自动设置斐波那契止盈位(基于入场价 × fib_tp_ratio)和止损位(入场价 × fib_sl_ratio)。
支持多级止盈:可依次以 0.382、0.618 等黄金分割比率分批平仓。
四、图表展示
策略信号标记:图上用箭头标明每次做多/做空(或反转加仓)信号。
斐波那契区间:在K线图中显示止盈/止损水平线。
复合指数与阈值线:与原版相同,在独立窗口绘制短、长期指数均线、指数曲线及阈值。
量能柱状:高于均线时染色,反转模式时额外高亮。
Strategy Name
Volume and Volatility Ratio Strategy – WODI
1. User-Defined Parameters
vol_length: Length for volume SMA.
index_short_length / index_long_length: Short and long MA lengths for the composite index.
index_magnification: Sensitivity multiplier for index MAs.
index_threshold_magnification: Threshold multiplier to filter noise.
lookback_bars: Number of bars to look back for pattern detection.
fib_tp_ratio / fib_sl_ratio: Fibonacci take-profit and stop-loss ratios (e.g. 0.618, 0.382).
enable_reversal: Toggle for reversal mode; flips short signals to long for trend-following add-on entries.
2. Core Calculation
Volume Percentage:
vol_ma = ta.sma(volume, vol_length)
vol_percent = volume / vol_ma * 100
Volatility:
volatility = (high – low) / close * 100
Composite Index:
volatility_index = vol_percent * volatility
Short/long MAs applied and scaled by index_magnification.
Dynamic Threshold:
index_threshold = index_long_ma * index_threshold_magnification.
3. Signal Generation & Execution
Long/Short Entries:
Long when short MA crosses above long MA and volatility_index > index_threshold.
Short when short MA crosses below long MA and volatility_index < index_threshold.
Reversal Mode (optional):
If enable_reversal is on, invert all short entries to long to scale into trending moves.
Fibonacci Take-Profit & Stop-Loss:
Automatically set TP/SL levels at entry price × respective Fibonacci ratios.
Supports multi-stage exits at 0.382, 0.618, etc.
4. Visualization
Signal Arrows: Marks every long/short or reversal-add signal on the chart.
Fibonacci Zones: Plots TP/SL lines on the price panel.
Index & Threshold: Same as v1.0, with MAs, index curve, and threshold in a separate sub-window.
Volume Bars: Colored when above vol_ma; extra highlight if a reversal-add signal triggers

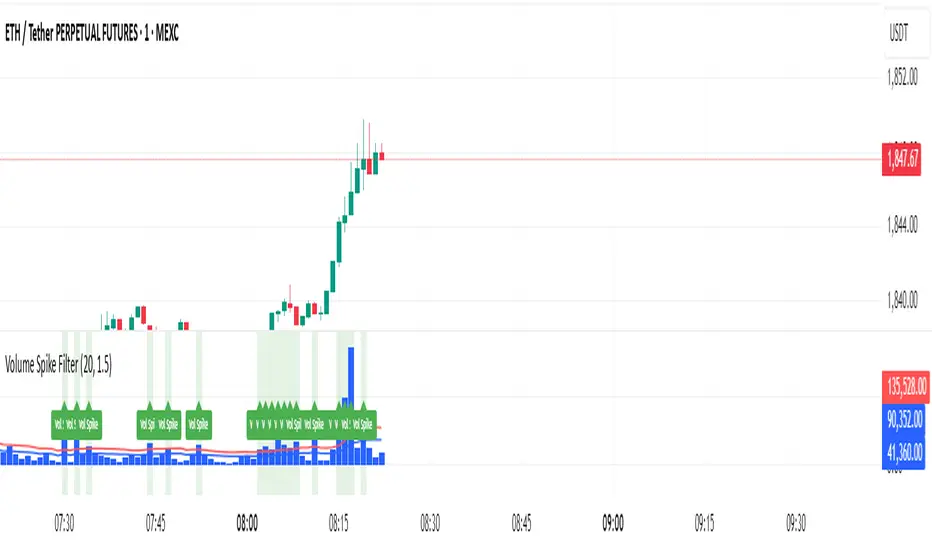
Volume Spike Filter### Volume Spike Detector with Alerts
**Overview:**
This indicator helps traders quickly identify unusual spikes in trading volume by comparing the current volume against a simple moving average (SMA) threshold. It's particularly useful for beginners seeking clear signals of increased market activity.
**Settings:**
* **SMA Length:** Defines the period for calculating the average volume (default = 20).
* **Multiplier:** Determines how much the volume must exceed the SMA to be considered a spike (default = 1.5).
* **Highlight Spikes:** Toggle to visually highlight spikes on the chart (default = enabled).
**Signals:**
* 🟩 **Highlighted Background:** Indicates a volume spike that surpasses the defined threshold.
* 🏷️ **"Vol Spike" Label:** Clearly marks the exact bar of the spike for quick reference.
**Usage:**
Use these clear volume spike alerts to identify potential trading opportunities, confirmations, or shifts in market momentum. Combine this with other technical indicators for enhanced analysis.
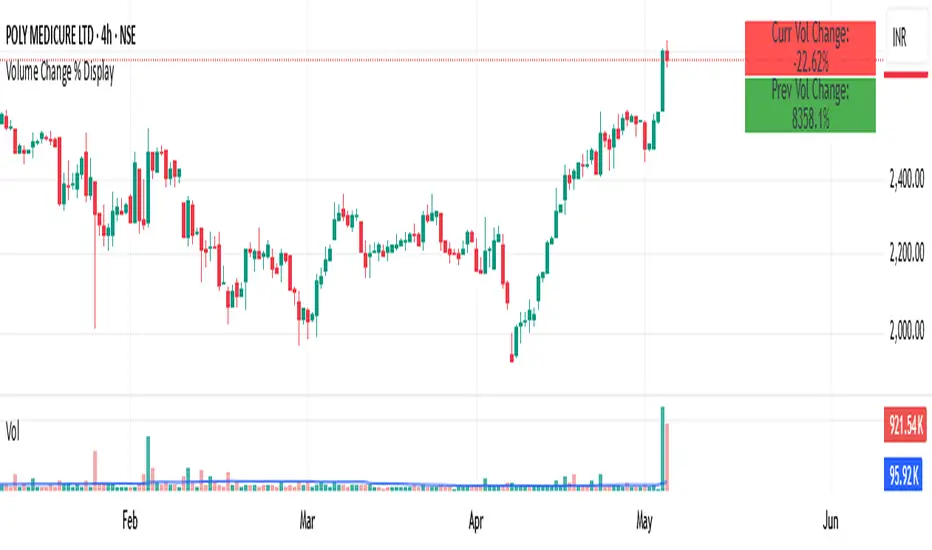
Volume Change % Display1- Current bar's volume change %
2- Previous bar's volume change %
* Each line uses its own color based on volume rising or falling.
* Keeps the layout compact and readable.
Volume Disharmony IndicatorThis indicator is designed to detect imbalanced volume compared to the open/close of the corresponding candle body. The idea is that institutions often trade in higher volume within a smaller price range. Identifying these can give an indication if there is a rally or selloff happening. The code looks at the median of all the prior candles from the point of the last trigger and compares them to the range in body of the candles in order to dynamically find a baseline, by which imbalances can be more accurately detected throughout changing market conditions.

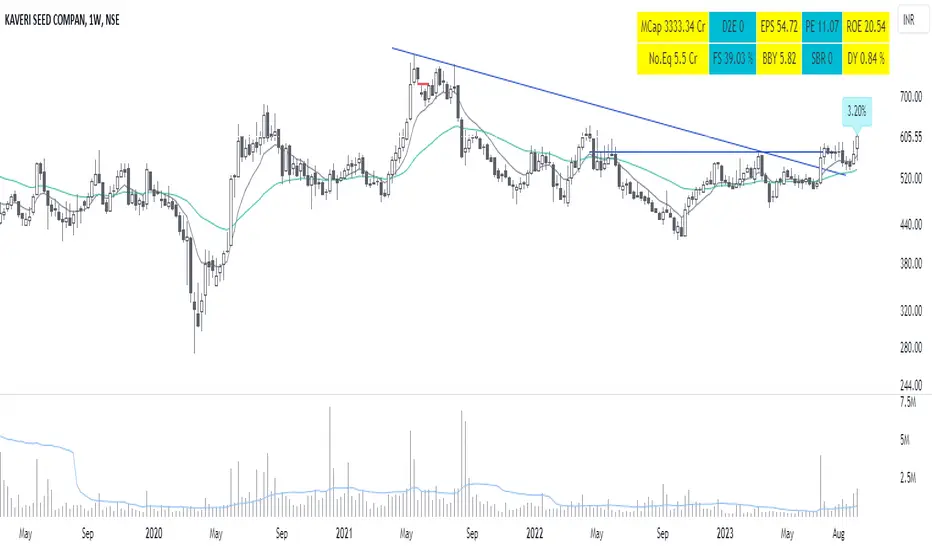
Volume Traded in Total Outstanding Shares with basic fundamentalThis indicator helps to find Volume Traded in Total Outstanding Shares with basic fundamental parameters like MCAP, EPS, PE, D2E and No. Equity shares.
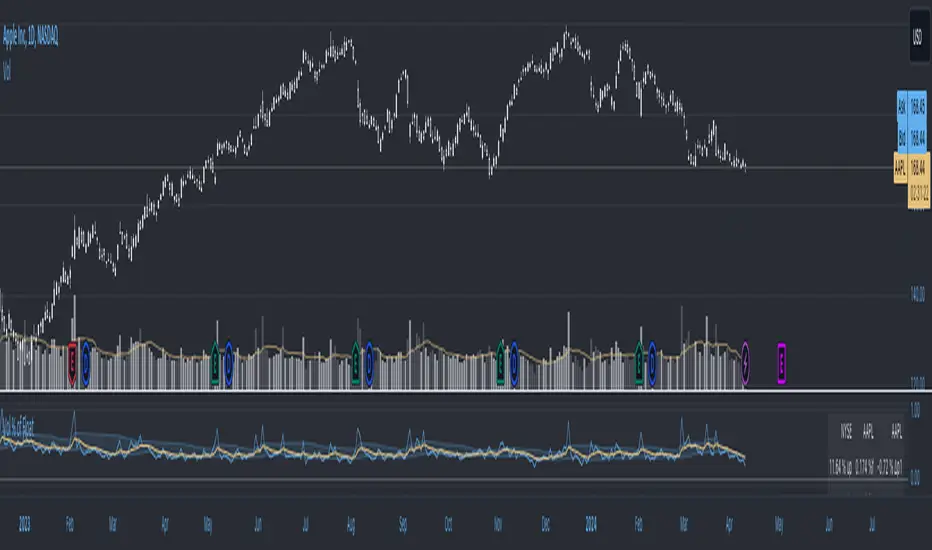
Volume as a Percent of Float by 3iauVolume as a Percent of Float
Plot the difference between current Chart Volume as a percent of Float/Outstanding and the moving average of the same.
Apply a multiplier to this value.
Plot the moving average of the difference between current Chart Volume as a percent of Float/Outstanding and the moving average of the same.
Volume [Entoryx]
Certainly! Here's a more concise description for the "Entoryx Volume" indicator, with less focus on the specifics of the order block bar detection:
The "Entoryx Volume" is a versatile technical indicator that analyzes the relationship between price ranges and volume over a user-defined number of bars. By calculating a delta between the highest high and lowest low, it offers insights into market momentum and direction.
Key features of this indicator include:
1) Current Value Plotting: A dynamic line plotted on the chart represents the current value, which reflects market trends. The color of the line changes to green for bullish conditions and red for bearish conditions, depending on its relationship with the Exponential Moving Average (EMA) of the close.
2) Color-Coded Regions: The area between the current value plot and a baseline zero line is filled with a corresponding color, providing a visual representation of market sentiment.
3) Boundary Lines: Horizontal lines at +10 and -10 serve as reference points to highlight significant market movements.
4) Order Block Bar Detection (Optional): An optional feature that places visual markers on the chart to signal potential reversals. This can be enabled or disabled by the user, according to preference.
The "Entoryx Volume" indicator is tailored for traders aiming to understand market momentum with a clear and visually intuitive display. It is suitable across various trading strategies and market conditions, with customization options to fit individual needs.
The source code for this indicator is subject to the terms of the Mozilla Public License 2.0.

Volume accumulation [TCS] | VTAThe indicator calculates buy and sell volume values for different look-back periods, based on the high, low, close, and tick volume data of the chart.
The calculated buy and sell volume values are stored in separate variables, which represent cumulative volume values over the respective look-back periods.
It's important to note that the code provided calculates the buy and sell volume values individually for each look-back period and after sum them.
It can be useful to understand who is in control of the market based on the look-back period.
For example if the price is decreasing but the volume in the past candle are bullish it means that the trend probably will turn.
Please note that this indicator is for educational purposes only and should not be used for trading without further testing and analysis.

Volume Flow OscillatorIntroducing the "Volume Flow Oscillator" indicator, a powerful and adaptable tool that incorporates the PeacefulIndicators library to analyze price movement strength and volume in the market. This indicator is designed to assist you in detecting potential opportunities and improving your trading analysis.
The Volume Flow Oscillator indicator offers the following features:
Adjustable input parameters, allowing you to modify the source (HLCC4 by default) and the short length to match your trading style and preferences.
A visually appealing display, with the Volume Flow Oscillator line in orange, a zero line in gray, and filled areas between the 70 and -70 levels in blue, making it easy to interpret the indicator's signals.
The core functionality of the Volume Flow Oscillator indicator is powered by the volume_flow_oscillator function from the PeacefulIndicators library, ensuring accurate and reliable results.
To start using the Volume Flow Oscillator indicator in your trading analysis, simply add the script to your chart and customize the input parameters as needed. We hope this script, built upon the PeacefulIndicators library, proves to be a valuable addition to your trading strategy.

Volume+ (Time of Day)This volume indicator measures the volume for each bar at the time of day and displays the average and +1 standard deviation above that average.
The color intensity of the bar is increased when the volume exceeds +1 standard deviation.
See how on the chart that other than the early morning and late day volume, there are clearly key moments in the day at 7am, 10am, 10:30am, and 11am. See how on the second day, there were volume spikes before 10am, 10:30am and then more obviously just before 11am.

Volume Profile Channel [CE]Volume Profile Channel
Volume Profile Channel, Is the first of its kind tool that will plot a volume profile in any directional channel, the tool will calculate a profile and display the following, POC/VAH/VAL.
The typical profile works by on a horizontal access such that ticksize can be calculated along the y axis and data can then be used to generate a profile, the angle of a parallel channel would make this unavailable.
By cleverly using the angle at which the profile is created, a diagonal ticksize is generated and applied to the profile to create a first of its kind parallel channel volume profile tool!
User Controllable Width:
As compared to the above or below images, users have the ability to control the width this will allow them to show how much of the space the profile will draw on the chart with, using the value "0"
can be done to completely remove the profile whilst still tracking the POC,VAH,VAL
0 Width:
Users can the total number of rows,
Number Of Rows 50:
Ability to "anti-alias" the profile as well below will show a comparison of this occurring:
Unsmoothed
Smoothed
The advantage of using this is that as opposed to relying datasets of mid points or custom equal values along a parallel channel , users can now use the profile to see where the channel has the most interaction, (POC).
This allows for an objective look into the data as opposed to identifying by "eye" where traders are exchanging hands or vs using values such as the midpoint which may not necessarily always be a point of interest as the POC will be.
The VAH/VAL levels give good opportunity to see reactions at levels we may not previously be able to see in the channel with fixed values, allowing us to take positions in a more dynamic sense which may not be identifiable with fixed positions, 0.25,0.5,0.75 etc...

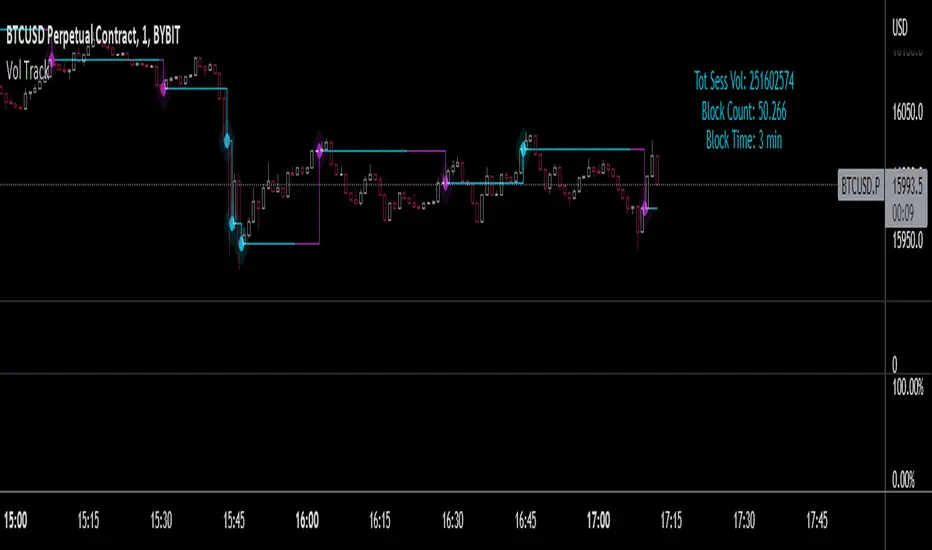
Volume Block Tracker- This script was developed to accompany order flow analysis on other platforms where volume candle charts can be tracked.
- The plot shows where volume blocks of a certain size have been completed, and a color change shows when they are getting close to completion.
- The accumulative volume count starts from zero at the beginning of each daily session.
- Alerts can be set for when each volume block is completed (or is partially completed).
- Alerts can also be set for when blocks are completed within a certain time such as fast 1 minute blocks.
- The indicator is optimized for use with BTCUSD but may work with others.
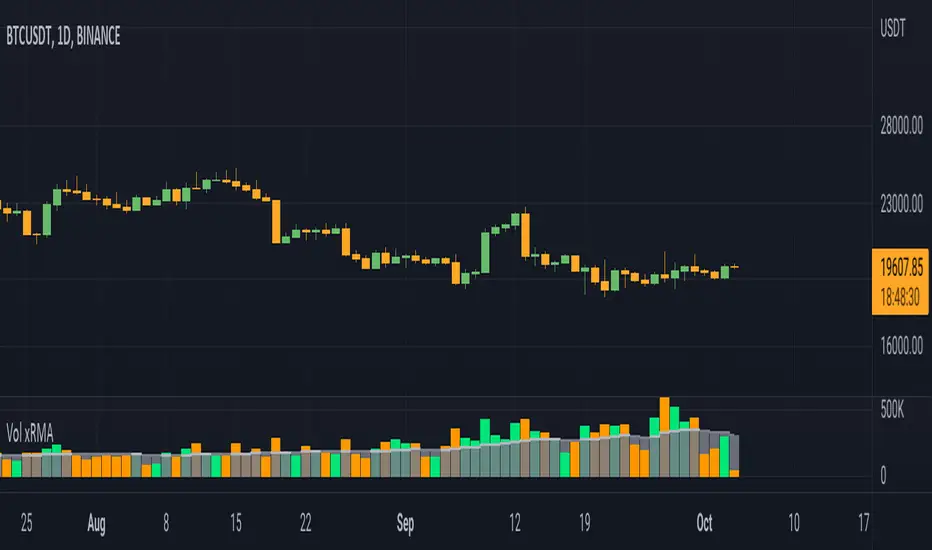
Volume xRMAInspired from Volume xSMA.
Few changes from Volume xSMA
1. MA changed from SMA to RMA (better smoothness and filtering)
2. xRMA plot modified to cloumn and stepline combined (for better visibility)
3. Color pallete changed (personal liking)
Thanks for the support.
Volume Buy/Sell (by iammaximov)Buy/Sell Volume
Buy/Sell volume based on total bar amplitude (high/low price) and close/open (for calculate vbuy > vsell or vbuy < vsell)

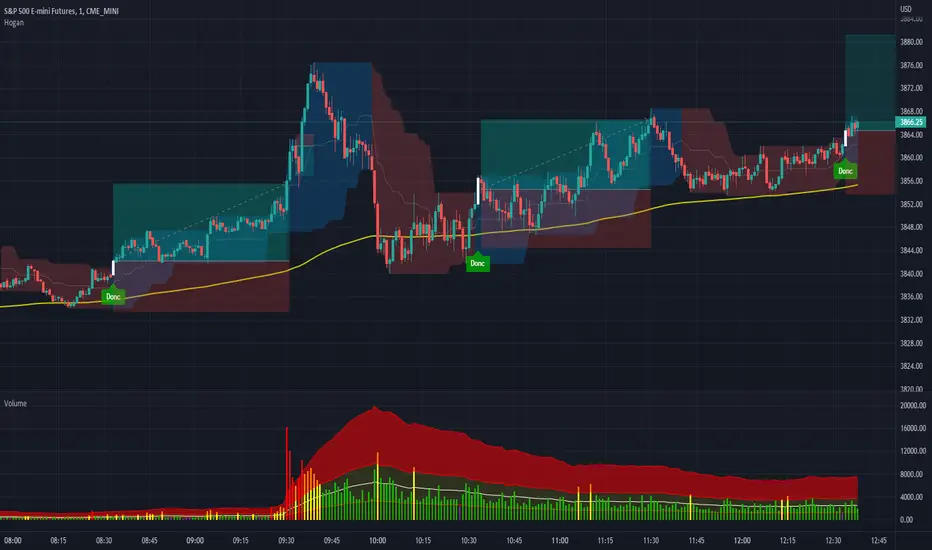
Volume Spread for VSA CustomHey everyone, I have been using volume a lot more lately as price action can sometimes get manipulated but volume shows us the truth!
Anyways, I have enjoyed the Volume Spread for VSA indicator but wished I had the code to change a few settings. This volume indicator includes spread analysis with the ability to customize input values and I'm making it open source so you can do with it as you please.
I have made notes all throughout the code to give suggestions on a few changes or why I have written it in such a way. I have also tried to section everything off to make it easier to see where each piece of the code is used. Overall I think it is a good example of how to code cleanly and how to add useful notes when you are learning Pine for yourself :D
The indicator on the price chart is my Donchian Channel indicator, which you can also find on my profile. This is the one I use every day.
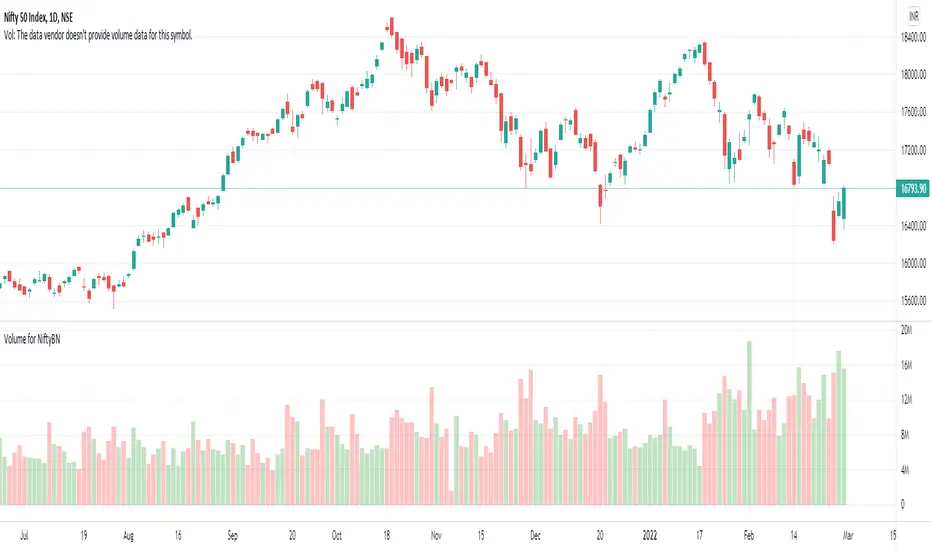
Volume for NiftyBNTo see the volume of Nifty and Banknifty indices we often refer to their Futures chart. With the help of this script, you can directly plot the volume of Nifty Futures over the Nifty chart and Bank Nifty Futures over the Bank Nifty chart.
If the scrip entered is other than Nifty or Bank Nifty it will plot the default volume of that scrip.
Volume based support resistance with SwingThere has been an endless debate on how to derive volume levels on the Price Action
One such method which I have encountered (being pointed by one of my followers Anjan Gadade)
is to take the (High+Low+close)/3, as an ambient level when volume is above average (sma20) and also when volume is above its Standard Deviation 2
To make sense of the volume level structure I tested it with Swing points, for extra confluence, and i must say, this can be used as a good indication of trend if combined together
So I thought to open Source it, to people who might be looking for a much visual Interpretation!
Enjoy!
Volume Bar Breakout and Breakdown IndicatorVolume shows strength of a movement and highest volume shows the region that pushed price to certain extent with full strength. Breakout or Breakout of the highest volume bar range shows continuity further push by sellers or buyers indicating a trend continuation for a small period if not for long duration. Entries can be taken once signal is generated with stoploss as recommended.
Guidelines:
Don't trade if range is too large
Don't trade if Breakdown or Breakdown candle body / range is too large or if there is high volatility
Use additional indicator to get the idea of overall trend analysis
