Volume-Price Shift Box (Lite Version)Description
This indicator is a clean and intuitive visual tool designed to help traders quickly assess the current balance of bullish and bearish forces in the market.
It combines volume, price movement, VWAP, and OBV dynamics into a compact on-chart table that updates in real time.
This version focuses on the core logic and visualization of momentum and volume shifts, making it ideal for traders who want actionable insight without complex configuration.
How It Works
The script measures the combined strength of multiple market components:
VWAP trend indicates price bias relative to fair value.
OBV (On-Balance Volume) tracks volume flow to confirm or contradict price movement.
Volume ratio compares current volume to its recent average.
Momentum evaluates directional price movement over a configurable lookback period.
Accumulation / Distribution (A/D) Line estimates buying or selling pressure within each candle:
↑ — A/D is rising (buying pressure is increasing)
↑↑ — A/D is rising faster than before (acceleration of buying)
↓ — A/D is falling (selling pressure is increasing)
↓↓ — A/D is falling faster than before (acceleration of selling)
Each of these components contributes to an overall shift score.
Depending on this score, the box displays:
🟢 Bullish Shift — strong upward alignment
🔴 Bearish Shift — downward alignment
⚪ Neutral — mixed or indecisive conditions
Key Features
Compact on-chart information box with color-coded parameters
Combined volume-price relationship model
Configurable lookback and sensitivity controls
Real-time shift strength and trend duration tracking
Adjustable EMA/SMA smoothing for all averages
Lightweight design optimized for clarity
Inputs Overview
Box Position / Size – Place and scale the on-chart info box
Lookback Period – Number of bars used for calculations
VWAP Lookback – Period for VWAP distance smoothing
Shift Sensitivity – Adjusts reaction strength of bullish/bearish shifts
Neutral Zone Threshold – Defines when the market is considered neutral
EMA or SMA – Choose exponential or simple moving averages
Component Weights – Set the influence of VWAP, OBV, Volume, and Momentum on the shift score
Display Toggles – Enable or disable metrics shown in the box (Strength, Volume, VWAP, Duration, OBV)
How to Use
Apply the indicator to any symbol and timeframe.
Observe the box on the chart — it updates dynamically.
Look for transitions between Neutral → Bullish or Neutral → Bearish shifts.
Combine with your existing price action or confirmation tools (e.g., support/resistance, trendlines).
Use the “Strength” and “Duration” values to assess consistency and momentum quality.
(This indicator is not a buy/sell signal generator — it is designed as a contextual analysis and confirmation tool.)
How It Helps
Merges several key volume and price metrics into a single view
Highlights transitions in market control between buyers and sellers
Reduces clutter by presenting only relevant context data
Works on any market and timeframe, from scalping to swing trading
⚠️Disclaimer:
This script is provided for educational and informational purposes only. It is not financial advice and should not be considered a recommendation to buy, sell, or hold any financial instrument. Trading involves significant risk of loss and is not suitable for every investor. Users should perform their own due diligence and consult with a licensed financial advisor before making any trading decisions. The author does not guarantee any profits or results from using this script, and assumes no liability for any losses incurred. Use this script at your own risk.
Cerca negli script per "volume"

Volume Candle Rings [CHE]Volume Candle Rings – Spot Volume Extremes Fast 🔍
Marks exceptionally high volume right on the candle as concentric rings. Instantly see how extreme the spike is (levels 1–10), where it happens (anchor on HL2/Close/BodyMid), and how big it is relative to volatility (ATR-scaled). No magic, no blind signals—just clean context for better decisions.
Why it helps 🎯
Catch true extremes: Positive-side Z-Score maps spikes into 10 levels. By default, only 8/9/10 show—the ones that matter.
Context over clutter: Rings sit on the candle, scale with ATR (market regime), and widen in bars (time). Read absorption, breakout thrusts, or capitulation in context.
Signal the new, not the noise: Optional OFF→ON only drawing cuts chart noise and highlights fresh events.
How it works ⚙️
Z-Score: `z = (Vol – SMA(Vol, lookback)) / StDev(Vol, lookback)` → clipped at `zScoreCap`, normalized, and binned to 1..10 (0 = none). Only z > 0 counts.
Geometry: Vertical diameter = `Level × ATR(atrLength) × atrPerLevel`; horizontal radius = `Level × xBarsPerLevel` bars; curvatureFactor controls roundness.
Anchor: Choose HL2, Close, or BodyMid for the vertical center.
Performance: Keeps up to maxStoredCircles; FIFO cleanup to stay smooth.
Typical use cases 📈
Breakout confirmation: Clusters of 8–10 at range edges → rising initiative.
Absorption / fade: Extreme ring (9–10) without follow-through → potential stall or reversal.
Blow-off / climax: Single huge ring after a long run → higher odds of mean reversion.
News filtering: Show the real outliers, not every minor bump.
Inputs (mapped 1:1) 🧩
Z-Score & Levels
Lookback (SMA/StDev) – default 200
Z-Score Clipping – default 5.0
Behavior
Draw every bar – default ON; OFF = only on OFF→ON switches
Max circles to retain – default 120
Anchoring & Geometry
Anchor on candle – HL2 / Close / BodyMid
ATR Length – default 50
ATR per Level (Y) – default 0.25
Bars per Level (X) – default 0.15
Circle curvature – default 0.70
Level Selection (1–10)
Default: 8/9/10 ON, 1–7 OFF. Colors grade from teal/green → orange → red; fill opacity separate.
Quick presets ⏱️
Intraday (1–5m): Lookback 150–250, Cap 4.0–5.0, ATR/Level 0.20–0.30, Bars/Level 0.10–0.20, Draw every bar OFF.
Swing (1H–1D): Lookback 200–300, Cap 5.0, ATR/Level 0.25–0.35, Bars/Level 0.15–0.25, keep 8–10.
Aggressive scouting: Also enable Level 7 for early accumulation.
Pro tips 💡
Control object load: Reduce maxStoredCircles or switch Draw every bar OFF on busy charts.
Seek confluence: Combine rings with S/R, range edges, VWAP, session H/L. A ring is information, not an entry by itself.
Color discipline: Reserve red (9/10) for true extremes; keep lower levels subtle.
Limits & notes 🧭
This is visualization, not alerts or auto signals.
Many polylines can slow charts—tune Behavior settings.
Works across markets/timeframes; adapt parameters to the asset’s character.
Who it’s for 🙌
Traders who read volume in price context—breakouts, fades, reversals. See when the market is truly stepping on the gas.
Volume Candle Rings \ turns raw volume into precise, scale-aware markers. Spot extremes faster, avoid confusing “loud” with “important,” and make cleaner, context-driven decisions. 🚀
Disclaimer
The content provided, including all code and materials, is strictly for educational and informational purposes only. It is not intended as, and should not be interpreted as, financial advice, a recommendation to buy or sell any financial instrument, or an offer of any financial product or service. All strategies, tools, and examples discussed are provided for illustrative purposes to demonstrate coding techniques and the functionality of Pine Script within a trading context.
Any results from strategies or tools provided are hypothetical, and past performance is not indicative of future results. Trading and investing involve high risk, including the potential loss of principal, and may not be suitable for all individuals. Before making any trading decisions, please consult with a qualified financial professional to understand the risks involved.
By using this script, you acknowledge and agree that any trading decisions are made solely at your discretion and risk.
Best regards and happy trading
Chervolino

Volume Signal RSIVolume Signal RSI (VSR) Indicator
Overview:
The Volume Signal RSI (VSR) indicator combines traditional RSI analysis with statistically significant volume detection to identify potential reversal points and exhaustion signals in crypto markets. By applying statistical methods to volume analysis, VSR filters out normal market noise and highlights only the most meaningful volume spikes.
Key Features:
- Standard RSI overbought/oversold signals (70/30)
- Statistical volume significance detection using z-scores and p-values
- Exhaustion signals for potential market reversals
- Enhanced alert system with actionable trading context
How to Use This Indicator
Basic Signals:
- RSI Line: The blue line shows the standard RSI value (default period: 14)
- Overbought/Oversold Levels: Standard levels at 70/30 with additional extreme levels at 80/20
- Volume Detection: Small circles appear on the RSI line when statistically significant volume is detected
Trading Signals
1. Oversold Alert (🔴): When RSI crosses below 30
- Indicates potential support area
- Consider for long entries when price shows signs of stabilizing
2. Overbought Alert (🟢): When RSI crosses above 70
- Indicates potential resistance area
- Consider for short entries when price shows signs of topping
3. Bear Exhaustion Signal (⚠️): When bearish volume appears in oversold territory
- Indicates a potential selling climax
- Strong reversal signal when accompanied by positive price action
- Best used for counter-trend entries during downtrends
4. Bull Exhaustion Signal (⚠️): When bullish volume appears in overbought territory
- Indicates a potential buying climax
- Strong reversal signal when accompanied by negative price action
- Best used for counter-trend entries during uptrends
Alert Messages:
Alert messages contain critical information formatted for quick analysis:
- Symbol and timeframe
- Current price and RSI value with direction indicator
- Volume metrics: z-score, deviation percentage, and statistical confidence
- Trading context suggestion
Statistical Methodology:
- Z-Score: Measures how many standard deviations the current volume is from the mean
- P-Value: Statistical measure of significance (lower values = more significant)
- Confidence: Displayed as a percentage (higher = more confidence in the signal)
- Volume Deviation: Percentage above/below the average volume
Best Practices
1. Confirm signals with price action or other indicators
2. Higher timeframes typically produce more reliable signals
3. Use the statistical confidence percentage to gauge signal strength
4. Most powerful signals occur when exhaustion signals coincide with key support/resistance levels and there a quarter or more wick size at top of candle(buying exhaustion) or at bottom of candle (selling exhaustion)

Volume NodesVolume Nodes Indicator:
What This Indicator Does:
The Volume Nodes indicator identifies and visualizes statistically significant volume events on your chart, helping you identify important price levels where substantial trading activity has occurred. Unlike standard volume indicators, Volume Nodes:
Uses statistical analysis (z-scores) to identify truly abnormal volume bars
Calculates accurate buy/sell volume ratios by analyzing all lower timeframe data
Identifies the Volume Point of Control (VPOC) for high volume areas
Visualizes significant volume ranges as they extend across the chart
Tracks when price interacts with these important levels
Key Features:
High Volume Detection: Highlights bars with unusually high volume (z-score above threshold)
Low Volume Detection: Highlights bars with unusually low volume (z-score below threshold)
VPOC Lines: Horizontal lines showing the exact price level with maximum volume concentration
Volume Range Fills: Shaded areas showing the entire price range with significant volume
Accurate Volume Metrics: Shows true buy/sell volume ratios or delta percentages derived from lower timeframe data
How to Use It in Your Trading: **Move to front in the visual order on chart**
Step 1: Identify Important Volume Zones
High Volume Bars (green/red candles) indicate where significant buying or selling has occurred
VPOC Lines extending from these bars show you the exact price level with highest volume
Range Fills show you the entire zone where significant volume occurred
Step 2: Use These Levels for Trading Decisions
Support/Resistance: VPOC lines often act as support or resistance levels
Breakout Validation: Breakouts on high volume are more likely to be valid
Low Volume Warning: Low volume bars (yellow) often indicate indecision or potential reversals
Trading with Volume Flow: Use the buy/sell ratio or delta % to confirm the strength and direction of moves
Step 3: Monitor Price Interaction with Volume Zones
When price approaches a VPOC line, watch for reaction (bounce or breakout)
When price enters a volume range area, increased volatility often follows
When price crosses a VPOC line, the line changes transparency indicating it's been tested
Tips for Optimal Use
Higher Timeframes: The indicator works exceptionally well on higher timeframes (4H, daily, weekly) where volume patterns are more significant
Range Trading: Use volume nodes to identify the boundaries of trading ranges
Combine with Price Action: Look for price action confirmation (rejections, engulfing patterns) at VPOC levels
Multiple Timeframe Analysis: Compare volume nodes across different timeframes to find confluent levels
Alert Setup: Set up alerts for when price enters important volume zones or crosses VPOC lines
Reversal Signals: High volume bars with significant wicks often signal exhaustion points where smart money is transferring positions. Bullish candles with long upper wicks suggest sellers absorbing buying pressure at highs, while bearish candles with long lower wicks indicate buyers stepping in at lows - both potentially signaling momentum shifts that precede reversals.
The indicator is particularly valuable for identifying levels where large players have been active in the market and are likely to defend or act again in the future.

Volume Delta Average by Periods OscillatorVDAP Oscillator (Volume-Delta Average by Periods Oscillator) is a supercharged trading tool that helps you spot trends and assess their strength with ease! 🚀🔍 It's like a VZO on steroids—giving you an even more powerful and clear understanding of market shifts. By using the average volume delta across custom periods, it shows how market sentiment shifts, giving you a crystal-clear view of buying and selling pressures. With 12 vibrant color-coded zones, it’s like a rainbow for your charts! 🌈📊
Along with the colorful zones, this oscillator has an intuitive table that breaks down the trend, its strength, percentage, and visual rating using emojis. Whether you're a rookie or a seasoned pro, it’s designed to be ultra-accessible and easy to read! 📈✨ The table lets you see the trend's strength at a glance, so you can make quick decisions without any confusion. 🧠✅
Key Features:
✅ 12 color-coded zones for clear trend direction and strength 🌈
✅ Customizable periods to fit your analysis needs ⏳
✅ Trend strength table with easy-to-understand metrics 💪
✅ Change percentage 📉📈
✅ Emoji-based visual ratings ⭐️
✅ User-friendly interface for effortless reading 👀
✅ Accurate and efficient for better decision-making ⚡
What We're Missing:
❌ No overly complicated settings – keeping it simple, no unnecessary clutter ⚙️
❌ No complex back-testing options for deep strategy testing 📉
❌ No built-in real-time alerts for instant notifications ⏰
❌ Doesn’t overcomplicate things with endless features – it’s focused, and that’s a good thing! 🎯
In short, the VDAP Oscillator is your go-to, colorful tool for analyzing market trends quickly and accurately. Whether you're trading stocks 📉, crypto 💎, or forex 💱, this indicator will keep you in the loop and ahead of the game!

Volume Zones [Blocks]📦 Volume Zones — Smart Volume Detection, Visualized.
Want to spot high-impact candles and key zones of interest with one glance?
Volume Zones is your new edge in reading volume like a pro.
🚀 What it does:
Detects abnormal volume activity using Z-Score logic.
Automatically highlights candles with significant volume spikes as:
⚡ Z1: Noticeable activity
⚡ Z2: Strong participation
⚡ Z3: Potential climax or reversal zone
Builds smart zones (blocks) around these candles to track key price levels and possible mitigation zones.
🧠 Why it's powerful:
No more guessing if a candle matters — let the math speak.
Helps identify:
True breakouts vs fakeouts
Potential reversal zones
Volume-based POIs
Customizable visualization — from color to length, even block opacity.
💡 Use cases:
Combine with Smart Money concepts to validate sweeps and FVGs.
Pinpoint zones where big players stepped in — and where price might return.
Analyze if a breakout is supported by real volume or just noise.
⚙️ Bonus Features:
Compact marker mode for minimalists.
Middle line option for extra precision.
Performance-optimized: limits number of boxes on chart.
Volume v3 by Koenigsegg🔹 Overview
The Custom Volume Indicator is designed for traders who prefer to view volume in a dedicated sub-window below the price chart, similar to RSI or MACD. Unlike TradingView’s built-in volume indicator, which overlays directly on the main chart, this version provides a cleaner layout by displaying volume in a separate panel.
🔹 Why Use This Indicator?
While TradingView provides a default volume indicator, this version is built for traders who prefer a separate volume panel for improved clarity and focus. Key differences:
✅ Dedicated Lower Panel Display – Unlike the default volume indicator, this version is displayed in a standalone sub-window, keeping the price chart clear.
✅ Better Chart Visibility – Helps traders separate volume analysis from price action, making trend confirmation easier.
🔹 Features
✅ Displays volume in a separate panel below the price chart for a clearer trading view.
✅ Custom color-coded volume bars for bullish volume and bearish volume.
✅ Optional Volume Moving Average (MA) for tracking volume trends.
✅ Optional Smoothed Volume Moving Average (MA) for tracking volume trends
✅ Sound Alerts on Volume Spikes, Drops and more – Get notified of significant changes in volume.
✅ Built-in Alert Sound Options – Choose from different TradingView notification sounds.
✅ Customizable settings:
- Toggle the MA on/off as needed.
- Adjust the MA length (default: 20).
- Set alert thresholds for high or low volume warnings.
📊 How to Use
- Identify high-volume breakouts and low-volume consolidations.
- Use the Volume Moving Average to confirm trends and market participation.
- Spot bullish/bearish volume surges to strengthen trade decisions.
⚠️ Disclaimer
This indicator is for educational and informational purposes only. It does not provide financial advice or trade signals. Always conduct your own research before making any trading decisions.

Volume v2 by Koenigsegg📌 Custom Volume Indicator (Separate Panel with original Alerts & Built-in Sounds)
🔹 Overview
The Custom Volume Indicator is designed for traders who prefer to view volume in a dedicated sub-window below the price chart, similar to RSI or MACD. Unlike TradingView’s built-in volume indicator, which overlays directly on the main chart, this version provides a cleaner layout by displaying volume in a separate panel.
🔹 Why Use This Indicator?
While TradingView provides a default volume indicator, this version is built for traders who prefer a separate volume panel for improved clarity and focus. Key differences:
✅ Dedicated Lower Panel Display – Unlike the default volume indicator, this version is displayed in a standalone sub-window, keeping the price chart clear.
✅ Better Chart Visibility – Helps traders separate volume analysis from price action, making trend confirmation easier.
🔹 Features
✅ Displays volume in a separate panel below the price chart for a clearer trading view.
✅ Custom color-coded volume bars for bullish volume and bearish volume.
✅ Optional Volume Moving Average (MA) for tracking volume trends.
✅ Sound Alerts on Volume Spikes, Drops and more – Get notified of significant changes in volume.
✅ Built-in Alert Sound Options – Choose from different TradingView notification sounds.
✅ Customizable settings:
- Toggle the MA on/off as needed.
- Adjust the MA length (default: 20).
- Set alert thresholds for high or low volume warnings.
📊 How to Use
- Identify high-volume breakouts and low-volume consolidations.
- Use the Volume Moving Average to confirm trends and market participation.
- Spot bullish/bearish volume surges to strengthen trade decisions.
⚠️ Disclaimer
This indicator is for educational and informational purposes only. It does not provide financial advice or trade signals. Always conduct your own research before making any trading decisions.

Volume Metrics & Market CapitalizationThis Pine Script indicator provides a comparative view of volume metrics and market capitalization to help traders analyze relative volume strength in the context of a stock’s overall size.
Key Features:
Volume Formatting:
Converts numerical values into readable units (K for thousand, M for million, B for billion, T for trillion).
Volume Metrics:
Displays current bar volume, cumulative daily volume, and 30-day average volume.
Market Capitalization Calculation:
Uses the outstanding shares multiplied by closing price to estimate market cap.
Table Display:
Shows all these values in an easy-to-read table in the bottom-right of the chart.
How It Helps Compare Relative Volume to Market Cap
Relative Volume Strength
By comparing current volume and 30-day average volume, traders can quickly gauge if today’s volume is unusually high or low.
If daily volume exceeds the 30-day average, it suggests increased market interest in the stock.
Market Cap Context
Market cap provides a reference for whether a stock is large-cap, mid-cap, or small-cap, influencing how volume should be interpreted.
A high volume surge in a low market cap stock may indicate stronger momentum compared to the same volume change in a large-cap stock.
Liquidity and Volatility Signals
Comparing volume to market cap helps determine liquidity—stocks with low market cap but high volume may be more volatile.
Example: A small-cap stock with $50M market cap trading $20M daily volume is seeing 40% turnover, a significant indicator of strong movement.
Practical Use Case
Day Traders: Spot stocks experiencing unusual volume surges relative to their market cap, identifying potential breakout or momentum plays.
Swing Traders: Assess if a stock is trading at above-average volume levels, confirming strength in trends.
Investors: Understand liquidity and potential institutional interest in stocks, as larger players typically trade in high market-cap names with sustained volume.
This indicator is a quick-glance tool for identifying high-volume stocks relative to their size, helping traders make more informed decisions on potential opportunities. 🚀

Volume ComparisonThis indicator is designed to visually compare the current day's trading volume against the average trading volumes of 3, 5, and 10 days. It highlights certain conditions based on the comparison and provides alerts.
Inputs for Customization:
1. The user can toggle visibility for the 3-day, 5-day, and 10-day average volumes using boolean inputs.
2. Average Volume Calculation:
This indicator calculate simple moving averages of the trading volume for 3, 5, and 10-day periods.
3.Conditions:
The indicator checks whether the current day's volume is greater than the respective moving averages for 3, 5, and 10 days.
4. Background Color for Visual Indicators:
If the current day's volume is greater than any of the averages and the corresponding option is enabled, the background color is adjusted:
* Green if the volume is greater than the 3-day average.
* Blue if the volume is greater than the 5-day average.
* Red if the volume is greater than the 10-day average.
5. Plotting the Averages:
The moving averages are plotted on the chart, with different colors for each (green for 3-day, blue for 5-day, and red for 10-day).
6. This indicator can be used to help visually track whether today's volume is above the moving average, which can signal increased market activity or interest.

Volume Distribution Before/After Top
Description
This script visualizes the distribution of volume before and after a price peak within a specified time interval. The green area represents the volume accumulated before the peak, and the red area represents the volume accumulated after the peak. The script also calculates and displays the volume-weighted average price (VWAP) on each side of the peak with a dotted line and a label.
The key features include:
Volume Visualization: Transparent green and red bars indicate volume fractions before and after the peak.
VWAP Markers: Centered labels with VWAP values are plotted above the corresponding levels.
Interactive Inputs: Define the start and end points of the analysis interval using customizable anchor times.
This tool is ideal for traders who want to analyze how volume dynamics are distributed around key price levels. It can help identify potential zones of support and resistance and improve the understanding of market behavior in response to volume accumulation.
Instructions
Select the start and end anchor times using the input fields.
Observe the volume distribution and VWAP levels on the chart.
Use the visual data to make more informed trading decisions.

Volume Trend Oscillator v1indicator stands out from traditional oscillators due to its focus on volume dynamics as a driver of market trends. while many oscillators are price-based, this one integrates volume activity directly into its calculations, which provides unique insights into the strength and direction of trends influenced by buying and selling pressure.
unique features
focus on volume trends
the oscillator emphasizes the distinction between bullish (upward) and bearish (downward) volume. it calculates moving averages of up and down volumes, allowing for a clear view of the net volume influence in the market.
net volume normalization
the oscillator derives its value by comparing up and down volume relative to the total net volume. this normalization ensures that the indicator adapts to varying market conditions, highlighting meaningful trends rather than absolute volume changes.
trend-sensitive background highlights
the indicator uses customizable thresholds for bullish and bearish zones. when both the oscillator and its moving average cross the thresholds, the background color changes, offering a visual cue for trend identification. this makes it easy to spot potential trend shifts.
smoothing with moving averages
the inclusion of a moving average line of the oscillator provides additional smoothing, helping to filter out noise and offering a clearer signal.
neutrality awareness
the neutral line (set at 0) and visual thresholds give traders a balanced view of market indecision or consolidation, further differentiating it from traditional oscillators that may lack a well-defined neutral state.
non-overlay and clarity
the oscillator is plotted in a separate pane, keeping the chart clean and focused. its simplicity ensures that users can quickly interpret signals without being overwhelmed.
benefits of this approach
volume-driven trend detection: it allows traders to understand whether market trends are backed by actual trading volume, making signals more reliable.
customizable thresholds: users can fine-tune the bullish and bearish levels to suit different trading strategies or timeframes.
effective in volatile markets: by focusing on volume, the oscillator adapts well to volatile markets where price action alone may be misleading.
this indicator is particularly useful for traders who want to incorporate volume dynamics into their analysis to identify potential reversals or trend continuations that might not be apparent with price-focused tools.

Volume TrendThis code defines a custom indicator called "Volume Trend" that aims to identify trends in price action based on volume changes. The indicator calculates a smoothed average of volume data and correlates it with price movements to determine potential support and resistance levels, which are then plotted on the chart. This helps traders make informed decisions about buying and selling based on volume trends.
Key Components and Functionalities:
Inputs:
len (Length): Defines the period for the Exponential Moving Average (EMA) calculation of the volume. This helps to smooth the volume data.
lb (Look Back): Determines how far back the indicator looks to calculate the highest and lowest price points in relation to volume changes.
smt (Smooth): Determines the smoothing level applied to the average of the highest and lowest points to create a smoother trend line.
Volume Analysis:
The script calculates an EMA of the volume using the specified length (len). This smoothed volume data is used to detect volume-based price movements.
Two variables, vl1 and vl2, are used to store the highest and lowest price points based on whether the current volume is higher or lower than the previous volume.
Price-Level Calculation:
The script computes an average of the highest and lowest price levels (vl1 and vl2), and then applies another EMA smoothing to create the final trend line (vl).
Color-Coding of the Trend Line:
Green (lime): When the trend line (vl) is below the current price, indicating a potential uptrend.
Red (red): When the trend line is above the current price, indicating a potential downtrend.
Yellow (yellow): When the trend line is at the same level as the current price, indicating a potential consolidation or neutral trend.
Plotting:
The smoothed trend line (vl) is plotted on the chart with color changes based on its relation to the current price (green for uptrend, red for downtrend, yellow for neutral).
Usage:
The Volume Trend indicator is designed to help traders analyze the relationship between volume and price trends. By plotting dynamic support and resistance levels based on volume changes, it allows traders to:
Identify potential uptrends or downtrends in price based on volume movements.
Spot possible consolidation areas where the price is neutral.
Make better decisions on when to enter or exit trades based on volume-driven price levels.
This indicator can be useful for both short-term and long-term traders who want to incorporate volume analysis into their trading strategies.
Advice:
If you choose the time setting 2 or 3 times higher than the graphics resolution, clearer visuals may appear.
Important Note:
This script is provided for educational purposes and does not constitute financial advice. Traders and investors should conduct their research and analysis before making any trading decisions.
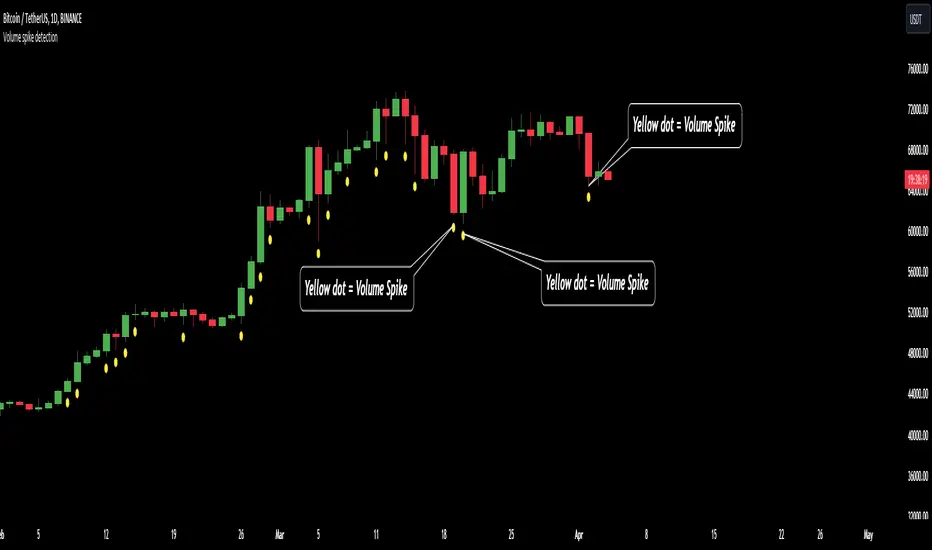
Volume spike detection🔶What it is ?
Volume spike detection that is a tool to help you to define Volume spike better to know whether that is a real signal to focus to trade/invest or you should skip it.
This indicator will measure the current trading volume and then compare with average trading volume to give out volume spike signal. A candle has volume spike that will be marked by a yellow dot below the candle.
Our purpose is, help traders to define Volume spike faster and easier by automation tools and save time during analyzation to give out an exactly investing decision.
What is Volume spike in detail ?
To help you to undertand better about Volume spike, please refer to below picture :
We're having some candles that their trading volume are higher than average volume (blue line on the bottom of chart). They're candles with volume spike and giving us the signal about a huge money flow joined to Bitcoin at that time. You should be careful if you're taking any position that is reversal with these trading volume.
🔶 Who can use it ?
1. All traders who are using NCI, ICT , Smart money concepts, MACD system and other systems...
2. Recommend to use it for H1 timeframe and higher
3. All traders who are trading on Forex, Crypto, Stock, Indicies...
4. All traders who are new or experienced traders
5. Recommend to use for investing or long swing trader
🔶 The purpose of indicator
1. Define big money flow when it joined to market.
2. Helping trader to define MOMENTUM of WAVE
3. Helping trader to define MOMENTUM of candle/price patterns
4. Always "Empty your mind" during Trading because you checked chart less with automation tool.
🔶 How will indicator appear on chart
After you added it on chart, indicator will mearsure and give out the candle having volume spike. Indicator will mark a yellow dot right below the candle for you to recognize the power better.
🔶 INPUT value
There're 2 input value that you can change if you need :
1. Spike ratio % : The value is over from average trading volume
As above picture, you can see we're having 3 volume that is over average trading volume.
The gap is from average value to highest trading volume is spike ratio.
2. Trading period : Here is length of period you want to compare.
For example, you want calculate average volume of 20 periods before as standard to compare and judge a volume spike.
I recommend to set these numbers as default.
🔶 How to use indicator
After setting indicator, indicator will mearsure and run automatically to mark volume spike below the candles on your chart.
You can combine volume spike with your own system to define momentum of wave, price patterns to trade or invest normally.
I hope this indicator help you to trade more effectively.
Volume Footprint Voids [BigBeluga]Volume Footprint Voids is a unique tool that uses lower timeframe calculation to plot different styles of single candle POC.
This indicator is very powerful for scalping and finding very precise entry and exits, spotting potential trapped traders, and more.
Unlike many other volume profiles, this aims to plot single candle profiles as well as their own footprints.
🔶 FEATURES
The script includes the following settings:
Windows: Plotting style and calculations
Coloring modes
Display modes
lower-timeframe calculations
🔶 CALCULATION
In the image above we can see how the script calculates each level position that will serve as a calculation process to see how much volume/closes there are within the levels.
In the image above, we can have a more clear example of how we count each candle close.
We use the prior screenshot as an example, after setting each level we will use the lower-timeframe input to measure the amount of closes within the ranges.
Depending on the lot size, the box will be larger or smaller, usually the POC will always have the highest box size.
NOTE: Size is the starting point, always from the low of the candle.
To find more voids, select a closer LTF to the current one you're using.
To find fewer voids, select a timeframe away from your current one.
Due to Pine Script limitations, we are only able to plot a certain amount of footprints, and we can't plot the whole history chart.
POC will be the largest block displayed, indicating the time point of control
Gray areas are closes above the average
Black are Void or imbalance that price will fill in the future, like FVG
The image above shows an incorrect size input that will lead to bad calculations, while on the other side, a correct size input that will lead to a clear vision and better calculation.
🔶 WINDOWS
The "▲▼" Mode will display delta buyers and delta sellers coloring with voids as black.
It also offers a gradient mode for a beautier visualization
The "Total Volume" mode will display the net volume within the lot size (closes within the levels).
This is useful to spot possible highest net volume within the same highest lot size.
The "POC + Gaps" will show both POC and Gaps as the highest block while all the rest will be considered as the smaller block.
This is useful to see where the highest lot were and if there are higher or lower imbalances within the candle
The last option "Gaps" will simply display the gaps as the highest block, while the POC as the lowest block.
This is useful to have a better view of the gaps areas
🔶 EXAMPLE
This is one of the most basic examples of how this script can be used. POC at the bottom creating a strong support area as price holds and creates higher voids gap that price fills while rising.
🔶 SETTINGS
Users have full control over the script, from colors to choosing the lower-timeframe inputs to disabling the lot size.

Volume Profile [TFO]This indicator generates Volume Profiles from which to display insights about recent Volume Points of Control and High Volume Nodes. Volume Profile is a way to view trading volume by the price where trades have occurred, rather than the time when they occur (as seen by traditional Volume indicators).
By selecting a Resolution Timeframe (1m in this example), we can aggregate the volume at different prices to build a Volume Profile for a specified Profile Timeframe (1D in this example). In this indicator, we make the simple assumption that a given candle's volume is distributed evenly across all points. Realistically, this is seldom the case, but it gives us a starting point to easily estimate the volume at a given price, in turn helping us to build our profiles in a trivial way.
If we do this for all Resolution Timeframe candles within a Profile Timeframe (all 1m candles in a single 1D candle, in this example), then we can successfully aggregate this data and build a full Volume Profile. And thankfully, Pine Script's new polyline feature ultimately allow us to keep more Volume Profiles on our charts. Before polylines, we would have to consider using lines or boxes to represent the individual levels within a given profile, and each script currently has a cap of 500 lines and boxes, respectively. However, one single polyline can be used to draw the complex shape of an entire profile, and we may show up to 100 polylines in a given script. This helps us keep a lot more data on our charts!
Compared to TradingView's Session Volume Profile indicator (blue/yellow), we can see that our indicator (grey) is nearly identical, which verifies that our assumption of a uniform volume distribution is enough to roughly estimate a given Volume Profile. Note in this example the Row Size was set to 200, meaning that 200 levels are used to approximate profiles from each session's high to its low.
Show VPOC will show the volume point of control of each profile, which represents the price level where the largest amount of volume was traded for a given profile. This is shown with the red lines in the following chart.
Extend Last N VPOCs will look for the most recent, user-defined number of VPOCs (not including the current session's VPOC that's still developing) and extend them to the right of the chart as points of reference. The Show Labels Above option will annotate each VPOC with its respective date above a specified timeframe. This way, if one was using Volume Profiles on intraday timeframes, there wouldn't need to be several date strings all showing the same day.
Show Previous HVNs will show high volume nodes from the previous session. The HVN Strength setting is similar to a "pivot strength" that I use in a lot of my scripts - essentially, HVNs are validated by treating them as local highs. With a HVN Strength of 10 for example, if a given level contains more volume than the 10 levels above and below it, then it is validated as a HVN.
For a cleaner look and feel, HVNs can instead be shown as levels (lines) instead of areas (boxes). With levels enabled, solid lines denote the previous session's VPOC, and dotted lines represent all other HVNs. With areas enabled instead, the tops and bottoms will extend above/below the HVN level until a point with greater volume is discovered (marking the "end" of the node).
This indicator can be computationally intensive and may crash from taking too long to execute. In these cases, it's best to disable unused features, decrease the number of Rows, and/or simply reload the chart until it populates.
Volume Profile Segment Difference «NoaTrader»If you use volume profile, then you might have countered wanting to know a segment of the chart's volume profile relative to the whole volume profile. This indicator tries to solve that problem.
When you add it to the chart, first it asks you the start and end point of the segment you want, then it draws the whole chart's volume profile and shows the selected segments relative volume with a different color (blue default).
The default settings are good for a Bitcoin daily chart, so don't forget to change the settings for other symbols and timeframes.

Volume accumulation on past range [TCS] | VTAThe indicator calculates buy and sell volume values for different look-back periods based on the high, low, close, and tick volume data of the chart.
The range can be selected by adding the end date and the look-back period, which starts from the end date. It can calculate a maximum of 100 candlesticks.
The calculated buy and sell volume values are stored in separate variables, representing cumulative volume values over their respective look-back periods. It's important to note that the provided code calculates the buy and sell volume values individually for each look-back period and then sums them.
This information can be useful in understanding who is in control of the market during the selected range. The 'heatmap' is particularly helpful in identifying areas of high or low trading activity, which can help define support and resistance levels.
For example, if there is a greater accumulation of bullish volume than bearish volume and a break occurs in a resistance area, it may present a good entry opportunity.
Please note that this indicator is for educational purposes only and should not be used for trading without further testing and analysis.
Angled Volume Profile [Trendoscope]Volume profile is useful tool to understand the demand and supply zones on horizontal level. But, what if you want to measure the volume levels over trend line? In trending markets, the feature to measure volume over angled levels can be very useful for traders who use these measures. Here is an attempt to provide such tool.
🎲 How to use
🎯 Interactive input for selecting starting point and angle.
Upon loading the script, you will be prompted to select
Start time and price - this is a point which you can select by moving the maroon highlighted label.
End price - though this is shown as maroon bullet, this is price only input. Hence, when you click on the bullet, a horizontal line will appear. Users can move the line to use different End price.
Start and End price are used for identifying the angle at which volume profile need to be calculated. Whereas start time is used as starting time of the volume profile. Last bar of the chart is considered as ending bar.
🎯 Other settings.
From settings, users can select the colour of volume profile and style. Step multiplier defines the distance at which the profile lines needs to be drawn. Higher multiplier leads to less dense profile lines whereas lower multiplier leads to higher density of profile lines.
🎲 Limitations
🎯 Max 500 lines
Pinescript only allows max 500 lines on an indicator. Due to this, if we set very low multiplier - this can lead to more than 500 profile lines. Due to this some lines can get removed.
On the contrary, if multiplier is too high, then you will see very few lines which may not be meaningful.
Hence, it is important to select optimal multiplier based on your timeframe
🎯 No updates on new bar
Since the profile can spawn many bars, it is not possible to recalculate the whole volume profile when price creates new bars. Hence, there will not be visual update when new bars are created. But, to update the chart, users only need to make another movement of Start or ending point on interactive input.

Volume Density w/barcolorOpacity limit set to 70 min & barcolor overlay
The transparency of each candle is based on volume density.
Volume density is calculated as follows.
Volume density = Volume / Price range
Price range uses true range "max(high - low, abs(high - close), abs(low - close))".
Since volume density varies drastically by stock or time, the transparency is calculated based on the deviation rate from the average volume density.
Volume Bull & BearHello Trader,
thanks to the new request.security_lower_tf()-function we are able to calculate intrabar volume. So here is my approach.
Please be aware, that the selected resolution should always be smaller than the selected chart timeframe.
You can find the exact values for bullish and bearish volume in the data window.
Hope it helps some of you :)

Volume Entry CandlesIntroduction
For Wyckoff, three things are important in analyzing the market: price, time, and volume . This indicator provides two types of signals:
- linked to large movements of volumes (red and purple circles on top);
- large price movements concerning volatility (green/red triangle up/down);
In the first case, it highlights the volumes that differ from the most common values, allowing us to trace the levels that the market feels.
Two levels highlight the volume peaks and two calculation methods can be chosen: by exponential moving average or by standard deviation.
In the second case, the signal is based on Volatility and highlights the cases in which the high and low of the last three candles exceed the ATR by a certain number of times. This may indicate situations where the market corrects the price after a fairly large move.
in addition, a table will give us statistical information that tells us:
- from how many candles a condition does not occur
- the average of the candles for which it occurs
- the maximum number of candles for which this condition has not occurred
Obviously, like any statistical tool, it is not intended as absolute certainty
Settings
Analyze all / Minutes: By checking the box, we analyze all the candles in the chart, removing the check will only analyze the period set in minutes.
Type of Level: Select the strategy to calculate the critical levels of the volumes, we can choose Ema or Standard Deviation.
Minimum tail in %: here we can exclude candles where tails aren't enough big, for example if we want to exclude candles without a tail. Use a negative value to ignore this control
We then have three groups:
- the first for the EMA ;
- the second for the Standard Deviation;
- the third for the ATR and its multiplier;
each has configuration parameters such as period and multiplier
Period: length for Ema , or Standard Deviation or ATR function
level1 and level2: they are the multipliers for the two levels
ATR multiplier: multiply the ATR value that must be exceeded by ( high-low ) of the last few candles
n candles: set the number of candles
Help
Show Vol Histogram to fine-tuning: if checked show histogram and lines to tune the indicator
Dimension: to set the histogram dimension
Base: set the price level where we want the histogram, in fact, the histogram is not dynamically displayed, it needs a price to appear
How to use
I follow this step for scalping trading:
- Select time frame 1 minute;
- Personally, I deselect "show the first level", and use only the second level;
- In the candles indicated by the purple circle and I draw a horizontal line on the closing of the candle;
- I can use the levels plotted with time frames at 1min also the time frames at 3min and 5 min
the volatility trigger appears as green/red columns in the histogram.
- green colors indicate a bullish reversal;
- red colors indicate a bearish reversal;
Example Bullish reversal
Moderate risk:
Entry point: above high
Stop loss: below low
High risk:
Entry point: a half body of the trigger candle
Stop loss: 1 ATR below the low of the trigger candle
Tips
Pair this indicator with some Moving Average and/or divergence indicator.
This is the twin of an indicator that I made, called "Volume Analysis". It's better if you prefer to analyze levels by yourself and keep the volume values always visible
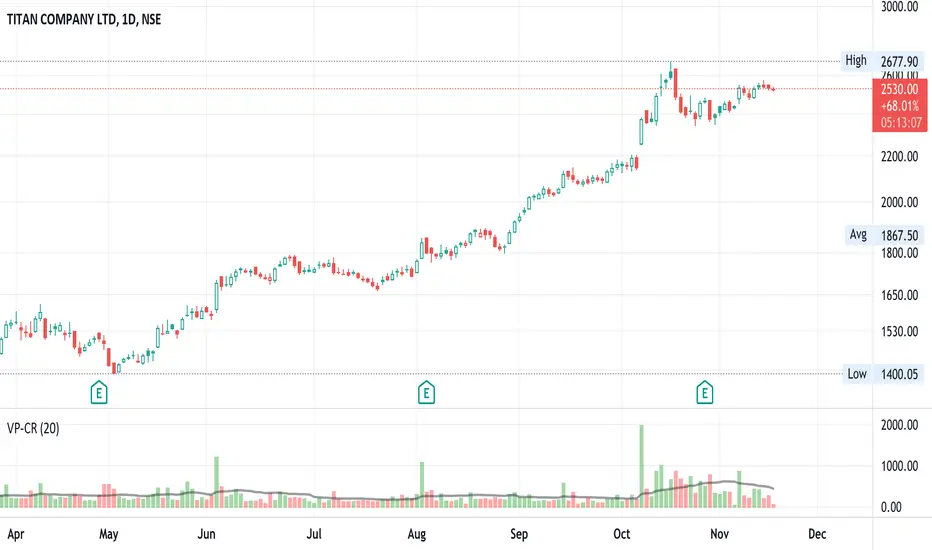
Volume x Price in Crores + RVolScript is designed predominantly for Indian users. Many are used to looking at numbers in lakhs and crores vs millions and billions, this provides a volume figure in rupee crores.
Formula is last close_price x volume / 1 cr or (close_price x volume /10000000). The second figure is the simple moving average (default to 20sma ) again in rupee crores. The third is the relative volume - todays volume / 20 day moving average.
Helpful especially when putting on a trade for a thinly traded stock. It is a quick gauge to how large or small one would want to buy or avoid. Helps manage risk. Also, great to see large volumes in crores to gauge institutional buys or sells.
On 10/NOV/21 - In the chart displayed here, Titan volumes are on average quite substantial as one can see. The 20 day moving average is 550 CR+. 10/NOV volumes are shown as 226 CR and the RVOL is 0.41 (226/550).