TSI HMA CCIHi!
This strategy has TSI and CCI indicators with the CCI being based on a HMA instead of the Price.
There is a number of conditions that must combine to create buy or sell signals, but it is basically a couple of MA crossovers.
The strategy opens new orders on each candle if the conditions are met, Either direction, so it is hedging.
It wont open new orders if there is a floating loss, and so is constantly attempting to hold a floating profit (drawup instead of drawdown)
But It has a StopLoss (set by user) for closing of losing orders, and it closes all orders in basket style when account is in profit to users set amount target profit.
Low commission set to simulate swap but Forex pairs generally dont have commission like the crypto exchanges do. So if you use this on cryptos, remember to increase the commission to your brokers amount.
Crypto users will likely find that because this opens so many orders the commission could erase its profits.
So i recommend this for Forex only, and perhaps, only NZDUSD 4H chart. other pairs, change settings for.
The strategy has settings for testing on target time spans, so you could test it on just Jan-Feb 2020 for example, if you want, or from Jan 2020 to present day.
Have Fun! Open Script for copy/paste/edit/publish your own version :)
True Strength Index (TSI)

SPY Ninja
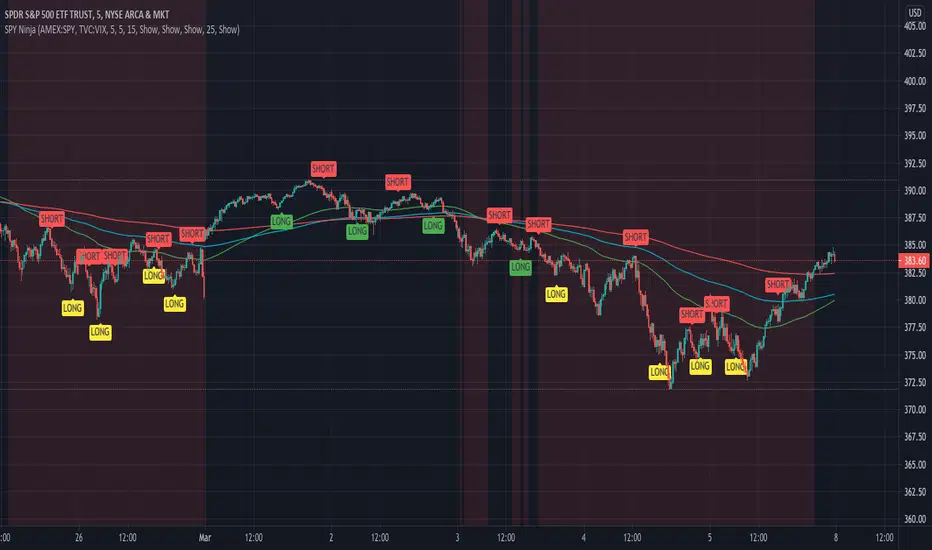
SPY Ninja correlates the true strength index exponential moving averages of SPY and VIX together. In doing so we can determine the start of trend shifts via SPY / VIX convergence in addition to crossover, with potential market entries and exits represented by the LONG and SELL signals.
SMMA 50,100, and 200 have been added to chart due to the historic SPY market reactivity to these moving averages. They often act as natural support and resistance levels with SPY, and when coinciding LONG and SHORT signals appear touching any of these levels, it adds an extra layer of confidence for traders' decisions. Also, by highlighting the areas on our SPY chart (red background areas) that represent a VIX threshold higher than 25, we can bring attention to areas with potentially higher volatility immediately so that traders know to proceed with caution.
SPY Ninja works harmoniously with the SPY Ninja Oscillator; Ninja provides the signals highlighting risky VIX areas of concern, while the Ninja Oscillator adds an additional 3 levels of potential confirmation for your trade decisions.
SPY Ninja Oscillator
SPY Ninja Oscillator correlates the true strength index exponential moving averages of SPY (green) and VIX (red) together. In doing so we can determine the start of trend shifts via SPY / VIX convergence in addition to crossover, with potential market entries and exits represented by the vertical green and red bars.
MACD and RSI have been scaled proportionally to the oscillator range ( for rsi: (rsi-50)*. 01 , and for macd: macd /3) and when overlaid and used in conjunction with the market vertical entry and exit signals, potential trend prediction becomes much more apparent.

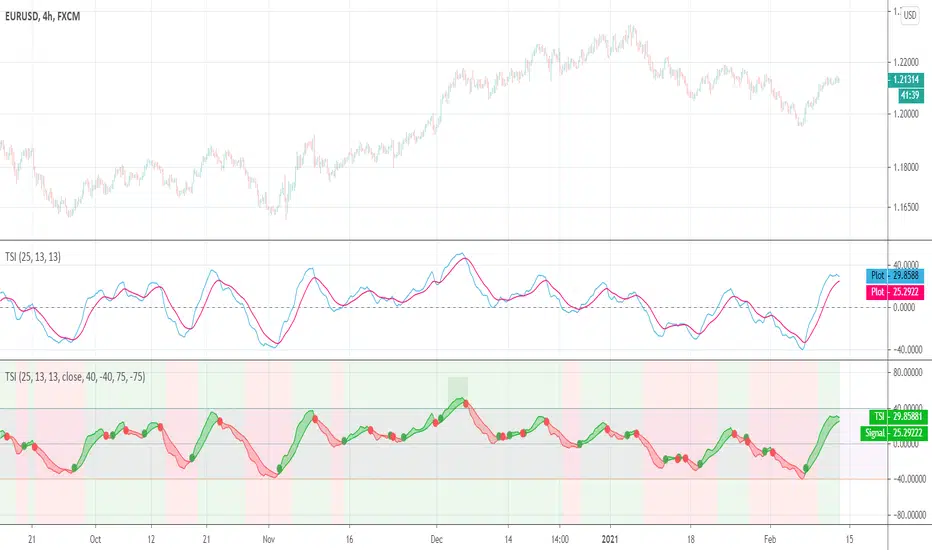
True Strength Index (TSI)User request. A tuned version of the built-in True Strength Index (TSI) indicator with the following options included:
TSI - Signal Histogram
TSI/Signal Crossovers
TSI/Signal Ribbon
Bands breakouts highlighting
Zero line crossovers background
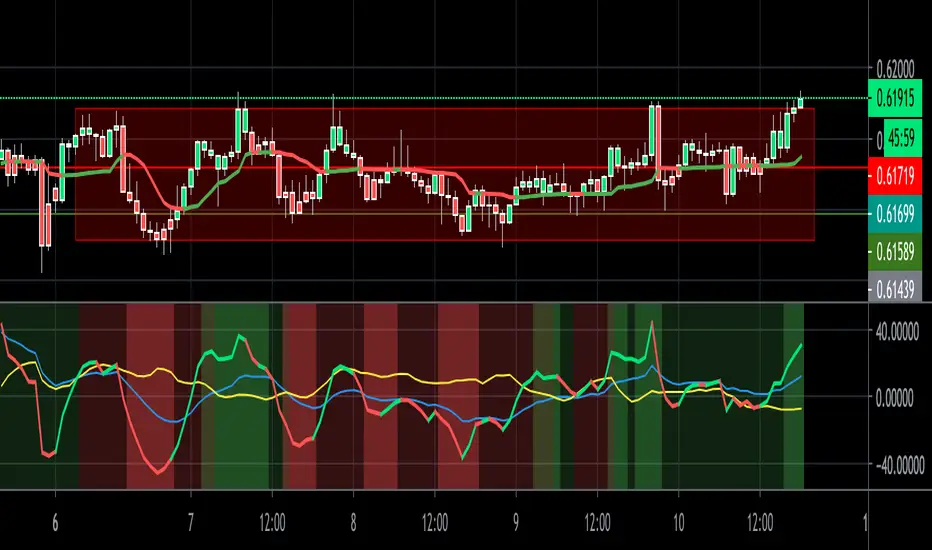
Diego Riobo Cabot's Force Indicator Diego Riobo Cabot
© riobocabotd
Analysing the Market as Physical Forces
Credits First:
Tradingview Pine Comunity, it's just amazing, honestly.
Godmode Indicator's creators. I was inspired by them to create an indicator that takes a lot of variables into account. I also took the idea of the Momentum and LSMA from there
Function te get volume from lower tf was taken from a post in stack overflow. So, credits to you, anonymous hero.
Let's get to it:
so... What is this thing, exactly?
I wanted to measure the market's upward and downard force, in order to calculate the resulting force. Just as a curiosity.
At the end, I got a pretty decent indicator in my hands and I'd like to share it with you guys.
The main goal was to apply basic rules of physics: Velocity, Acceleration, Mass and Force (We could go further if we wanted, such as Impulse, Quantity of Movement, Impact and so on)
Everything appart from mass is a vector, meaning it has a direcction and a magnitude. Each of them were decompossed in upwards and downwards direction
Nevertheless I pictured this Analysis as a "fight" between two teams the Bulls and the Bears (Buyers and Sellers). So I measured two masses: Bulls (+) and Bears(-)
Glossary (internal Clockwork)
° Velocity: Is the ratio between a travelled distance and the time that took to travel it.
+ Upwards Velocity (v_up): Meausures if current source is higher than the previous and stores this value. Has positive values
+ Downwards Velocity (v_dn): Meausures if current source is lower than the previous and stores this value. Has negative values
+ Both vectors are averaged using the rma function (same average type used in the RSI)
+ The length of this average is called length_v: "Lookback - Velocity"
+ Resultant Velocity (v_av): The sum of the averaged v_up and v_dn, since they have equally opposite directions, there's no need for a vectorial sum.
+ Velocity Index (v_in): It's an index between +100% and -100%. Meausures where v_av stands in relation to high (v_up) and low (v_dn). Not used for calculations, but I'll leave it there for further research
° Acceleration: Meausures the rate of change of velocity during time. Since we already have the velocity calculated, it's pretty straight forward
+ Upwards Vel increase (v_up_up): Stores positive variations of upwards' velocity.
+ Upwards Vel decrease (v_up_dn): Stores negative variations of upwards' velocity.
+ Downwards Vel increase (v_dn_up): Stores positive variations of downwards' velocity.
+ Downwards Vel decrease (v_dn_dn): Stores negative variations of downwards' velocity.
+ Upwards Accel. (a_up): v_up_up + v_dn_up
+ Downwards Accel. (a_dn): v_up_dn + v_dn_dn
+ Resultant Accel. (a_av): a_up + a:dn Not used, is there for further research
° Mass: Measures the volume of operations. How much asset is bougth (Bull) or sold (bears).
+ Mass is measured from a lower timeframe. It checks if the candles are Bullish or Bearish (Could be done with closing prices, or typical price)
+ The Lower Timeframe is determined in minutes throught the input variable "Lower Timeframe"
+ Bull mass (vol_up): Total bullish volume in the lower timeframe, for the current candle period
+ Bear mass (vol_dn): Total bearish volume in the lower timeframe, for the current candle period
+ Neutral mass (vol_nt): Total neutral volume in the lower timeframe. (Buy price = Open price) Not used for calculations. Could be used for resistance points?
+ Resultant mass (vol_av): |vol_up - vol_dn|
+ Total mass (vol_tt): Sum of all masses (Just the total volume)
° Force: It's nothing else than mass * acceleration
+ Upwards Force (f_up): vol_up * a_up Bulls mass * Positive Acceleration
+ Downwards Force (f_dn): vol_dn * a_dn Bears mass * Negative Acceleration.
+ Resultant Force (f_av): f_up + f_dn Not used, is there for further research
° Force Index
+ Upwards Channel (fi_up)
+ Downwards Channel (fi_dn)
+ Both vectors are averaged using the rma function (same average type used in the RSI)
+ The length of this average is called length_v: "Lookback - Force"
+ Raw Index (fi_rw): It's an index between +100% and -100%. Meausures where f_av stands in relation to high (f_up) and low (f_dn).
+ Index (fi_in): It's the averaged raw index using the rma function and the "Force Index Smoothing" period
+ Signal (fi_sg): It's the averaged fi_in using the rma function and the "Force Signal Smoothing" period
+ Momentum (fi_mo): fi_in - f_sg. If the momentum is higher than the current force direction, current force should be outwon by previos market trend. It's Smoothed out using the "Force Momentum Lookback"
+ Trend (fi_tr): It's a linear regression of fi_in using a very long period (Force Trend Lookback)
Okay... sure, but how do I use it?
° It is very similar to how the GodMode 3.2 indicator works actually, so if you're familiar with it, you can start trying this indicator out. I've noticed it can provide a bit more timely signals
° It's also similar to Stochastics or RSI indices... but with three lines. an instantaneous one (Force - Blue), an averaged one (Signal - Orange) and a slow one (Trend - Green)
° Bullish/Bearish momentum: Trendline (green) above 0% means Bullish. Above 12% means a trend wants to form and if it reaches 40% means the strend is super strong (Bitcoin like, strong). The opposite goes for bearish trends (values under 0)
° Line crossings: Instant Force Line (Blue) crosses over the Signal Line (Orange), while the orange is going slightly down or flat under the -12%: Means a long signal. The opposite applies for the Short signals
° Line crossings: Same as above, but when the Signal crosses over the Trend Line (Green)
° Reversals: The background columns are supposed to immitate the "Inertia" of movement. If inertia's bars are higher (when positive) or lower (when negative) than the Force Line (Blue), then it means that the current force the market is making, is probably weaker (at that time) than the inertia the market carries with it.
Tips:
° If you wen't long, the orange line is going slightly down, but it's over +12%, it means the bullish trend is still going, although not as strong as before. You could keep your long position. The reverse applies for short.

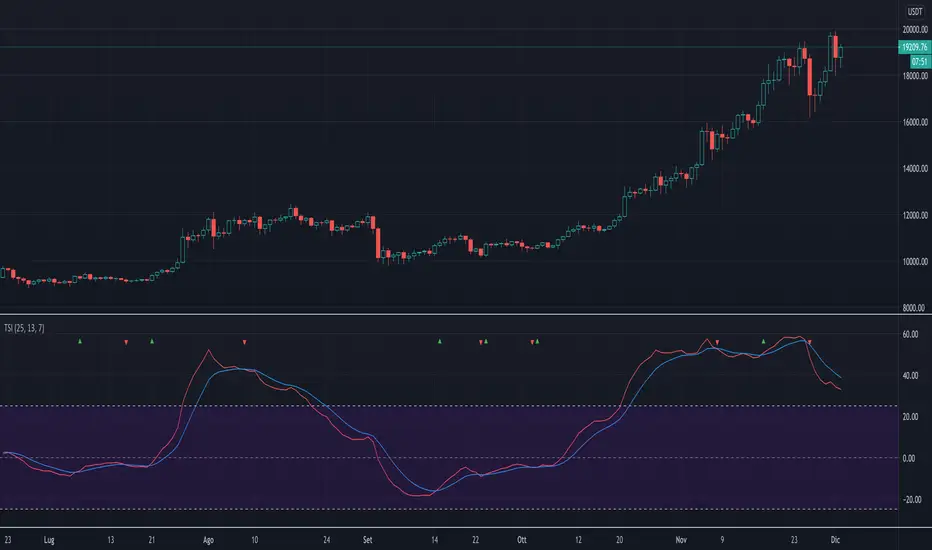
True Strength IndexThe script implements a custom version of TSI (True Strength Index). This index may be useful for determining overbought and oversold conditions, indicating potential trend direction changes via centerline or signal line crossovers, and warning of trend weakness through divergence.
The script highlights when TSI line crosses the signal line with a colored triangle, that is
when the TSI line crosses above the signal line from below, that may warrant buying, a green triangle that's pointing up is drawned;
when the TSI line crosses below the signal line from above, that may warrant selling, a red triangle that's pointing down is drawned.
Note: Signal line crossovers occur frequently, so should be utilized only in conjunction with other signals from the TSI.
The script is very easy to use and it is possible to change the following parameters:
EMA smoothing period for momentum (default value is 25)
EMA smoothing period for smoothed momentum (default value is 13)
Signal line period (default value is 7)
The type of signal line: EMA or SMA (default value is EMA)
Show or not the TSI line
Show or not the signal line
Bjorgum RSIRSI output signals are displayed with color change to reflect the plotted value. This makes evaluating RSI conditions require but a glance.
RSI momentum buy signals are given on the cross of the 50 level, whereas sell signals are given on a fall below.
Default values a 5 period RSI which gives more timely entrances and exits for swing traders. This can be adjusted to the typical 14 period if the viewer desires slower signals.
Bullish and bearish area is shaded to accentuate the signal to the eye.
Excellent results can be found when coupling BJ RSI, with BJ TSI, and the reversal system using all 3 as a complete together simultaneously
Default color changes are plotted as a recorded value falls within the following levels:
RSI < 30 = green
RSI 30-50 = red
RSI 50-70 = blue
RSI 70-80 = yellow
RSI 80-90 = orange
RSI 90-100 = white hot

Bjorgum TSI-This script utilizes simple color changes of the TSI output signals to aid in interpretation of the classic TSI indicator.
-Crosses of the TSI value line and signal line are a bullish or bearish indication. TSI value line is colored green or yellow to help identify that the TSI value line is either dropping or rising, while over or under the signal line.
-This can help anticipate a cross, or significant points in the trend. TSI signal line changes color when rising or falling which can help to identify larger prevailing trends.
-Generally, a rising signal line can be an overall bullish move, while falling more bearish regardless of crosses.
*Resolution function enables multiple overlay for "Multi-timeframe analysis"*
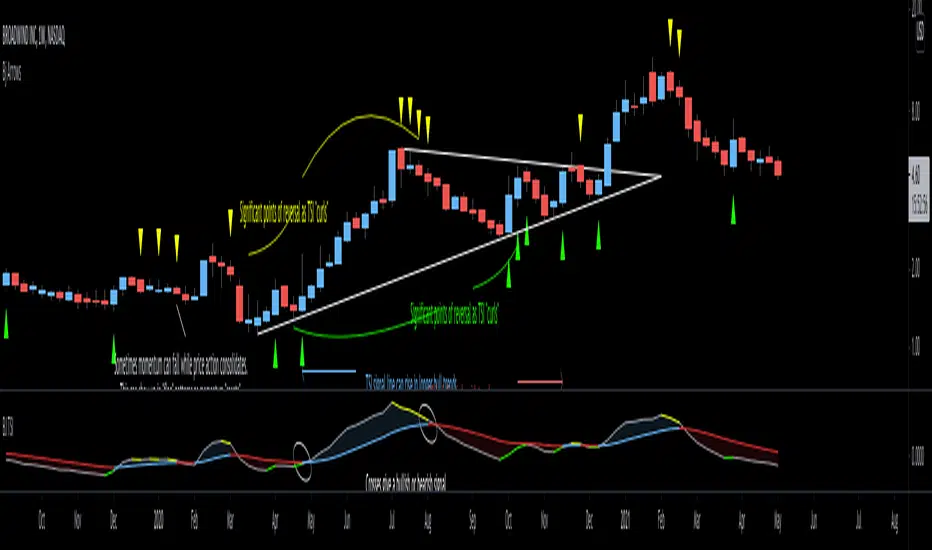
Bjorgum TSI Arrows
This script is intended to help the viewer identify potential turning points with momentum "headwinds" or "tailwinds" with a visual que at the bar level. The presence of arrows indicates that the TSI indicator is either "curling" up under the signal line, or "curling" down over the signal line. This can help to anticipate reversals, or moves in favor of trend direction.
Multiple script overlays can be used for "Multi-timeframe analysis" by altering the "resolution" feature.
eg: Viewer could enable 2 "Arrow" scripts while watching the daily timeframe, and setting one of them to indicate weekly conditions. This can help identify prevailing trend strength when using smaller timeframes.

TKP T3 Trend With Psar BarcolorThis script is adapted from TKP's long/short indicator to initiate buy/sell indications when price crosses the T3 moving averages, and when the T3's themselves cross. Bars change colors based on price over/under T3 and T3 up or down or This allows for simple visual analysis of trend direction along with entries, exits, and stop loss values.

Ichimoku with MACD/ CMF/ TSI This is a strategy made from ichimoku cloud , together with MACD, Chaiking Money FLOW and True Strenght Index.
It can be adapted to any timeframe and any type of financial markets.
The idea behind its very simple,
We combine the long / short strategy from ichimoku, like cross between lines and below/above cloud together with histogram from MACD for positive/negative level. We use the same criteria for TSI and CMF, to check if its above or below 0 level.
Based on that we have a long or a short entry. The exit happens when the next options triggers, like for example we had long signal, we exit when we receive the short signal and viceversa.
It can be adapted with a risk management to apply a tp/sl level.
For any suggestion or details , let me know.

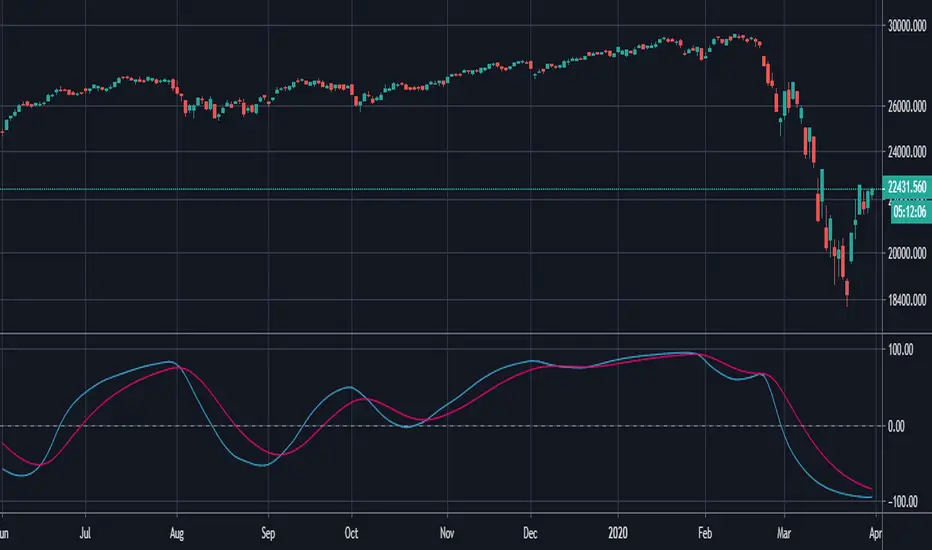
Market Index Strength by Keiron RichieBy combining the true strength of the Nasdaq (NDX) and S&P500 (SPY) we can then compare that against the volatility /fear index (VIX). The true strength of the Volatility Index (VIX) is shown by the red area and the Nasdaq (NDX) and S&P500 (SPY) by the silver/teal areas.
The yellow EMA line shows the average difference between the VIX and the NDX/SPY indexes. When the yellow line crosses above the zero line and is climbing it means that the NDX/SPY are strengthening. When the yellow line is decreasing or crosses under the zero line it means the fear (VIX) is becoming stronger and NDX/SPY are weakening.
When looking at charts of companies/components listed on the Nasdaq and/or S&P 500 you will notice a frequent correlation between the movement of the yellow line depicting index health and the strength of the chart you are viewing. It’s a very quick and effective method of seeing the strength and fear within the market indexes and how they are effecting your chart.
The background color changes based on the market strength combined with the active symbol true strength. Green is a buy zone, Red is a sell zone.
It is tested and works well on all timeframes with Stocks listed on NASDAQ & S&P500. It does not include buy/sell alerts.

TRM StrategyThis is a strategy version of the "True Relative Movement" script:
It is virtually identical to the original script, except now you can back test different conditions and parameters.
TRM has 3 different conditions:Buy (Blue Bars), Hold/Take Profit (Gray Bars), and Sell (Pink Bars).
This script is only coded for Long only condition. It will exit the position when there is a sell signal, no take profit parameters are coded.
The example backtest results shown are on $AAPL with a starting Capital of 10k, with each trade investing 10% of capital. I cannot show results vs buy and hold (meaning re-investing 100% of capital) as this is against house rules. However, I HIGHLY encourage you to experiment with different trade parameters, time frames, symbols and settings for TRM. You will find that certain time frames perform better under different TSI and RSI settings. The "Slower paced trader" can use the "Slow settings" for TRM ( Instructions embedded in the settings window). This will produce less signals ect.... I am personally, constantly finding different settings that work for different ETF's, symbols ect...
As a discretionary trader, it is important to have a system that has an "edge". That is what the script is meant for... finding an edge to help you make sound trading decisions and help you manage risk accordingly.
Enjoy, and please DO NOT hesitate to ask me any questions.

TSI CCI Hull with profit$$$$ , Alert versionThis is a modified version of @SeaSide420 TSI CCI Hull with profits exit on long and short order with alert as well
original script :
the strategy script:
/// feel free to edit/improve and comment

Forex Trend Buy Sell Signal by LukasHello,
This is Forex Buy and Sell indicator, Signal line cross up blue line = Buy, cross down = Sell
Above Yellow line = Uptrend, Looking for Buy only, vice versa.
Only works on Major Pairs.
Calculate price strength and momentum.
Hope you guys like it.
Cheers
Currency Strength Indicator by LukasA better way to trade major pairs.
Similar to RSI CSI, with less noise and real price action movement.
Some explanation. Set thickness of "Color 0" from each currency to know the strength.
Use on 30m timeframe and above to see the power of each currency.
Suggestion : Set timeframe 30m for 1h play (your timeframe : 2), so you can get early signal.
Always looking for upward movement from currency above 20 or 0
Vs. currency bellow 0 or -20.
--
Stay Profit.
Any feedback are welcome.

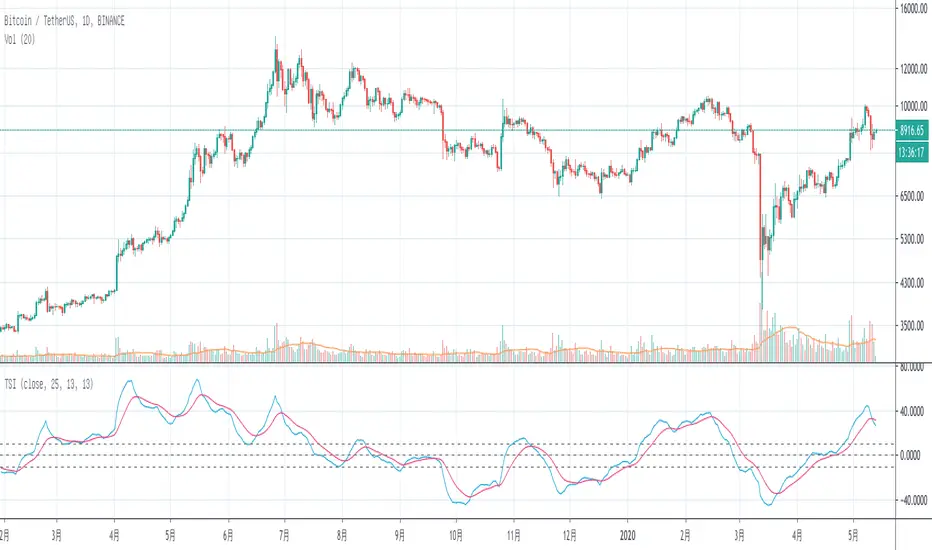
Linear True Strength Index[FinansPi]EN:The True Strength Index, reinforced using Linear Regression Curve. The True Strength Index (TSI) is a momentum oscillator that ranges between limits of -100 and +100 and has a base value of 0. Momentum is positive when the oscillator is positive (pointing to a bullish market bias) and vice versa. It was developed William Blau and consists of 2 lines: the index line and an exponential moving average of the TSI, called the signal line. Traders may look for any of the following 5 types of conditions: overbought, oversold, centerline crossover, divergence and signal line crossover. The indicator is often used in combination with other signals.
TR:Linear Regresyon Eğrisi kullanılarak güçlendirilmiş Gerçek Güç Endeksi. Gerçek Güç Endeksi (TSI), -100 ve +100 sınırları arasında değişen ve 0 taban değerine sahip bir momentum osilatörüdür. Osilatör pozitif olduğunda momentum pozitiftir (ayı piyasası önyargılarına işaret etmektedir) ve tersi. de geçerlidir. William Blau tarafından geliştirilmiştir ve 2 çizgiden oluşur: endeks çizgisi ve sinyal çizgisi olarak anılan TSI'nin üstel hareketli ortalaması. Analistler aşırı alım, aşırı satım, merkez çizgisi kesişmesi, ayrışma ve sinyal çizgisi kesişmesi gibi 5 durumdan birini ararlar. Gösterge genellikle diğer sinyallerle birlikte kullanılır.

TSI CCI Hull with profit$$$This is a modified version of @SeaSide420 TSI CCI Hull with profits exit on long and short order
ORIGINAL SCRIPT:
/// /// feel free to edit/improve and comment

TKP-True Relative MovementThis script uses a combination of modified TSI and RSI conditions produce Buy/Sell/Hold signals. Similar to Elder's Impulse, when a buy signal is met, bars turn blue. When a sell signal is met, bars turn Pink. When signals are mixed, bars turn grey. Depending on direction of trend, gray bars can be considered "Hold" or take profit signals. You can change the parameters of TSI or RSI to preference. Also embedded in the script is the ability to add exponential moving average filter for additional conditions if you have some know how with coding.

GMS: TSI Indicator (ROC)This is based on the original TSI Indicator that's already built in.
The PC is originally taken as the change between the current price - the previous price. I substituted that with Rate of Change. Using a 1 period ROC it's quite similar to the TSI Indicator and increasing the length results in a smoother TSI.
I hope it helps,
Andre
Mirror TSI-MACD by Trader JayI was playing around with the TSI-MACD and surprisingly it works quite well as a mirror.
There are 2 ways this can be used
1. Enter long when Blue line crosses up the Red
2. Exit long when Green line crosses the blue
or
1. Enter long when Blue line crosses up the Red
2. Exit long when Blue line crosses back down below the Red

TSI CCI HullThis is TSI and CCI combined. The CCI is customized and is using HullMA, but the TSI is default TSI
For use with the HMAv420 indicator, to form trading strategy based on the 3 indicators.
Best as all 3 indicators used on 3 timeframes at once, ie 1m 5m 1H
