Coin & market cap tableThis table was built specifically for the Crypto market.
It gives you a quick overview of the markets without having to scroll through numerous charts. The information is the overall markets daily change and the charts coins movement on a daily, weekly and monthly basis.
The weeks start on a Monday morning, the months start on the 1st of the month so this is last weeks data and last calendar months data.
It also gives you Bitcoins dominance. (Total2) you can change it to Bitcoin & Ethereum dominance (Total3)
Bitcoin (Criptovaluta)

Bitcoin Long Time Cycle Detection (RGB Box)Hi!
I tried to analyze bitcoin's cycles since the beggining at INDEX:BTCUSD (on 1D timeframe) using some tools like Moving Averages and Ichimoku Cloud and Fibonacci Levels based on ATH prices of each cyle. Each cycle type is represented by colors:
1- Green is when the price is going to have a new ATH compared to the last ATH
2- Red is when the price is going to move down from the last ATH
3- Blue is when the price seems not going down anymore and moving up go get to the last ATH
The result is very interesting because each cycle has similar behaviours. The Main cycle is when there is a Green, Red and Blue and then there will be a Green again for the new cycle.
Logic of detecting Red part some times makes a Red between two Green s (which is normal but it makes a bit difference in the behaviour of the last part of that shorter Red part) so the valuable part is the Blue !
You can see the interesting noticable similarity of the Blue 's price movement and duration (written in the boxes).
What I understood from this model about each part was:
In the Greens, strongest candles of the whole market appear with higher volumes. which are the shortest parts too.
in the Reds, we see a lot of hammer candles here, price moves down step by step (unless it is going to have a NEW ATH which makes the duration of Red part vert shorter than the main Red parts before the Blue). Temporary resistances make some range channels but finally the price will go down a lot!
in the Blues, the main weak uptrend from the bottom which is finally going to see its last ATH price, but very slowly and weakly compared to the Green part. Some times there will be a lot of temporary downtrends too but in the end, price is going up. this part maybe the best time to buy for long time holding.
What makes this model interesting is that cycles match fundamental events like HALVING and periodic cycle analyses based on that.
In the last cylce we haven't seen the Blue Signal yet! so there should be alot of more patient till we say there will be no more down.
I hope it gives you more insight on the long term trend of crypto. I would be glad to hear your ideas to improve the model.

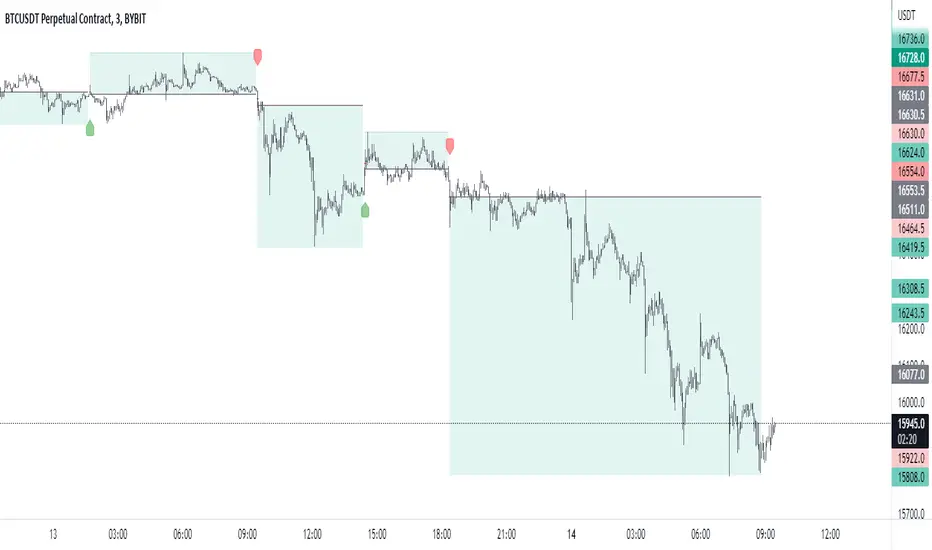
Helicopter!Review
This indicator automatically calculates the best trade entry based on volume and real-time volatility. After the algorithm analyzes the current characteristics of the market, an entry signal is placed on the chart. As a result, the trader can be sure that the signal is based on data analysis. One of the key elements is reverse transactions. A long or short position can be stopped either at a profit or at a small loss without compromising the potential profit.
!Risks
The market is unstable, and it is impossible to know what the future holds for it. The only way to manage risk. You can limit the loss by setting a stop loss of 1% from the entry point. Take profit is recommended to set with a ratio of 1:1, 1:2,1:3, with partial fixation of 40%, 30%, 30%!
!Trading recommendations
Trades are opened when a green arrow appears, selling when a yellow arrow appears. Be sure to wait for the candle to close and the signal to appear (the signal may flash when the candle is formed). Recommended timeframes: 1min, 3min, 15min. The indicator is designed for scalp trades and intradays!
!Technical part
The indicator is based on the EMA 20 and EMA 200 moving averages. It is also based on the open and close of past days, weeks, months.
RSI are used.
RSI is a classic oscillator built on the basis of calculating the relative rate of change in asset prices over a given period.
Additional tools: volume and volatility.
NO REPAINT!
-------------------------------------------------------
Denial of responsibility
The information contained in my Scripts/Indicators/Ideas/Algorithms/Systems does not constitute financial advice or an offer to buy or sell any securities of any kind. I do not accept liability for any loss or damage, including but not limited to any loss of profits that may arise directly or indirectly from the use of or reliance on such information.
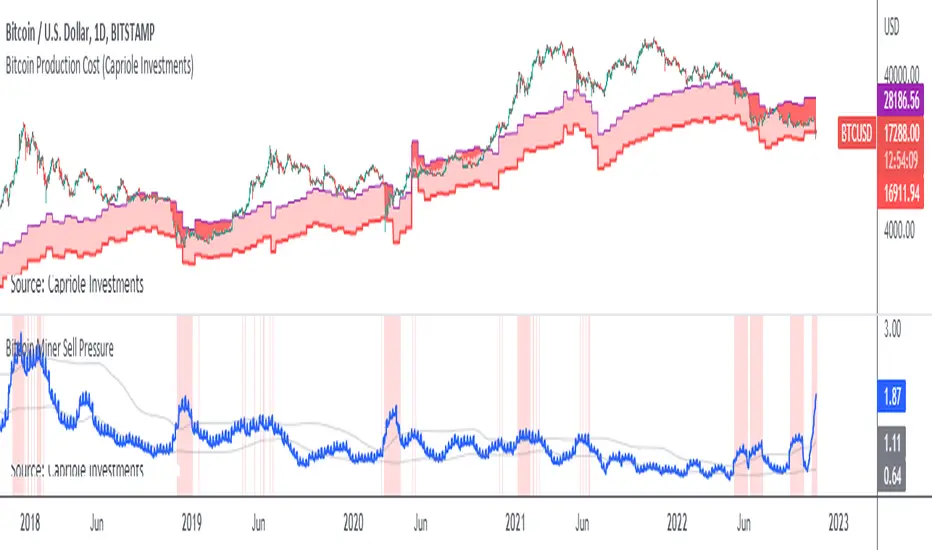
Bitcoin Miner Sell PressureBitcoin miners are in pain and now (November 2022) selling more than they have in almost 5 years!
Introducing: Bitcoin Miner Sell Pressure.
A free, open-source indicator which tracks on-chain data to highlight when Bitcoin miners are selling more of their reserves than usual.
The indicator tracks the ratio of on-chain miner Bitcoin outflows to miner Bitcoin reserves.
- Higher = more selling than usual
- Lower = less selling than usual
- Red = extraordinary sell pressure
Today , it's red.
What can we see now ?
Miners are not great at treasury management. They tend to sell most when they are losing money (like today). But there have been times when they sold well into high profit, such as into the 2017 $20K top and in early 2021 when Bitcoin breached $40K.
Bitcoin Miner Sell Pressure identifies industry stress, excess and miner capitulation.
Unsurprisingly, there is a high correlation with Bitcoin Production Cost; giving strong confluence to both.
In some instances, BMSP spots capitulation before Hash Ribbons. Such as today!
Cheat Code's RedemptionWELCOME TO THE CHEAT CODE REDEMPTION PACK!!!!
I want to take a deep dive into what this indicator consists of and how you can use it to improve your trading strategy.
-What does the CCR consist of?
The Oscillator:
The oscillator is a combination of a true strength index sampled from on-balance volume and a regular RSI at default settings. The reason I added the on-balance volume is that it does not tend to remain at overbought or oversold conditions as traditional momentum oscillators do.
The Histogram:
The histogram is copied to a tee from the MACD histogram, the only difference here is that I extended the moving averages to depict a special pairing; the ema55 slow and ema21 fast. I then converted it into another true strength index, as the calculations fit all time frames.
The Divergences:
The divergences of an indicator can be extremely useful in catching scalp opportunities, a DARK RED/GREEN represents a REGULAR divergence, while a SALMON/LIGHT GREEN color represents a HIDDEN divergence.
The moving average:
The moving average built into this indicator is depicted as an aqua or yellow line, when the oscillator is moving in an uptrend, the moving average will appear aqua, when the oscillator is in a downtrend it will appear yellow. Use this as confirmation bias or as the third derivative of market position.
Oscillator Colors:
The Oscillator color is an important thesis of this indicator. When the line is green, it means the market is effectively in an uptrend, when it is red, it means the market is in a downtrend. Use this to prevent longing in a serious downtrend and vice versa.
If you have any questions regarding the indicator(s), feel free to reach out to me in the comments or through Direct Message!!!
Safe Trading, Don't get Rekt
- CheatCode1 <3

Big Whale Purchases and SalesBig Whale Purchases and Sales - plots big whale transactions on your chart!
People that hold more than 1% of a crypto currencies circulating supply are considered whales and have a huge influence on price, not just because they can move the market with their huge transactions, but also because other traders often track their wallets and follow their example. Taking a look at whale holdings, one can see why whale worship is so common in crypto: While Bitcoin has a relatively low whale concentration, many of the Top 100 Cryptocurrencies have whales control 60% or more of their circulating supply.
Integrating IntoTheBlock data, this script plots the transactions of these whales and, in strategy mode, copy trades them.
Features:
Strategy Mode: Switches the script between an indicator and a strategy.
Standard Deviations: The number of Standard Deviations that a transaction needs to surpass to be considered worth plotting. Setting this to 0 will show all whale transactions, higher settings will only show the biggest transactions.
Blockchain: The Chain on which Whale activity is tracked.

ATR Trend Run - Signals Alerts SL and TP by Tech Store OnThe script uses several ATR formulas for entering/exiting trades, support/resistance lines to take TP1 (take profit 1) and another ATR formula for TP2 (take profit 2). Everything is fully configurable to your preference, and you can back-test it via TradingView. You can also configure the indicator for signals during US trading sessions (with or without power hour), as well as taking profits/stop-loss session time(s), as well as to close a position at the end of the trading session no matter what. Also, you can turn all of that off, so there are no trading session/end of day limits and each trade will run until it either hits SL, TP1, TP1 > back to entry, TP2. Note: indicator is set to skip consecutive/opposite signals, while you currently have a trade open > if you hit a trend – ride it to the end!
For example: If you will be day trading SPY and you wish to close your positions no matter what right before the market closes (3:45PM ET > 15min before closes): Make sure to checkbox “Intraday – Close Position Before Market Closes” in the strategy/indicator Settings, so that you are alerted soon before the market closes, if you wish to continue holding the position – leave this checkbox unchecked.
SL: SL is set to be slightly above/below the signal candle, which is best suited for this strategy.
Strategy Take Profit Approach
While the initial position open and SL hit is always based on a closed candle bar (can’t do otherwise, as otherwise you will have 10s of fake signal alerts), there are 2 ways on trading this strategy in terms of TP1 and TP1 taken > back to Entry, which is based off Alert type.
You can switch this as you like within the indicator settings, “Checked: TP1 taken > back to Entry per Price Touch | Unchecked: per Candle Close”.
Candle Close vs Price Touch: with the Default method - Candle Close for an alert for TP1 or if price comes back to Entry after TP1 is taken will only be triggered once candle bar fully closes crossing the area, while Price Touch will alert when price touches the area before candle bar closes.
For example: your trade is running well, you grab TP1 and the price reverses and hits your trade Entry area. With Price Touch – you are immediately alerted to close your trade with no loss and with TP1 profit. With Candle Close - you will receive an alert only once candle bar fully closes on top of the Entry crossing it backwards, meaning it may lower your TP1 profit or even completely reverse the trade into loss in case it will be a huge candle bar for any reason. However, it may touch the Entry area, looking like the price is reversing, but then continue per initial trade direction, sometimes becoming a trend. So, while Price Touch seem like a more conservative approach, Candle Close can give you much bigger profits if you catch a trend, but you can always change it via the Settings.
Note: TradingView back-testing engine does not have a feature to open/close orders IMMEDIATELY via Price Touch trigger, but only when the candle closes after price touches the scripted area/line/etc., so you for the most accurate results, test your strategy out via Candle Close setting. Otherwise, decide yourself. I personally like more Candle Close since I can test it out via back-testing with the most accurate results.
TP2 is set per Candle Close as often the ATR trailing stop line will be hit and bounced off, so it’s best to wait until candle actually breaks it/closes through it.
Note: If you will be observing the strategy LIVE, during LIVE candle bar movement – it will look weird, like it’s placing an order after order during any trigger – this seem like a TradingView bug, but is only observational, once the candle bar is closed and you refresh TradingView it will all look correct.
Back-Testing
If you wish to do some back-testing, just modify the strategy/indicator Settings:
-----1) STRATEGY: This is for back-testing/experimenting with the script inputs.
----------a. You can setup a start date (date, month, year) from which it will start opening back-test trades, select a position size and select TP1 size, the idea here is to close half (or whatever you choose) portion of the trade once you hit your TP1, then to either close at small profit or to catch a trend and close the second portion of the position long way ahead from Entry, otherwise it will alert you to close the position at TP2, if price comes back to Entry, at reversal signal or at the end of US trading session if the option for it is checked. If you wish to close the whole position at TP1, just enter the same amount for TP1 to match backtest position size. Otherwise you can experiment with TP1 sizing – try it out!
-----2) Feel free to experiment with ATR settings and with S&R Left/Right bars, you may be amazed how results will differ and find some really cool combinations!
-----3) Make sure you select/de-select “Intraday – Close Position Before Market Closes” setting depending on what you are back-testing and on which conditions
-----4) Note: If you wish to do some deep back-testing (1+ years), use the “Deep Backtesting” feature within Strategy Tester on the TradingView as otherwise it may show wrong results or even fail to compute the results
Add the alerts
-----Right-click anywhere on the TradingView chart
-----Click on Add alert
-----Condition: ATR Trend Run - Signals Alerts SL and TP, by Tech Store On
----------o Right underneath the condition click on the drop-down menu and select “alert() function calls only”
-----Expiration time: Whatever you wish
-----Alert actions: Whatever notifications you wish
-----Alert name: DO NOT TOUCH THIS
-----Hit “Create”
-----Note: If you change ANY Settings within the indicator – you must DELETE the current alert and create a new one per steps above, otherwise it will continue triggering alerts per old Settings!
- Note: If you add the alert while the script is currently “In Position” it will not know that. So either wait when there will be no position open at all or close your position partially if the bot opens it twice bigger or so in case per script the bot will think it is already in position.
Note: Because of the slippage and the order processing time between TradingView, AutoView and the Broker (it’s usually about a second or so), it is suggested to not use a timeframe lower than 1min. The script is working really well with 1M/3M/5M/H1/H4 timeframes per my back-testing, but feel free to explore via Strategy Back-testing what’s best for the instrument you wish to trade.
If you wish to try this out for a week or so – please reach out and I will give you access.

FieryTrading: Buy The Dip - Sell The RipDear Tradingview community,
Today I want to share a very powerful, yet easy to use indicator with you. The indicator will find local tops or bottoms and will help you determine when it's a good time to trade a potential reversal.
How does it work?
The indicator makes use of the RSI to detect extremities and waits until the RSI reverses. Furthermore, a long-term moving average is used to determine whether we're in bullish or bearish market conditions. In bullish conditions the indicator will only go long, in bearish conditions the indicator will only go short.
How do I use it?
Favorite the indicator and apply it to your chart! You can add an alert to the indicator to receive a message once it has detected a good point for a reversal trade.
The indicator can be used on all assets and on all timeframes. Personally, I've found the 1 - 4 hourly timeframes to yield the best results.
Good luck!

Ichimoku Cloud and ADX with Trailing Stop Loss (by Coinrule)The Ichimoku Cloud is a collection of technical indicators that show support and resistance levels, as well as momentum and trend direction. It does this by taking multiple averages and plotting them on a chart. It also uses these figures to compute a “cloud” that attempts to forecast where the price may find support or resistance in the future.
The Ichimoku Cloud was developed by Goichi Hosoda, a Japanese journalist, and published in the late 1960s. It provides more data points than the standard candlestick chart. While it seems complicated at first glance, those familiar with how to read the charts often find it easy to understand with well-defined trading signals.
The Ichimoku Cloud is composed of five lines or calculations, two of which comprise a cloud where the difference between the two lines is shaded in.
The lines include a nine-period average, a 26-period average, an average of those two averages, a 52-period average, and a lagging closing price line.
The cloud is a key part of the indicator. When the price is below the cloud, the trend is down. When the price is above the cloud, the trend is up.
The above trend signals are strengthened if the cloud is moving in the same direction as the price. For example, during an uptrend, the top of the cloud is moving up, or during a downtrend, the bottom of the cloud is moving down.
DMI is simple to interpret. When +DI > - DI, it means the price is trending up. On the other hand, when -DI > +DI , the trend is weak or moving on the downside. The ADX does not give an indication about the direction but about the strength of the trend.
Typically values of ADX above 25 mean that the trend is steeply moving up or down, based on the -DI and +D positioning. This script aims to capture swings in the DMI, and thus, in the trend of the asset, using a contrarian approach.
Trading on high values of ADX, the strategy tries to spot extremely oversold and overbought conditions. Values of ADX above 45 may suggest that the trend has overextended and is may be about to reverse.
This strategy combines the Ichimoku Cloud with the ADX indicator to better enter trades.
Long orders are placed when these basic signals are triggered.
Long Position:
Tenkan-Sen is above the Kijun-Sen
Chikou-Span is above the close of 26 bars ago
Close is above the Kumo Cloud
MACD line crosses over the signal line
-DI is greater than +DI
ADX is greater than 45
Close Position:
3% increase trailing
3% decrease trailing
The script is backtested from 1 January 2018 and provides good returns.
The strategy assumes each order is using 30% of the available coins to make the results more realistic and to simulate you only ran this strategy on 30% of your holdings. A trading fee of 0.1% is also taken into account and is aligned to the base fee applied on Binance.
This script also works well on MATIC (1d timeframe), ETH (1d timeframe), and SOL (1d timeframe).

Catching the Bottom (by Coinrule)This script utilises the RSI and EMA indicators to enter and close the trade.
The relative strength index (RSI) is a momentum indicator used in technical analysis. RSI measures the speed and magnitude of a security's recent price changes to evaluate overvalued or undervalued conditions in the price of that security. The RSI is displayed as an oscillator (a line graph) on a scale of zero to 100. The RSI can do more than point to overbought and oversold securities. It can also indicate securities that may be primed for a trend reversal or corrective pullback in price. It can signal when to buy and sell. Traditionally, an RSI reading of 70 or above indicates an overbought situation. A reading of 30 or below indicates an oversold condition.
An exponential moving average (EMA) is a type of moving average (MA) that places a greater weight and significance on the most recent data points. The exponential moving average is also referred to as the exponentially weighted moving average. An exponentially weighted moving average reacts more significantly to recent price changes than a simple moving average simple moving average (SMA), which applies an equal weight to all observations in the period.
The strategy enters and exits the trade based on the following conditions.
ENTRY
RSI has a decrease of 3.
RSI <40.
EMA100 has crossed above the EMA50.
EXIT
RSI is greater than 65.
EMA9 has crossed above EMA50.
This strategy is back tested from 1 April 2022 to simulate how the strategy would work in a bear market and provides good returns.
Pairs that produce very strong results include ETH on the 5m timeframe, BNB on 5m timeframe, XRP on the 45m timeframe, MATIC on the 30m timeframe and MATIC on the 2H timeframe.
The strategy assumes each order is using 30% of the available coins to make the results more realistic and to simulate you only ran this strategy on 30% of your holdings. A trading fee of 0.1% is also taken into account and is aligned to the base fee applied on Binance.

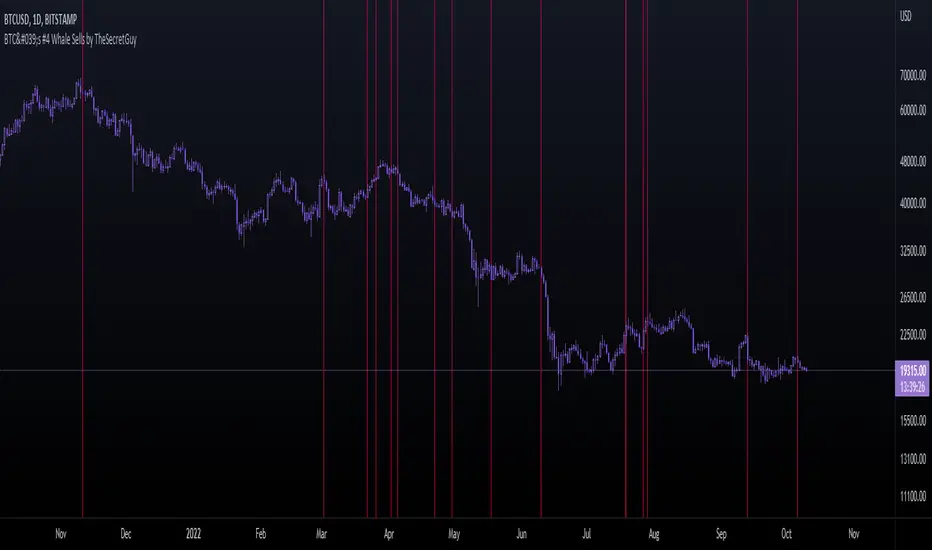
BTC's #4 Whale Sells [TheSecretGuy]Hello there !
I have been tracking BTC richests wallets for some time - and one of them seems to be aligning its sells pretty well with what the market is about to do.
BTC's Whale #3 (now Whale #4) has been selling his BTC in very crutial moments - therefore I felt that converting this into an indicator will give us a pretty visual feedback of what that Whale expects to happen at a given point.
In order to do that, I have listed manually all of his sells (dates) until today and placed a vertical line on the chart on each of these dates.
This sadly can't be automated as Pinescript language doesn't allow to reach outter data - I'd need to update this manually.
Hope this helps you a bit, Cheers!

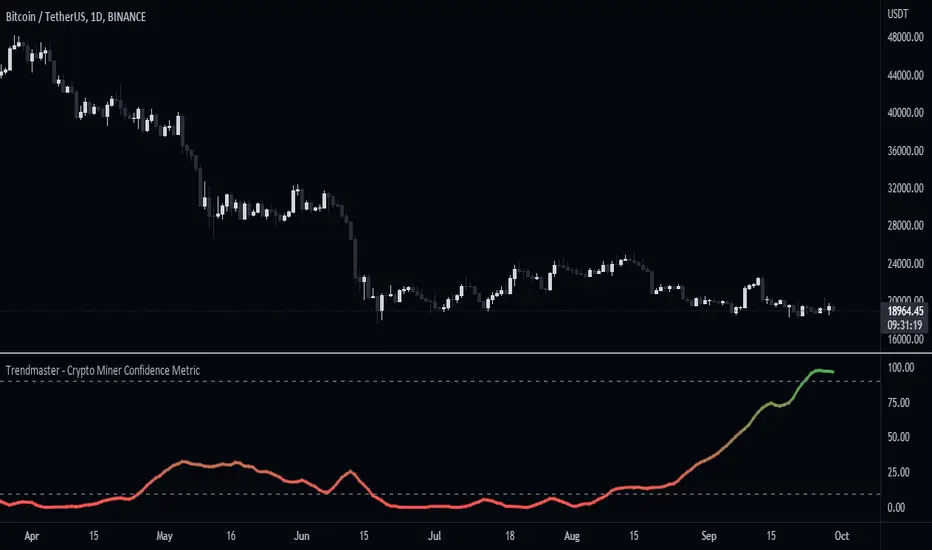
Trendmaster - Crypto Miner Confidence MetricWhat it is:
The Crypto Miner Confidence Metric analyses a handful of highly utilized Crypto networks to gain insight into the potential sentiment amongst those securing them and more specifically Crypto miners.
What it does:
It takes into account the overall trend in the increase or decrease of current computational power securing the networks, otherwise known as the hashrate - as well as the overall network inflows/outflows and holdings of those miners.
How to use it:
Using this data we can conclude whether their stance is currently Bullish or Bearish, with a value of 100 indicating an extremely positive future outlook from miners and a value of 0 representing a severe lack of confidence. Changes or pivots in the direction of miner confidence can indicate a shift in their Bullish or Bearish stance.
Money Supply Index (MSI) by zdmreThe primary objective of the states monetary policy is to maintain price stability with sustainable maximum economic growth. In anticipation of higher inflation , the Central Banks raise short-term interest rate thereby to reduce money supply. Conversely, the Central Banks reduce short-term interest rate to inject additional money into the economy in apprehension of unleashing recessionary forces. The stock markets usually respond negatively to interest rate increases and positively to interest rate decreases. The linkages between money market and stock market a wealth effect due to a change in money supply disturbs the equilibrium in the portfolio of investors.
This index indicates the long-run and short-run dynamic effects of broad money supply (M2) on U.S. stock market (this symbol is optional (Bitcoin, Gold or Oil or other markets etc.)).
#DYOR

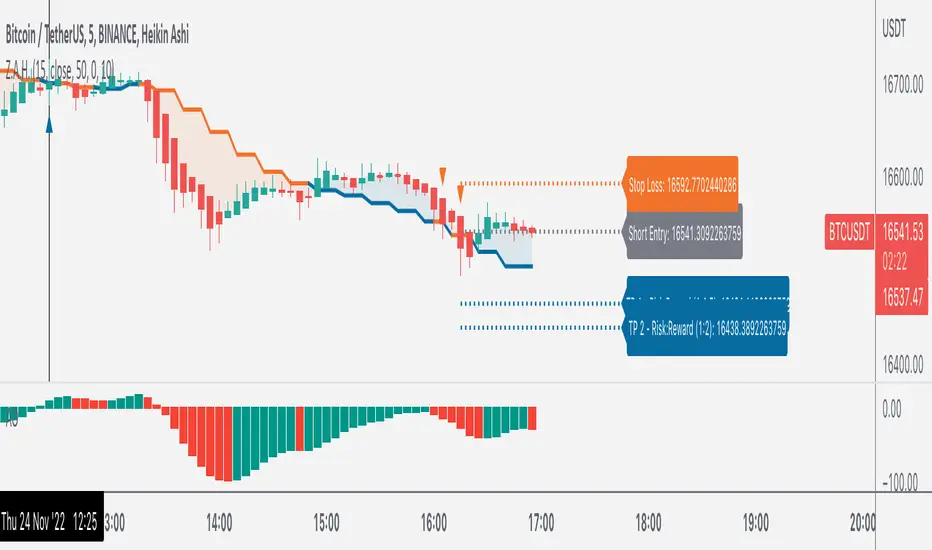
Z.A.H.It's a scalping script, which can be used using Heikin Ashi candle on 5min time frame (I personally use it for BINANCE:BTCUSDT and BINANCE:ETHUSDT scalping).
We've tried to include SL and target (1.5R and 2R) in this as well, and it works well but sometimes (please note SOMETIMES..SOMETIMES, it can be few..few pips here and there)
Idea is simple, you take the trade based on the signal given by the script and place your SL as per the script and then target 1.5R for 80% of your position and 20% for the remaining 20% of your position.
One extra thing which I've found useful is, you can use Awesome Oscillator (default setting) as well for placing SLs. If you use this method for placing SL, then just place your SL at the last green awesome oscillator candle for shorts and at the last red awesome oscillator candle for longs. From there target 1.5R and 2R.
Overall results are same for either, so you can use it as per your convenience. For any query, you can send me a DM on discord or twitter.
BTC Twitter SentimentBTC Twitter Sentiment - shows the total numbers of all negative, neutral and positive Bitcoin related tweets.
On default settings, the tweets are plotted in red (negative) white (neutral) as well as green (positive). The three charts are stacked so the total number of tweets is easily discernible.
Furthermore, there's an optional smoothing setting in the options.
The Twitter Sentiment data is provided daily by IntoTheBlock; Since data is only updated once a day the graph might look chunky on lower timeframes, even with smoothing.

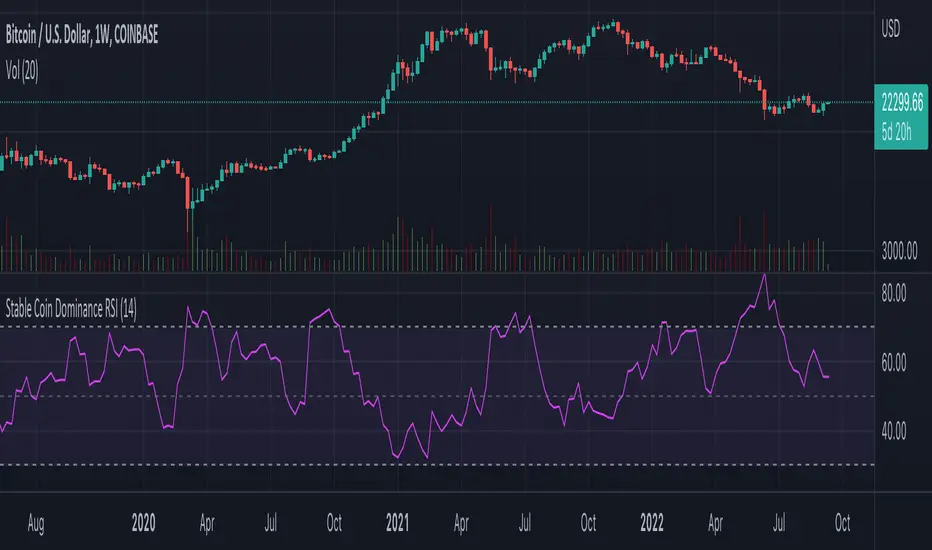
Stable Coin Dominance RSIThe Stable Coin Dominance RSI evaluates the relative dominance of stable coins within the crypto ecosystem as compared to the total market cap. As stable coin dominance rises, it suggests that market participants are exiting out of crypto assets and into dollar pegged stable coins. The opposite is true inversely; as stable coin dominance diminishes, it suggests that market participants are divesting out of stable coins and into crypto assets.
Stable coin dominance can be expressed as a percentage of the total market cap as follows: Stable Coins / Total Crypto. The Stable Coin Dominance RSI indicator uses this percentage and converts it into an oscillator using the formula for the relative strength index.
The calculation for the indicator is: RSI
The users can select from USDT and USDC, two most dominant stable tokens by market cap, and compare their relative dominance against Bitcoin and the alt market.
The Stable Coin Dominance RSI may be useful on larger timeframes when attempting to identify the market’s appetite for risk along with oversold and undersold readings which may indicate pivots or turn arounds along market extremes.
The limitation of the indicator lies in the fact that stable coins continue to make up a growing percentage of the total market cap over time and thus comparisons to earlier cycles will not be a perfect apples-to-apples evaluation. This being said, the smoothing function of the RSI’s look back helps to moderate these comparative differences.
BTC spot volumeIndicator with aggregated volume for all the most actively traded bitcoin spot markets.
Can be denominated in either US dollars or the number of coins traded.
Can be displayed as stacked volume or an index that shows the percentage market share each market has.
In the settings you can exclude any market so that it only shows the individual and total volume of the markets you're interested in.
The currency it's traded against is always specified (e.g. USDT, BUSD, ...).
It's public and free for anyone to use.

BTC perpetual swaps volumeIndicator with aggregated volume for all the most actively traded bitcoin perpetual swaps.
Can be denominated in either US dollars or the number of coins traded.
Can be displayed as stacked volume or an index that shows the percentage market share each contract has.
In the settings you can exclude any contract so that it only shows the individual and total volume of the markets you're interested in.
"Linear" or "inverse" refers to the type of perpetual swap contract it is.
Inverse contracts use coin margin, so in this case BTC.
Linear contracts use some type of dollar equivalent margin like USDT for example.
The margin is always specified for the linear contracts.
It's public and free for anyone to use.

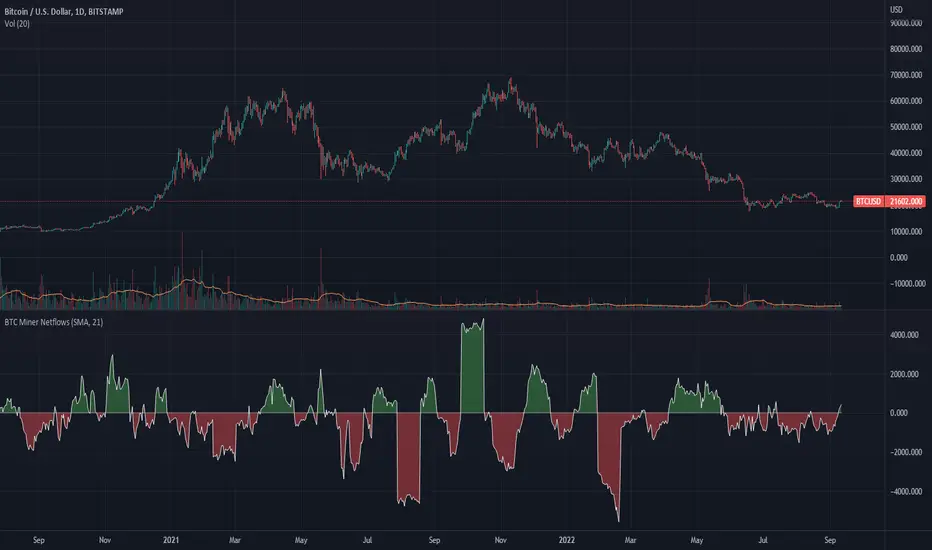
BTC Miner Netflows with smoothingBTC Miner Netflows with smoothing - shows the difference between Miner Inflow and Miner Outflow.
Miner income, sales as well as holdings, are generally considered to have a huge market impact, by analyzing miner Netflows, users can gauge if overall miners are accumulating or selling; high positive values point to accumulation, while negative numbers indicate net selling.
Data queried from IntoTheBlock.
BTC Hashrate ribbonsBTC Hash Rate ribbons / Hash Rate cross
This strategy goes long when BTCs Hash Rate 30 day moving average crosses above the 60 day moving average, signifying that miner capitulation is over and recovery has started.
When the opposite signal is given, which signifies the beginning of miner capitulation, the strategy goes short (or flat, depending on configuration). This is generally considered the most popular Hash Rate related strategy.
The strategy is based on this medium article: medium.com
Thanks to the recent integration of IntoTheBlock data into Tradingview, we can now effortlessly show Hash Rate data on our chart,
keep in mind however, that IntoTheBlock doesn't provide Hash Rate data on timeframes below daily, so this strategy is based used on the daily, weekly or even monthly time frames.
Hash Rate definition:
The Bitcoin hash rate is the number of times per second that computers on the Bitcoin network are hashing data to verify transactions and perform the encryption that secures the network. The hash rate is an indicator of how healthy the Bitcoin network is at any given time, and is driven primarily by difficulty mining and the number of miners. Generally, a high hash rate is considered a good thing.
More precisely, the Bitcoin hash rate is the number of times per second that computers on the Bitcoin network are hashing data to verify transactions and perform the encryption that secures the network.

BTC Hashrate with smoothingBTC Hashrate with smoothing - thanks to the recent integration of IntoTheBlock data into Tradingview, we can now effortlessly show Hashrate data on our chart.
One popular use for Hashrate is to buy when the 30 day moving average crosses above the 60 day moving average, signifying that miner capitulation is over and recovery has started.
Definition
The Bitcoin hash rate is the number of times per second that computers on the Bitcoin network are hashing data to verify transactions and perform the encryption that secures the network. The hash rate is an indicator of how healthy the Bitcoin network is at any given time, and is driven primarily by difficulty mining and the number of miners. Generally, a high hash rate is considered a good thing.
More precisely, the Bitcoin hash rate is the number of times per second that computers on the Bitcoin network are hashing data to verify transactions and perform the encryption that secures the network.

Ichimoku Cloud and Bollinger Bands (by Coinrule)The Ichimoku Cloud is a collection of technical indicators that show support and resistance levels, as well as momentum and trend direction. It does this by taking multiple averages and plotting them on a chart. It also uses these figures to compute a “cloud” that attempts to forecast where the price may find support or resistance in the future.
The Ichimoku Cloud was developed by Goichi Hosoda, a Japanese journalist, and published in the late 1960s. It provides more data points than the standard candlestick chart. While it seems complicated at first glance, those familiar with how to read the charts often find it easy to understand with well-defined trading signals.
The Ichimoku Cloud is composed of five lines or calculations, two of which comprise a cloud where the difference between the two lines is shaded in.
The lines include a nine-period average, a 26-period average, an average of those two averages, a 52-period average, and a lagging closing price line.
The cloud is a key part of the indicator. When the price is below the cloud, the trend is down. When the price is above the cloud, the trend is up.
The above trend signals are strengthened if the cloud is moving in the same direction as the price. For example, during an uptrend, the top of the cloud is moving up, or during a downtrend, the bottom of the cloud is moving down.
The Bollinger Bands are among the most famous and widely used indicators. A Bollinger Band is a technical analysis tool defined by a set of trendlines plotted two standard deviations (positively and negatively) away from a simple moving average ( SMA ) of a security's price, but which can be adjusted to user preferences. They can suggest when an asset is oversold or overbought in the short term, thus providing the best time for buying and selling it.
This strategy combines the Ichimoku Cloud with Bollinger Bands to better enter trades.
Long orders are placed when these basic signals are triggered.
Long Position:
Tenkan-Sen is above the Kijun-Sen
Chikou-Span is above the close of 26 bars ago
Close is above the Kumo Cloud
The closing price is greater than the upper standard deviation of the Bollinger Bands
Short Position:
Tenkan-Sen is below the Kijun-Sen
Chikou-Span is below the close of 26 bars ago
Close is below the Kumo Cloud
The upper standard deviation of the Bollinger Band is greater than the closing price
The script is backtested from 1 January 2022 and provides good returns.
The strategy assumes each order is using 30% of the available coins to make the results more realistic and to simulate you only ran this strategy on 30% of your holdings. A trading fee of 0.1% is also taken into account and is aligned to the base fee applied on Binance.
This script also works well on BTC 30m/1h, ETH 2h, MATIC 2h/30m, AVAX 1h/2h, SOL 45m timeframes
