Bitcoin Price Bottom IndicatorThis Indicator flashes up on bottoms of each Bitcoin market cycle. It’s suggesting, that the price of BTC finds strong support at the 200W SMA . Thats why it’s not flashing up in the first cycle, because there was not enough price data at that moment.
This Indicator uses price data from the weekly timeframe so for the best experience USE WEEKLY TIMEFRAME .
Bitcoin (Criptovaluta)

EMA+RSI Pump & Drop Swing Sniper (With Alerts)This is using an EMA and RSI with slightly modified settings to give good entry and exit points while looking at Bitcoin. I use this on a 4-hour chart and with other indicators to find good positions to enter a trade or exit if things are turning red.
If you click on the EMA line it will color the bars of the chart based on if they are above or below the EMA - This is just visually helpful for me to see the active trend.
Make sure you hover over or click on the EMA line to see the colors of the candles change - it's not visible by default or without doing this.


High Low Reversal This bot makes use of an algorithm which detects new highs and lows. When doing long trades, the bot will trigger a buy order on a newly made low. When making shorts, the bot will trigger a short trade on new highs.
Currently, the bot is optimized for cryptocurrencies on the M15 time frame. With the right amount of leverage and portfolio optimization this bot can obtain very strong results.
Feel free to optimize it to your own liking on different assets and/or time frames.
This bot performs exceptionally well in trending markets. Currently, it's only making long trades, but you can make it do short trades in the control panel.
The settings of the back test as follows:
starting capital = 100k
leverage = 1
commission = 0.2%
Equity per trade = 50%. Since the bot only makes one trade at a time you can allow it to use a bigger portion of your balance per trade.
I've also made a study-script for easy implementation on the exchange. You get that script once you get access to this bot.

Price DEFI Categories against BTC & ETH/* Work in progress. The indicator is not finished. *\
The indicator shows the pricing of 3 DEFI categories against 2 possible baselines, BTC and ETH.
To do:
* Make a simple array in the source code to enter and remove new projects to the category. -> Maybe can also make it so that the source code does not have to be altered (projects can be added through input etc.)
* Adjust weightings depending on project data but this is not as important since weightings are being priced in by the market.
* Try to find a way to update input to string instead of booleans. As of currently, I could not seem to use input strings into plot functions because of an error.
* and more. Leave some feedback, that would be highly appreciated!

Moving Average BandsUse this script to find buy and sell zones for BTC based on momentum of the move relative to the average asset price over a given period. The script plots a series of offset bands above and below the Simple Moving Average. When price crosses another band further from the SMA, the background is rendered brighter. The brighter the background, the stronger the buy and sell signal is, as the expectation is that price wants to return to the SMA. Settings are adjustable to fine tune to various time frames and assets. Good settings for BTC Daily are length 30, layers at 10, 20, 30, and 40.
On 1H BTC/USD I use length 200, layers at 5, 10, 15, 20 to find decent swing trading opportunities.
On BTC/USD 1D chart, combine with Bitcoin Logarithmic Growth Curve from @mabonyi (original by @quantadelic )for confluence of very reliable signals.

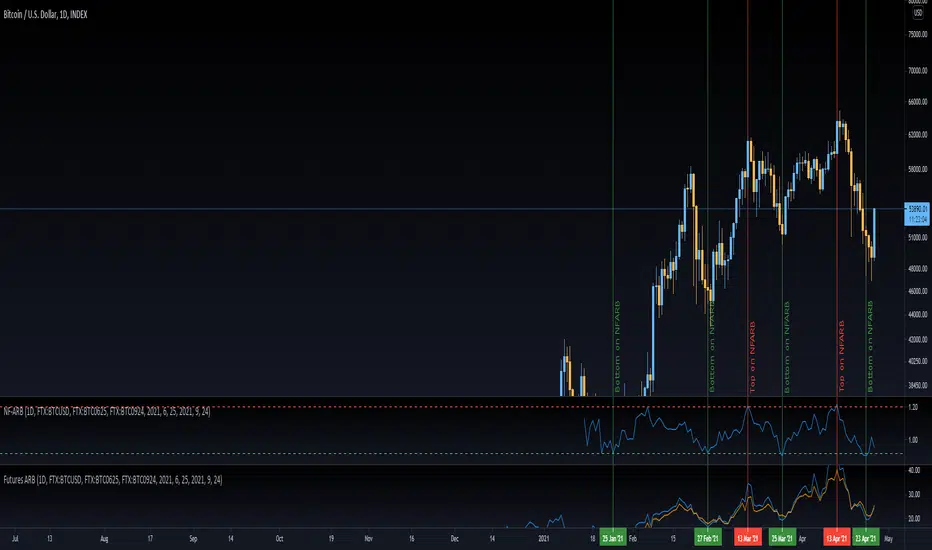
NF-ARBThe NF-ARB stands for Near/Far Ratio of Annualized Rolling Basis. It takes premium or discount of the 3 month and 6 month futures against spot price and calculates the annualized value for the same. Then the ratio between the near and far ARB is obtained. This ratio is helpful in finding swing tops and bottoms.
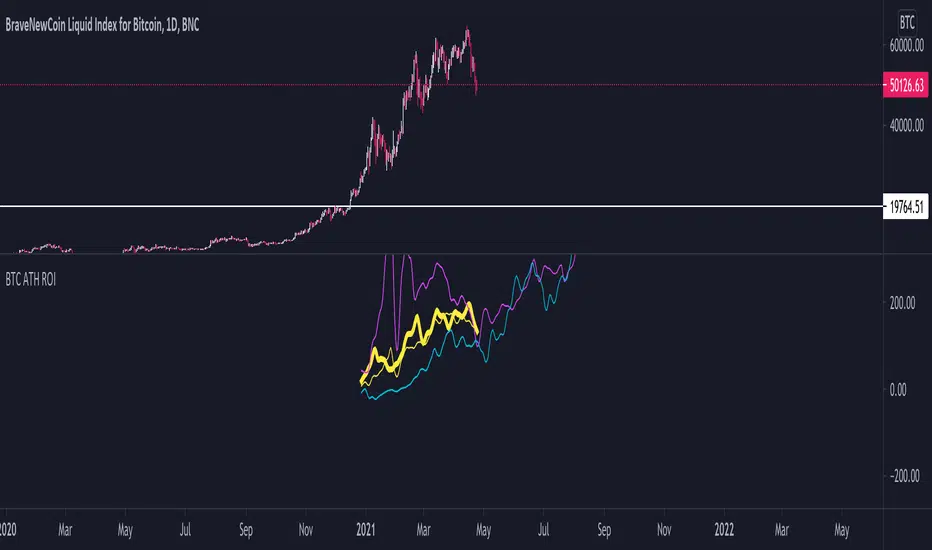
BTC ATH ROIThis indicator shows the ROI % of Bitcoin from when it passed its ATH of the previous bull cycle. I found it interesting that each time it crossed its ATH it took around 260-280 days to peak for each one. This bull run seems to follow between both of the previous bull runs including this recent dip.
There are a couple issues I want to fix but can't figure out:
1. You need to completely scroll out and move towards 2013 on the Daily chart for all 3 lines to show up. Would be nice to load all of that data at the start.
2. I can't query the value of the plots after they have been offset. This would be useful to create a prediction bias for the current plot so would could see where btc might go.
If you peeps know of a way to load all data or query plot values after offsets, please share. That would be awesome.
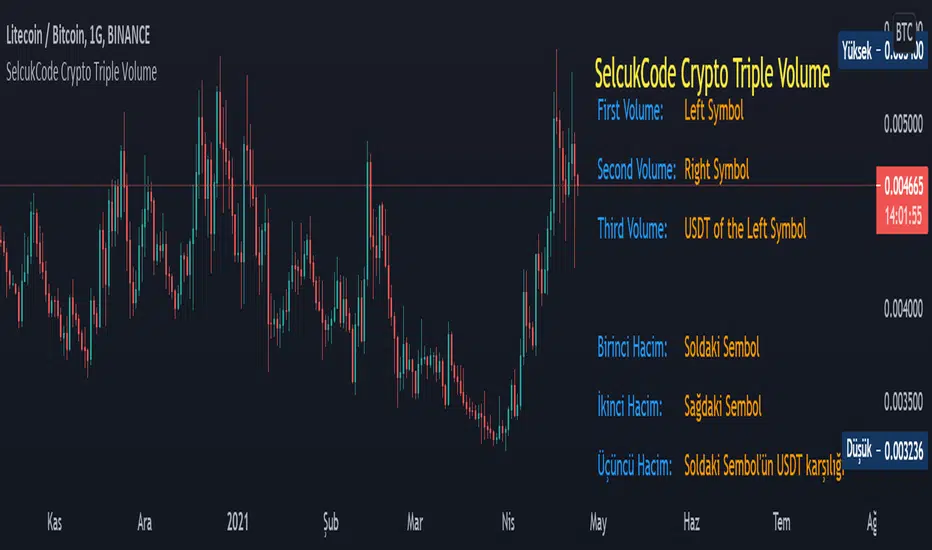
SelcukCode Crypto Triple VolumeThis is a volume indicator written for cryptocurrencies. The difference from the integrated indicator is that the left symbol of the cryptocurrency shows the volume as well as the right symbol. It also shows the volume of the pair in USDT. Thus, we see the USDT volume of each cryptocurrency pair. This standardizes our view of volume.
Bu, kripto paralar için yazılmış bir hacim indikatörüdür. Entegre indikatörden farkı, kripto paranın sol sembolünün hacmini göstermesinin yanı sıra sağ sembolün hacmini de gösterir. Ayrıca paritenin USDT olarak da hacmini gösterir. Böylelikle her kripto para çiftinin USDT hacmini görmüş oluruz. Bu bizim hacime bakış açımızı standartlaştırır.
Optimized Keltner Channels Strategy for BTCThis strategy is optimized for Bitcoin with the Keltner Channel Strategy, which is TradingView's built-in strategy. In the original Keltner Channel Strategy, it was difficult to predict the timing of entry because the Buy and Sell signals floated in the middle of the candle in real time. This strategy is convenient because if the bitcoin price hits the top or bottom of the Keltner Channel and closes the closing price, you can enter Buy or Sell at the next candle start price. In addition, this strategy provides a visual plot of the price (bprice, sprice) at which the candle is closed by hitting Keltner Channel.
▶ Usefulness and Originality
- Convenient Buy and Sell entry compared to the original Keltner Channel Strategy
- Optimized for BTCUSD market (maximizing profits)
___________________________________________
이 전략은 TradingView의 Built-in 전략인 Keltner Channel Strategy를 비트코인에 맞게 최적화되었습니다. 기존의 Keltner Channel Strategy는 Buy, Sell 신호가 캔들 중간에 실시간으로 떠서 진입 시점을 예측하기 어려운 불편함이 있었지만 이 전략은 비트코인 가격이 Keltner Channel 상단 혹은 하단을 찍고 종가를 마감하면 그 다음 캔들 시작가에서 Buy 혹은 Sell 진입이 가능하여 편리합니다. 또한, 이 전략은 Keltner Channel을 만나서 캔들을 마감한 가격 (bprice, sprice)을 시각적으로 plot을 제공하여 타점 및 차트를 보기에 편리합니다.

QMWD RangerThis script will display the previouse Highs, Lows and Mid of the last:
- Quarter
- Month
- Week
- Day
Ranges
Its pretty good in finding potential pivot areas.

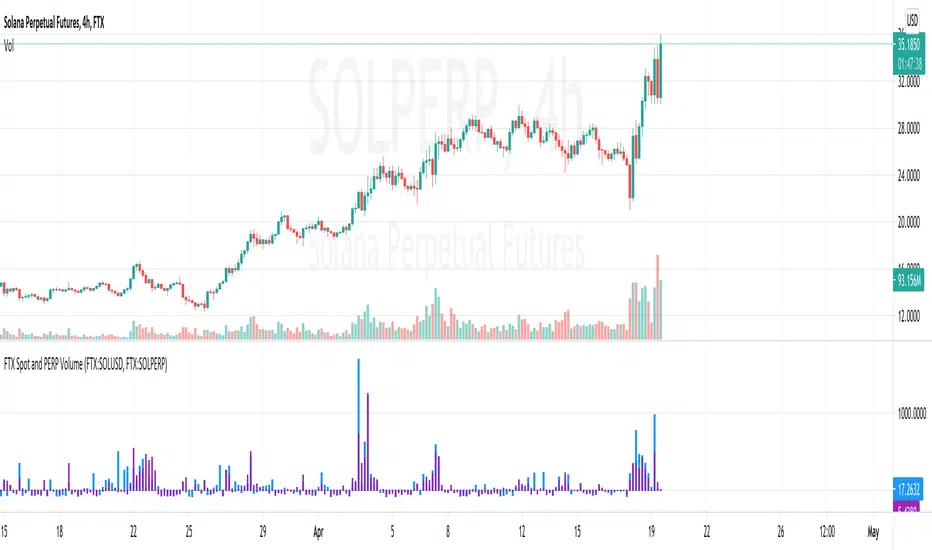
FTX Spot and PERP VolumeYou can use this indicator to show the volume of SPOT and PERPS for an asset. It is setup for FTX and SOL in this example but you can change this with the inputs. You can use two different exchanges such as using FTX:BTCUSD and BINANCE:BTCUSD.
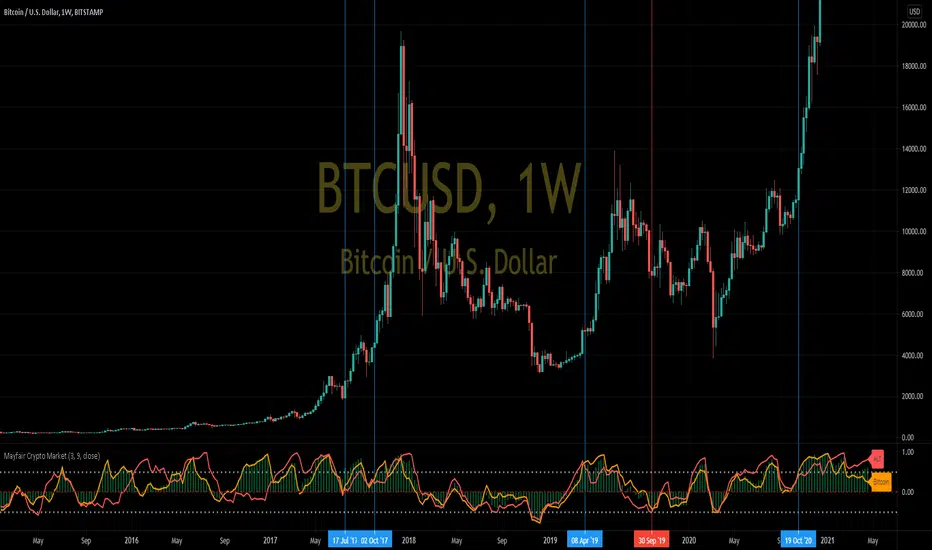
Mayfair Crypto Market 1.0In this indicator, we compare the market capitalisation of Bitcoin(in gold colour) with the market cap of all the other cryptocurrencies (in red), and the market cap of the whole cryptocoin market (the green histogram).
As you may be able to see, when Bitcoin (gold colour) crosses over the Others (red colour) in the indicator, it signifies a swing in popularity towards Bitcoin, and it appears to have predicted some of the recent large rallies (blue Vertical lines) and pull-backs (red vertical lines)
Like all indicators, it is not perfect, and you should never rely on one indicator in any situation.
Stochastic TrendDear community,
I've made another simple trading bot for you to use. This bot is based on the Stochastic Oscillator. It only produces long trades currently.
I changed the oscillation period to a much longer one, which in turn creates opportunities to trade long term trends.
The bot goes long when the Entry lines is crossed from below and it will close its long position once the Exit line has been crossed from above.

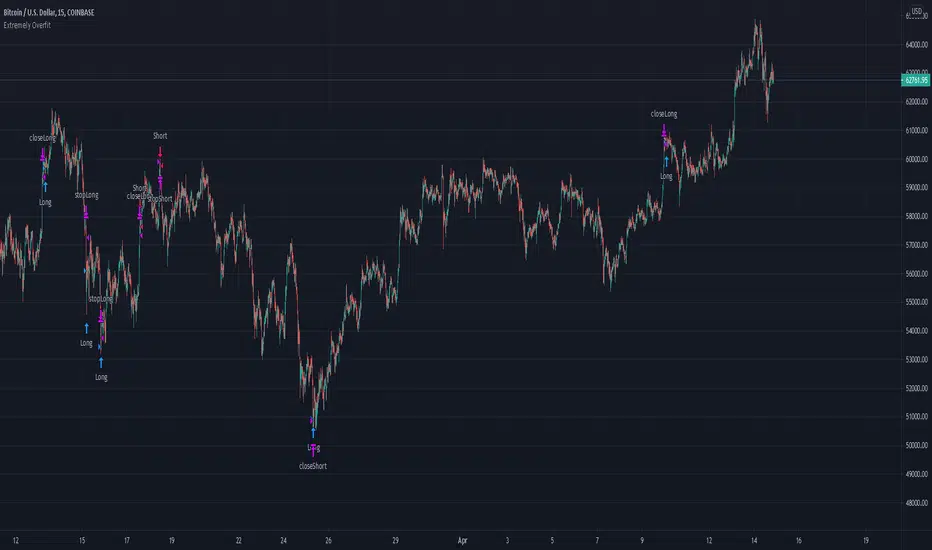
Extremely Overfit Bitcoin Long/ShortThis is a highly overfit (in my opinion) script to long/short BTC on the 15m time frame. May be usable for other cryptocurrencies or timeframes with some parameter adjustments. I backtested it on a few exchanges with ETH.
The simplest way to increase the number of trades is to decrease the "FastChannelLength" parameter or increase the "SlowChannelLength" parameter, or both. Decreasing the margins of the channels also increases the number of trades. In GENERAL, you should expect that adding more trades will hurt profitability, because, as the title says, this script is extraordinarily overfit.
It does include a commission fee from the start, which I find is essential to not providing an overly rosy view of how a strategy would work.
Bitcoin Premium for Bitfinex and Coinbase By CompoundWater
Bitcoin Premium for Bitfinex and Coinbase By CompoundWater
Timing and Application:
When the crypto trend is obviously positive for a long time frame, give short-term investors a reference.
Purpose:
This is for Bitcoin Price between Bitfinex(BFX) and Coinbase(CB)
and give you some hint when to be careful and when to find chance to buy/long BTC.
if
(BFX – CB ) Bitcoin Price:
< 0 will show red line below
> 0 will show green line below
Action:
💀 show (BFX – CB <0 too much): Be care market may be too greed!
💗 show (BFX – CB >0 too much ): Try to find some chance to long BTC!
Why?
There are many big and old players in Bitfinex.
Coinbase may has more small investors and new user.
Data source: Coinbase/Bitfinex BTCUSD
The indicator is recommended to be applied in 4hr timeframes.
Disclaimer: only for learning reference, please consider by yourselves

Hourly Scalp Engine◆ Purpose of this Script
The Hourly Scalp Engine (HSE) is designed to show scalp long opportunities on lower timeframes (H, 2H or 4H) based on a Fibonacci-valued MA-like structure. It was tested for Bitcoin and Ethereum, with the 2H timeframe seemingly giving the best test results. The chart shows a few instances where the price crossed below the HSE to trigger an entry (marked manually with arrows).
◆ Settings
Default scaling input (10.6) is tuned for Ethereum (ETH/USD) on Kraken.
Scaling input for Bitcoin (XBT/USD) on Kraken: 10.4.
Reasonable timeframes: H, 2H, 4H. Recommended timeframe: 2H.
You should probably set an alert for when Price crosses under the HSE.
◆ Instructions
As this is purely a scalp engine (and not feasible for long-term trades), the instructions have to be followed precisely for intended functionality:
As soon as Price crosses below the HSE, contemplate if you want to scalp, i.e. check current price, other indicators and market conditions. If yes, enter a scalp long. Do not enter the trade if : price has crossed above the HSE already and sits more than 1 % above it, or the down-wick was so deep and quick that it already retraced 10 % to the upside from the wick low (even if price is still below the HSE). In both cases it might be too late to enter.
Watch the 2H candle, at which you entered the trade, closing. Draw a 10 % price range from the wick low to the upside. The range high is your exit point. Set a take profit trigger there. Set a stop loss slightly below the wick low.
Observe the price action for the next 6 hours (i.e. the next three 2H candle closes). If price bounces up and hits the target, you exit with 10 % gains. If price hasn't moved to the target after 6 hours, close the trade at current price. If the stop loss should be hit in the meantime, you will have closed the trade automatically. The 10 % gain as a target was chosen because it seems to be hit very often, while higher targets are not reliably hit.
◆ Example Trade
Shown below is an example trade with correct drawing of the 10 % price range.
◆ Viability
From backtesting this should be a viable strategy for most instances where the HSE is crossed. However the HSE is not as hard as a boundary as e.g. the Confidence Bands (also published by DeanTrader), so that price can and will sometimes breach through (= close below) the HSE (as e.g. in the case of the March 2020 black swan event). Still even there a profitable trade could have been performed on the first bounce dependent on actual entry, although more risky due to very high volatility. Before using the HSE please make yourself familiar with the price action history of the considered asset and review the instances where the price crossed below the HSE in connection with the rules laid out in "Instructions" to understand the system and how to execute the trades. Also note that scalp trades are generally harder to perform than slower-paced swing trades, as timing becomes much more important and noise becomes relevant.
◆ Access
For access to this indicator please contact me via DM on TradingView or on Twitter (linked on my TradingView profile and in my signature).

Moritsz's Customized RSIBasically just your standard RSI with a twist. Key differences:
1. Overbought and Oversold levels are moved to a higher and lower level following the nature of cryptocurrency.
2. Added a middle trendline at 50. Above is usually an uptrend, below is a downtrend.
3. Better looking than your typical RSI.
4. Nice pretty colors to please your eyes :)
Enjoy.

FieryTrend IndicatorI created this indicator because it can be quite difficult sometimes to find the direction of the market, which supports and resistances are important, where to place targets, etc. This indicator is excellent for traders which trade on reversals and breakouts from resistances and supports.
The indicator tries to make it clear which areas are of importance and which are not. To find the market structure, all you have to do is to connect the dots by drawing a line between them.
By connecting the dots, it becomes clearer where important resistances and support areas are located. By making this information easier to digest you can place your entries, targets and stops easier and faster, becoming a better trader in the process. With connecting the dots, it might be the case that they won’t line up perfectly, which is fine. It’s all about the bigger picture.
The best time frames for this indicator are M15, H1 and H4. You can fiddle around with the Length input to get different results; I’ve found that the base input works the best for the aforementioned time frames.
For more examples, see below:

Fibonacci DCA TrendThis bot makes use of an algorithm which detects new heights and places limit orders according to the Fibonacci retracement theory. By placing limit orders under the current price, the bot allows itself to catch smaller and larger dips. This is also known as “Dollar-Cost-Averaging”, DCA in short. This bot is ideal for bull markets, both on crypto and stock indices.
The green lines are the limit orders. As soon as the price touches the limit order, a position is entered.
The settings of the back test as follows:
starting capital = 100k
leverage = 1
commission = 0.2%
Equity per trade = 5%, a realistic investment strategy when trading 2-3 assets with this bot.
It’s advised to trade this bot with futures for potential leverage. On time frames lower than H1 I’d use 2x-3x leverage for better results, especially in trending markets. On larger time frames I wouldn’t use any leverage.
This bot has very strong results on a multitude of assets. The best results are on the M15 time frame.
To give you a few ideas, this bot is tested on the assets below. All the results are very similar. You can contact me for a back-test on a specific asset. You can find the back-test results on my website.
BTC
ETH
SPX500
NAS100
The standard inputs are generally the best all-round inputs. Feel free to change the inputs to your liking.
I've also made a study-script for easy implementation on the exchange. You get that script once you get access to this bot.

RSI Trend CryptoDear community,
Today I want to present you one of my favorite and simple trading bots: The RSI Trend.
This bot is based on the RSI, which normally is used as a trend reversal indicator. However, here it’s used as a trend finding indicator, often with great success. This bot making long-only trades, which is quite successful in bull-markets like the one we’re currently in.
In case you want to use an emergency exit for your trade, toggle the Emergency Exit parameter. During bull-markets it’s better in the long term to keep this option off.
Currently the bot only makes one trade at a time (pyramiding = 1), for higher risk and higher rewards you can increase this parameter. More than 5 is not advised.
I’ve optimized this bot on 15min time frame. It has some decent results for most cryptos on this TF, feel free to test this out.
In case you want to hook this bot up to your exchange, feel free to edit the ALERT messages in the code.
Default Trading Rules:
Long: RSI crosses over 35
Close Long: RSI crosses under 75
Emergency Exit: RSI crosses under 10

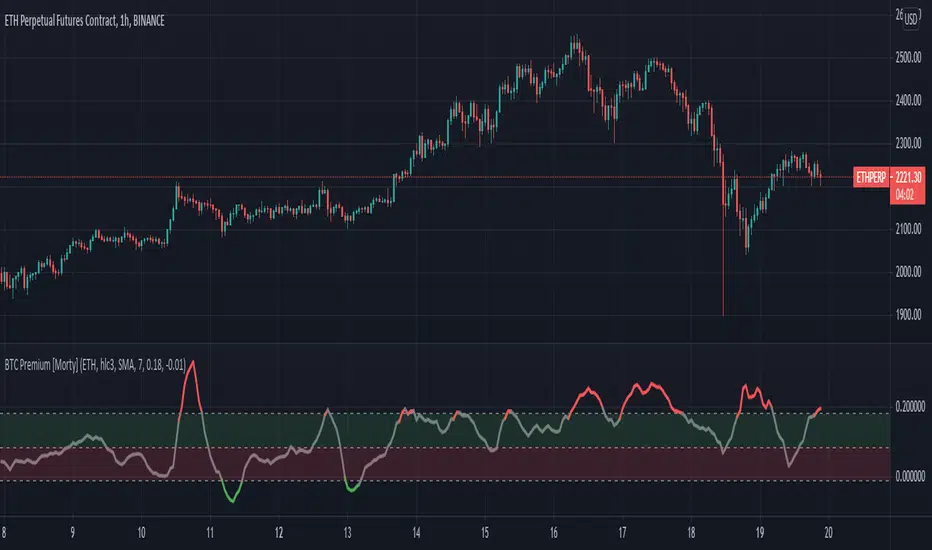
BTC Perpetual Futures Premium [Morty]Version 1.0, 20210409
This is an oscillator indicator that shows the premium between BTC perpetual futures and spot prices.
The prices of futures and spot are weighted average prices, weighted by the exchange's trading volume.
When the indicator is in the upper half of the region, the funding rate of perpetual contracts is relatively high, and the market trend is bullish.
When the indicator is in the upper half of the region, the funding rate of perpetual contracts is relatively high, and the market trend is bearish.
You can set the upper and lower limits of the premium. When the indicator exceeds the upper or lower limit, the trend usually reverses.
Buy the dip, Sell the high.
----------------------------------------------------------
Version 1.0, 20210409
这是一个振荡器指标,它显示了BTC永续期货和现货之间的溢价。
期货和现货的价格是加权平均价格,由交易所的交易量加权。
当指标在上半部区域时,永续合约的资金费率相对较高,市场趋势是牛市。
当指标在上半部区域时,永续合约的资金费率相对较高,市场趋势是熊市。
您可以设置溢价的上限和下限。当指标超过上限或者下限,通常会趋势反转。
Buy the dip, Sell the high.