{Gunzo} Stock to Flow (Gold, Silver, Dollar, Bitcoin)This indicator displays the Stock to Flow (S2F) ratio for popular commodities (Gold, Silver, Dollar, Euro, Bitcoin, Ethereum) in order to
compare them and determine which ones could be a good Store of Value (SoV).
OVERVIEW :
Stock to Flow is a popular indicator used to predict commodities scarcity. It evaluates the total stock of a commodity against the total amount that can be produced during a year. This model supposes that if scarcity is increasing, the price is going to increase.
This model has been used over the last years on Bitcoin to determine if the asset was undervalued or overvalued, and even make prediction models on the future price.
This script is going to focus on the Stock to Flow ratio (total stock/amount produced) to compare the following assets over time :
Mining resources (mined) for Gold and Silver
Cryptos assets (mined) for Bitcoin and Ethereum
FIAT currencies (banknotes printed) for Dollar and Euro
CALCULATION :
The calculation of the Stock to Flow ratio evaluates the total stock of a commodity produced against the production made for a specific year. The data is calculated on a yearly basis, then interpolated to get monthly or daily values.
DATA ORIGIN :
The main information needed to calculate the Stock to Flow ratio is the "yearly production" of a commodity. I tried to retrieve that information from the most reliable sources :
for Gold from research on www.gold.org
for Silver from research on www.silverinstitute.org
for Ethereum from research on etherscan.io
for Bitcoin from data source "QUANDL:BCHAIN/TOTBC" from www.quandl.com
for Dollar from research on www.federalreserve.gov
for Euro from research on www.ecb.europa.eu
SETTINGS :
Smoothing for interpolated data : Smoothing factor for assets that are calculated yearly and then interpolated (Gold, Silver, Dollar, Euro, and Ethereum)
Smoothing for non interpolated data : Smoothing factor for assets that are calculated daily and not interpolated (Bitcoin)
Display asset names : Display assets names in a colored rectangle on the right side of the chart
Display asset values : Display assets Stock to Flow ratio in a colored rectangle on the right side of the chart
Display key events for assets : Display important events for the assets at the bottom of the chart using the same color as the assets lines (for example Orange diamond is a Bitcoin halving). Please refer to the script code for the details of all events.
USAGE :
This script can be used on any asset available on TradingView as the data used is either static or external.
However I recommend using it the Gold asset from currency.com as the depth of the chart will be bigger (since 1980s).
It is recommended to used this script on the monthly timeframe as the chart data is calculated yearly and then interpolated.
Bitcoin (Criptovaluta)

COIN FX PRO TRADERCoin Fx Pro strategy makes the cryptocurrency markets buy and sell automatically. 5 stoploss, fixed profit take and stoploss level can be customized from strategy settings. There are 4 separate strategies that you can set in the strategy. First of them, there are strategies that decide long and short positions in accordance with your settings at the pivot levels, second of the super trend, third of the potential return levels, third of the up and down breaks. Pyramiding can offer multiple entry points. Strategy back tests can be adjusted to the desired time period and can be used as spot or term if desired. Frostybot is set to work fully compatible with js when the necessary inputs are made from these strategy settings. When installing an alarm for FROSTYBOT JS, the alarm message field is {{strategy.order.alert_message}}.
For best back test performance results. Use it
BTCUSDTP and 5 MIN TIME FRAME!!!

Kimchi Premium Indicator with Selectable SymbolsThis indicator is the Korea Premium, also known as “Kimchi Premium” indicator, which shows how expensive and cheap the bitcoin price of the bitcoin exchange in Korea as compared to the bitcoin price traded in dollars or tether. Previously, the Kimchi premium indicator in TradingView does not have the recently added Upbit BTCKRW market, and it is not possible to select markets. In addition to the recently added Upbit BTCKRW market, this indicator is convenient because you can select all markets offered by TradingView. Therefore, not only bitcoin but also altcoin kimchi premium can be plotted.
▶ Usefulness and Originality
- Users can choose from various BTCKRW and BTCUSD markets.
- Users can plot altcoin Kimchi Premium in addition to Bitcoin.
_____________________________________________________________
이 지표는 달러 혹은 테더로 거래되고 있는 비트코인 가격 대비 한국에 있는 비트코인 거래소의 비트코인 원화 가격이 얼마나 비싸고 싼 지를 나타내는 코리아 프리미엄, 일명 "김치 프리미엄" 지표입니다. 이전에 트레이딩뷰에 있는 김치 프리미엄 지표는 최근에 추가된 업비트 BTCKRW 시장이 없을 뿐만 아니라 마켓을 선택할 수가 없습니다. 이 지표는 최근에 추가된 업비트 BTCKRW 마켓과 더불어 트레이딩뷰에서 제공하는 모든 마켓을 선택할 수 있어 편리합니다. 따라서 비트코인 뿐 만 아니라 알트코인의 김치 프리미엄도 plot할 수가 있습니다.
▶ 유용성과 독창성
- 사용자가 다양한 BTCKRW 및 BTCUSD 마켓을 선택할 수 있음
- 사용자가 비트코인 외에 알트코인 김치프리미엄도 plot 할 수 있음

ATR Start & Stop BotThis script is using Average True Range (ATR) and works very well on the Bitcoin 4 hour timeframe to determine when to stop and start your bots.
It has a very similar visual to the EMA RSI Indicator found here:
This 'ATR Start & Stop Bot' is better because it has less confusion during sideways market movement.
As an example - You are using 3commas and have a Composite bot setup with several alt coins, you can use this indicator with the ' Stop bot ' alert to disable your composite bot from taking trades at times when the market is on a trend that looks in the red.
Alternatively you can use the ' Start bot ' alert to turn your bot back on during the green uptrends.
Using this indicator with these alerts on the Bitcoin 4-Hour chart add a great layer of automation to your already existing bots.
Credits:
Original 'ATR Stops' indicator belong to the user failathon and that script is found here:
Also credits to Dradian for the alert additions.

Sam4x 9:45 secretWhat Is the Sam4x 9:45 Secret?
The Sam4x 9:45 secret indicator uses three smoothed moving averages, set at five, eight, and 13 periods, which are all Fibonacci numbers. The initial smoothed average is calculated with a simple moving average (SMA), adding additional smoothed averages that slow down indicator turns.
SUM1 = SUM (CLOSE, N)
SMMA1 = SUM1/N
Subsequent values are:
PREVSUM = SMMA(i-1) *N
SMMA(i) = (PREVSUM-SMMA(i-1)+CLOSE(i))/N
Where:
SUM1 - the sum of closing prices for N periods;
PREVSUM - smoothed sum of the previous bar;
SMMA1 - smoothed moving average of the first bar;
SMMA(i) - smoothed moving average of the current bar (except for the first one);
CLOSE(i) - current closing price;
N - the smoothing period.
How the indicator is calculated is important for understanding the inner workings of the indicator. Luckily, the calculation is not required in practice. The Alligator indicator can be added to your charts from the indicator list in your charting or trading platform.
The three moving averages comprise the Jaw, Teeth, and Lips of the Sam4 9:45 secret opening, and closing in reaction to evolving trends and trading ranges:
Jaw (blue line): Starts with the 13-bar SMMA and is smoothed by eight bars on subsequent values.
Teeth (red line): Starts with the eight-bar SMMA and is smoothed by five bars on subsequent values.
Lips (green line): Starts with the five-bar SMMA and smoothed by three bars on subsequent values.

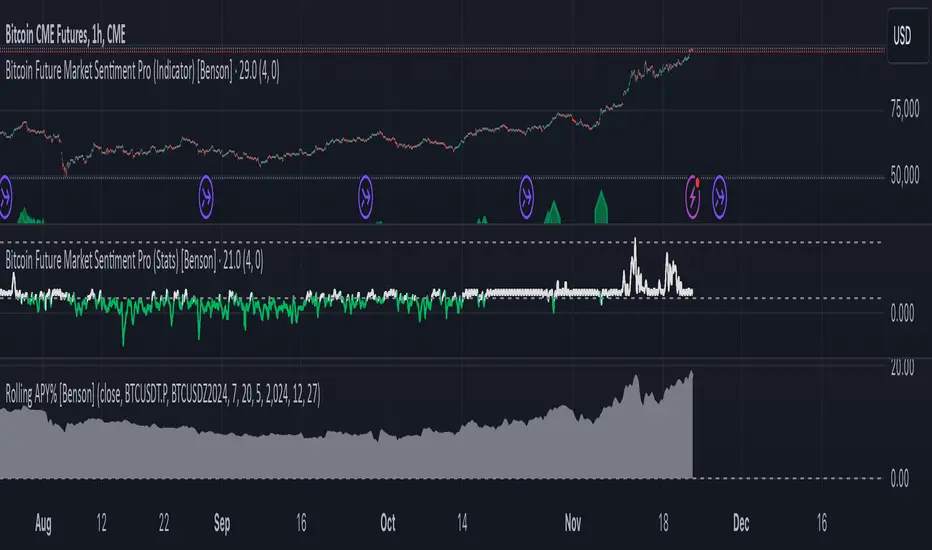
Rolling APY% [Benson]The indicator shows future rolling APY%.
Users can change the market by changing symbol. BTC is the default market.
Meanings of different BTC Rolling APY%:
Below 0 %= DOOMSDAY (it happened during the big crash on March 12, 2020)
0%-5% = extremely fearful
5%-10% = neutral
10%-15% = slightly optimistic
15%-20% = very optimistic
Above 20% = FOMO (it happened during the global top on 14 April, 2021)
Use this indicator to identify the arbitrage opportunities and the price top/bottom.
This is a paid indicator. Only for Sentiment Indicator subscribers.
Chanu Delta StrategyThis strategy is built on the Chanu Delta Indicator, which indicates the strength of the Bitcoin market. When the Chanu Delta Indicator hits “Delta_bull” and “Delta_bear” and closes the candle, long and short signals are triggered respectively. The example shown on the screen is a default setting optimized for a 4-hour candlestick strategy based on the Bybit BTCUSDT futures market. For the 15-minute candle, "Delta_bull=32", "Delta_bear=-31", "Source=hlc3" are best. You can use it by adjusting the setting value and modifying it to suit you.
If you use this strategy in conjunction with the Chanu Delta Indicator, it is convenient to anticipate alert signals in advance. Since the Chanu Delta Indicator represents the price difference based on the Bybit BTCUSDT futures market, backtesting is possible from March 2020.

Chanu Delta IndicatorThe Chanu Delta Indicator was created as the price difference between the two markets using the principle that the Bitcoin price fluctuations in the BTCUSD market on the BYBIT exchange are greater in the BTCUSDT market. This indicator shows the strength of the current market's buys and sells, and helps in short-term trading.
Chanu Delta Indicator (Δ) = BTCUSD ($) - BTCUSDT ($) (Unit: Dollar, Source: Close)
● Δ > 100 : Strong Buy
● 20 < Δ < 100 : Buy
● -20 < Δ < 20 : Neutral
● -100 < Δ < -20 : Sell
● Δ < -100 : Strong Sell

Godson Options ScriptUses Stdev to calculate the varience in expected price movement
Uses HMA to determine Long or Short trend
M means volatility is very low and you should consider buying Move contracts or Long Straddles
BTFD means the price has strayed too far from the mean
Upper and Lower bands are Stdev, middleband is the Mean
All inputs are adjustable so you should.

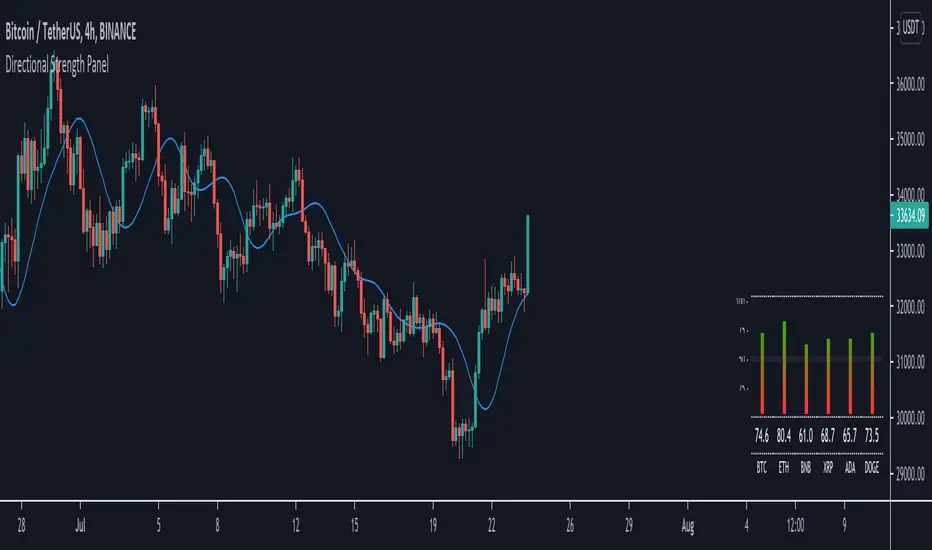
Directional Strength Panel█ OVERVIEW
The panel display trend momentum of selected coins/symbol (up to 6) based on the Arnaud Legoux Moving Average (ALMA). I'm using ALMA to measure the trend because it resolves 2 main issue of the more common moving averages, smoothing and responsiveness. By removing the minor fluctuations in price without sacrificing the responsiveness, the trend become much more clearer and easier to be measured.
In essence, as the meter approaches 100, it means the ALMA is pointing up (0 means pointing down)
█ Features
- Adjustable ALMA settings with options to turn on/off display the ALMA on current chart
- Select 6 symbols of your choice to be monitored in the settings (You have to manually update the label to display)
- Working on all timeframes
- Switch the panel color to suit background chart theme (Light/Dark)
█ Developer Notes
I'm working with table a lot lately and decided to publish this as a sample if anyone wishes to edit the script to display whatever they want. main calculation in get_data() function should be clamped to value between 0-100. As for the panel size, you can edit the row_max (currently set to 20 and 40) if you need it to be smaller or bigger (**i feel anything smaller than 16 is ugly)
█ Disclaimer
Past performance is not an indicator of future results.
My opinions and research are my own and do not constitute financial advice in any way whatsoever.
Nothing published by me constitutes an investment recommendation, nor should any data or Content published by me be relied upon for any investment/trading activities.
I strongly recommends that you perform your own independent research and/or speak with a qualified investment professional before making any financial decisions.
Any ideas to further improve this indicator are welcome :)
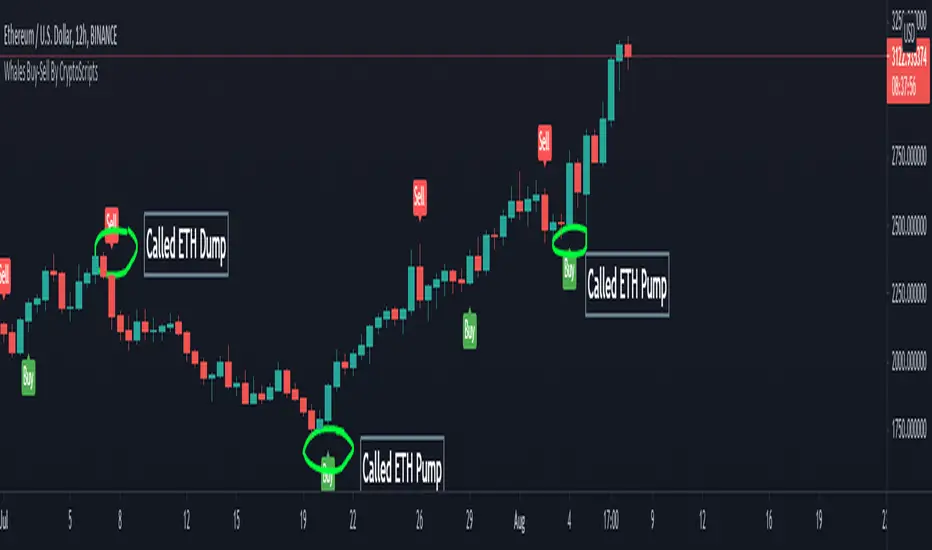
Whales Buy-Sell By CryptoScriptsThe Whales Buy-Sell indicator is very unique because it uses a combination of the smoothing range, average ranges, and hi-band/low-bands combined with various moving averages to nail whenever the overall trend is changing. This is extremely important during periods of high volatility and large moves. It helps to keep someone in a trade longer and get out fast if the trend is changing. The big caveat I can stress is waiting until the candle closes so that you know the signal is confirmed! Use the Bar Replay feature to further understand the intricacies of how the indicator produces signals. I find it is better on larger timeframes (1h and higher) because it's measuring larger trends. It can still be used on smaller timeframes but may not be as accurate. The big shortcoming is that is doesn't do well in choppy environments (i.e barely any price movement up or down) and you may get a lot of back and forth buy/sell signals so PLEASE keep that in mind. Experiment with various tickers/timeframes and see what works best for you :)
This indicator is a trend analysis indicator. Trend analysis is a technique used in technical analysis that attempts to predict future stock price movements based on recently observed trend data. Trend analysis is based on the idea that what has happened in the past gives traders an idea of what will happen in the future, but that is NOT always the case! Past performance is NOT indicative of future returns. There are three main types of trends: short-, intermediate- and long-term. Trend analysis tries to predict a trend, such as a bull market run, and then ride that trend until data suggests a trend reversal, such as a bull-to-bear market.
Alerts
You can set alerts for either a 'Buy Signal' or 'Sell Signal'. I recommend setting alerts for the candle close so that you know the signal is confirmed! If the "Add Alerts" option is greyed out for the indicator, just refresh your tradingview page and you should be able to see it :)
PM me to obtain access and please let me know if you have any questions!
3x EMA fast, 3 x MA slow + BB + PsarThis is a trend system which combines multiple fast EMA + mulitple slower SMA together with bollinger band channel and PSAR.
For entry rules the ones that I use are:
Long
We are inside BB channel, psar is ascending, and our close is above all moving averages or below all EMA'S + 1 SMA
WE can exit either when our close is below all EMA's or when PSAR is descending or when we hit upper/lower BB levels
Short
We are inside BB channel, psar is descnending, and our close is below all moving averages or below all EMA's + 1 SMA
WE can exit either when our close is above all EMA's or when PSAR is ascending or when we hit upper/lower BB levels
If you have any questions, let me know

[Joy] Aladdin Long Trading Strategy 1.0.0 AlphaAladdin's Long trading strategy is to test out Aladdin for long trades only
This strategy is mainly used to test whether Aladdin is suitable for a coin/stocks/futures or for any trading. The profitability, average drawdown, average profits, etc are used by me to decide whether to use it for trading.
What is Aladdin and what does it do?
Using the volume and gradual flow of non-interrupted data (wicks and body of the candles), it tries to detect the macro condition of the market so that one may know in which direction the market is flowing.
* Bearish / Sell sign: On the candle's close, I open a short position
* Bullish sign: On the candle's close, I open a long position
* I take at least 50% profit when the indicator indicates to do so. One can configure that value as desired from the configuration depending on one's risk/money management. I might even convert some portion of the position into stable coins.
FAQ
Q: Does it use some EMA /MA/etc.? Does it use any indicator with tweaked settings?
Answer: No.
Q: What does it mostly depend on?
Answer: Volume and gradual flow of non-interrupted data. The logic depends purely on volume , price bars and the wicks.
Q: Does it work with all coins, stocks, futures, instruments?
Answer: I prefer to use the exchange with the best possible data. Then backtest out to find the best possible timeframe, stop loss and target all derived from this script data.
Q: Can you make it free or make it open source?
Answer: There is no free lunch in this world. I will never reveal or share the source code!
Q: Do you provide ongoing support for the indicator?
Answer: Yes, as long as I can, I will continue updating the indicator
Q: Are the bullish /buy & the bearish/sell markers automatic?
Answer: I have no control over the markers. It is driven purely by logic from the script.
Q: Is this financial advice?
Answer: This is not financial advice. I do not guarantee any profit or loss. I am not responsible for any of your losses or profits. My indicators do not assure profit or loss. It also does not auto-open or auto-close a trade.
Assumptions:
Only long trades are opened and closed. No short trades.
Starting Capital: $20,000
Order Size: 20% of Capital
Data used: Whatever data is available from 2011 till today on Trading view
Findings:
INDEX: BTCUSD 83% profitability using 2day tf
54 closed trades
Profit factor: 16
Sortino Ratio: 5.2
Average Winning Trade: 30%
Average Losing Trade: 9.12%
Largest Winning Trade: 1218%
Largest Losing Trade: 20.25%
Below are the profitability rate for the timeframe and the coins listed as found by running the trading strategy over the following as of today (Aug 1st 2021 12:40 pm Sydney Time).
⚜️ INDEX:BTCUSD 83% using 2day tf
⚜️INDEX:ETHUSD 80% using 1day tf
⚜️FTTUSD 81% using 2day tf
⚜️SRMUSD 71% using 1day tf
⚜️ADAUSDT 81% using 2day tf
⚜️ALGOUSD > 90% using 2day tf
⚜️ALTPERP 81% using 2day tf
⚜️AVAXUSDT 75% using 1day tf
⚜️BANDUSD > 90% using 2day tf
⚜️BCHUSD 82% using 2day tf
⚜️BNBUSD 79% using 1day tf
⚜️BNBUSD 85% using 2day tf
⚜️CHZUSD 71% using 1day tf
⚜️COMPUSD 81% using 1day tf
⚜️DOGEUSD 77% using 1day tf
⚜️EXCHPERP 83% using 1day tf
⚜️FILUSD > 90% using 1day tf
⚜️FTMUSD 70% using 2day tf
⚜️HTUSDT 75% using 2day tf
⚜️KINUSD >90% using 2day tf
⚜️LINKPERP 85% using 2day tf
⚜️LTCUSD 80% using 2day tf
⚜️MATICUSD 77% using 2day tf
⚜️NEOUSD 80% using 1day tf
⚜️NEXOUSD > 90% using 1day tf
⚜️OKBUSD 71% using 1day tf
⚜️OMGUSD 75% using 1day tf
⚜️RSRUSD 87% using 1day tf
⚜️RUNEUSD > 90% using 1day tf
⚜️SHITPERP > 90% using 1day tf
⚜️SOLUSD 84% using 1day tf
⚜️SUSHIUSD 71% using 1day tf
⚜️THETAUSD > 90% using 2day tf
⚜️UNIPERP 83% using 1day tf
⚜️VERTPERP > 90% using 1day tf
⚜️XAUUSD 63% using 2day tf
⚜️XTZUSD 83% using 2day tf
⚜️ZECUSD 72% using 2day tf
Disclaimer:
No one knows what will happen in the future. DYOR and decide on your own conditions. Do realize that neither I nor my indicator can guarantee any profit or loss. And there is no assurance that any trade will ever result in any profit. It is not financial advice.

RSVP Extractor By CryptoScriptsThis indicator has the same alerts as the VP Extractor except I overlaid the RSI on top of it (yellow line) to help take advantage when the RSI is overbought/oversold while also being able to see what the VP extractor is saying :)
It highlights yellow any time the RSI is below 30 (potential buy signal) and highlights orange anytime the RSI is above 70 (potential sell signal). You can also adjust the settings so that it'll highlight yellow when RSI is below 25 or 20 etc. so you can pick whatever value you want and the colors will adjust accordingly :) You can also set alerts for RSI overbought/oversold!
Please see the VP Extractor Alerts below! Those are still the same as before but since I now have RSI then you can be more confident in your signals if RSI is flashing a yellow shaded area (oversold) and the VP extractor is flashing a rocket symbol (buy), then both together would be a very strong buy signal. Using the RSI signals with the VP Extractor signals below will make you VERY successful with this indicator :)
The VP Extractor signals is a combination of the Volume Extractor and Price Extractor. There was a lot of coding involved in this one and it involves a Volume / Price Oscillator derived from various volume /price metrics combined with Bollinger Bands and Overbought/Oversold levels. This indicator is unique because it not only measures the standard deviations whenever the oscillator crosses outside the BBs but it does so at ranges that are most advantageous for the trader to identify KEY buy/sell levels (as shown above). I'll break down each signal below and how to best take advantage of them so you can get the best entries and capture the most profit per trade.
*This indicator works best on the Binance or Bybit exchange for crypto but also works for stocks and forex. It's best used on small-medium timeframes such as the 15min, 1h, 4h, 8hr, or 12h. It tends to give more false signals on the 1D timeframes and higher.
Red Alarm - this signal indicates that the volume and/or price oscillators are overbought and/or crossing outside of the bollinger bands . This is a STRONG sell signal but should still be combined with support/resistance levels and confirmed with other indicators.
Red Diamond - this signal indicates that the volume and price oscillators are crossing outside of the bollinger bands above the 20 level but is not yet overbought. This is a potential sell signal but should still be combined with support/resistance levels and confirmed with other indicators.
Red Shaded Area - this indicates the volume and price oscillators are overbought. This is a potential sell signal but should still be combined with support/resistance levels and confirmed with other indicators.
Rocket - this signal indicates that the volume and/or price oscillators are oversold and/or crossing outside of the bollinger bands . This is a STRONG buy signal but should still be combined with support/resistance levels and confirmed with other indicators.
Green Diamond - this signal indicates that the volume and price oscillators are crossing outside of the bollinger bands below the 20 level but is not yet oversold. This is a potential buy signal but should still be combined with support/resistance levels and confirmed with other indicators.
Green Shaded Area - this indicates the volume and price oscillators are oversold. This is a potential buy signal but should still be combined with support/resistance levels and confirmed with other indicators.
Input Options
Show 80 Levels - This checkbox will create a red zone and green zone for the 60-80 levels on the indicator. This is useful if the volume and price oscillators reaches one of these levels, you can be sure it's going to reverse soon and can have more confidence if it crosses outside of the BBs in addition to that.
VEO Length - This changes the height of the oscillator and will change how your signals flash (more or less often). Use this if you find you're getting too many signals or not enough. I find this is best at 21 but feel free to test out what works for you depending on your timeframe.
Moving Average Volume Source - This is currently set to None but you can change it to Exponential, Hull, or Simple moving average . I found that None works best but feel free to test out the different options.
Moving Average Length - Changing this length will do nothing to your chart if None is selected for the Moving Average Volume Source, therefore you will most likely keep this setting default at 9.
Alerts
I've set alerts on this indicator for each icon (Red Alarm, Red Diamond, Overbought, Rocket, Green Diamond, Oversold). I HIGHLY recommend setting the alerts for Candle Close so that you can be sure the signal is confirmed.
You may notice that the indicator can give multiple signals back-to-back or be overbought/oversold for multiple candles. When this happens, it's best to look at other indicators such as the RSI , MFI Pro, etc to nail the best entry and have confluence with your decision. With that said, having multiple signals back-to-back can also be an indication that the move is close to happening.
This indicator is a strong indicator by itself but works best when combined with my other indicators just as the Whales Buy-Sell and the MFI Pro as well as the RSI , and MACD i.e taking a trade when all indicators are showing overbought, "Buy", "Sell", etc. Measuring volume and price action is an extremely important aspect of trading and one I believe should not be overlooked. I hope I made everything as clear as possible and please let me know if I didn't.
PM me to obtain access and please let me know if you have any questions! :D

[Joy] Aladdin (1.0.0 Alpha)Explanation of the markers in the indicator
* Bearish / Sell sign: On the candle's close, I open a short position
* Bullish sign: On the candle's close, I open a long position
* Red circle: On the candle's close, I take at least 50% unrealized profit into a realized profit of any running long leverage position. I might even convert some portion of the position into stable coins.
* Green circle: On the candle's close, I take at least 50% unrealized profit into a realized profit of any running short leverage position. I might even convert some portion of the position into stable coins.
* Down Arrows: When the down arrow finishes and the candle close, I put a tighter stop loss of any running long leverage position. It sometimes indicates the local top.
* Up Arrows: When the up arrow finishes and the candle close, I put a tighter stop loss of any running short leverage position. It sometimes indicates the local bottom.
* Purple candle: Weakly bullish.
* Green candle: Strongly bullish
* Red candle: Strongly bearish
* Yellow candle: Weakly bearish
FAQ
Q: Does it use some EMA /MA/etc.? Does it use any indicator with tweaked settings?
Answer: No.
Q: What does it mostly depend on?
Answer: Volume and gradual flow of non-interrupted data. The logic depends purely on volume, price bars and the wicks.
Q: Does it work with all coins, stocks, futures, instruments?
Answer: I prefer to use the exchange with the best possible data. Then backtest out to find the best possible timeframe, stop loss and target all derived from this script data.
Q: Can you make it free or make it open source?
Answer: There is no free lunch in this world. I will never reveal or share the source code!
Q: Do you provide ongoing support for the indicator?
Answer: Yes, as long as I can, I will continue updating the indicator
Q: Are the bullish /buy & the bearish /sell markers automatic?
Answer: I have no control over the markers. It is driven purely by logic from the script.
Q: Is this financial advice?
Answer: This is not financial advice. I do not guarantee any profit or loss. I am not responsible for any of your losses or profits. My indicators do not assure profit or loss. It also does not auto-open or auto-close a trade.
Note:
The Aladdin has been derived from the Super Algorithm Indicator. I have depreciated the Super Algorithm Indicator I have automatically migrated every user to Aladdin, who had Super Algorithm Indicator. One should not use the SA indicator. One should start using this indicator instead.
Version 1
A derived version of Super Algorithm Indicator with optimized code (uses arrays, removes few warnings in the code, makes code more reusable) so that I can add further features in the future. A few new coding features in the pine script encouraged me to go for this version. Since the codebase has been revamped, it made sense for me to make it a new indicator. have also changed a small parameter that is configurable at the moment. Previously it was valued at 26. Now I am putting value at 21.
Aggregated Volume Colored (Bitcoin, ETH, Altcoins, everything)BITSTAMP:BTCUSD
This indicator aggregates trading volume data of up to 10 symbols and can display the individual data by color.
It is useful for assets which are traded on multiple exchanges, like cryptocurrencies, commodities, forex and derivatives showing you what is happening across the market and on the individual exchanges to give you beter insights.
You can change the symbols from which the indicator gathers data in the settings under inputs, just like the colors, and you can add a moving average.
By default trading volume is aggregated from the following symbols:
Binance, BTC /USDT
Binance, BTC /BUSD
Bingbon, BTC /USD
Huobi, BTC /USDT
OkeX, BTC /USDT
Coinbase, BTC /USD
Bitfinex, BTC /USD
Gemini, BTC /USD
Kraken, XBT/USD
Bitstamp, BTC /USD

Compare Crypto Bollinger Bands//This is not financial advice, I am not a financial advisor.
//What are volatility tokens?
//Volatility tokens are ERC-20 tokens that aim to track the implied volatility of crypto markets.
//Volatility tokens get their exposure to an asset’s implied volatility using FTX MOVE contracts.
//There are currently two volatility tokens: BVOL and IBVOL.
//BVOL targets tracking the daily returns of being 1x long the implied volatility of BTC
//IBVOL targets tracking the daily returns of being 1x short the implied volatility of BTC.
/////////////////////////////////////////////////////////////////
CAN USE ON ANY CRYPTO CHART AS BINANCE:BTCUSD is still the most dominant crypto, positive volatility for BTC is positive for all.
/////////////////////////////////////////////////////////////////
//The Code.
//The blue line (ChartLine) is the current chart plotted on in Bollinger
//The red line (BVOLLine) plots the implied volatility of BTC
//The green line (IBVOLLine) plot the inverse implied volatility of BTC
//The orange line (TOTALLine) plots how well the crypto market is performing on the Bolling scale. The higher the number the better.
//There are 2 horizontal lines, 0.40 at the bottom & 0.60 at the top
/////////To Buy
//1. The blue line (ChartLine) must be higher than the green line (IBVOLLine)
//2. The green line (IBVOLLine) must be higher than the red line (BVOLLine)
//3. The red line (BVOLLine) must be less than 0.40 // This also acts as a trendsetter
//4. The orange line (TOTALLine) MUST be greater than the red line. This means that the crypto market is positive.
//5.IF THE BLUE LINE (ChartLine) IS GREATER THAN THE ORANGE LINE (TOTALLine) IT MEANS YOUR CRYPTO IS OUTPERFOMING THE MARKET {good for short term explosive bars}
//6. If the orange line (TOTALLine) is higher than your current chart, say BTCUSD. And BTC is going up to. It just means BTC is going up slowly. it's fine as long as they are moving in the same position.
//5. I use this on the 4hr, 1D, 1W timeframes
///////To Exit
//1.If the blue line (ChartLine) crosses under the green line (IBVOLLine) exit{ works best on 4hr,1D, 1W to avoid fakes}
//2.If the red line crosses over the green line when long. {close positions, or watch positions} It means negative volatility is wining

Multi-X by HamidBoxHello to All, introducing Multi Types Crossover strategy,
simply the best way of trading with Crossover and Crossunder Strategy, How it Works???
I added 5 types of Moving Averages,
1: Simple Moving Average ( SMA )
2: Exponential Moving Average ( EMA )
3: Weighted Moving Average ( WMA )
4: Volume Weighted Moving Average ( VWMA )
5: Relative Moving Average (RMA)
With this indicator, you can do scalping, You can trade not only with similar types of Moving Average indicators but also with different types of Moving Average indicators.
what is mean? like: Normal Condition is:
( Simple Moving Average ) Crossover to ( Simple Moving Average ), SMA x SMA
( Exponential Moving Average ) Crossover to ( Exponential Moving Average ), EMA x EMA
But we can Crossover with:
( Exponential Moving Average ) Crossover to ( Simple Moving Average ), EMA x SMA
( Simple Moving Average ) Crossover to ( Weighted Moving Average ), SMA x WMA
( Weighted Moving Average ) Crossover to ( Weighted Moving Average ), WMA x WMA
( Simple Moving Average ) Crossover to (Relative Moving Average), WMA x RMA
and also I added Moving Average ZONE in this tool, What does it work???
The zone will tell us what type of direction the market has, if the market is above the zone, it's mean we have a Bullish Trend, and if the market is below the zone, it means the market has a Bearish Trend,
so if you want to play on the safe side, never trade when the market is in Bearish Trend, and if you want to play on aggressive mood, you can skip Moving Average Zone section.

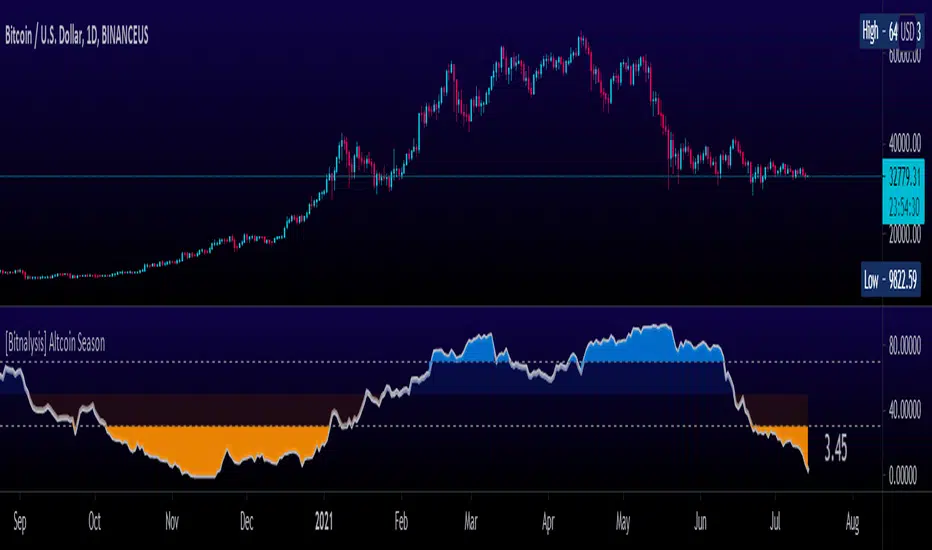
[Bitnalysis] Altcoin Season IndicatorThe Altcoin Season Indicator compares performance of Bitcoin with the performance of the top altcoins over a specified period. The indicator weights the results, giving greater weight to the first specified altcoins. By default, the larger market cap altcoins, such as ETH, BNB, ADA, etc., are included first and therefore given greater weight in the algorithm. To remove the weighting from the formula and consider the performance of all listed altcoins equally, set the weighting setting to "0".
The output shows to what extent altcoins are outperforming Bitcoin; the higher the number, the more altcoins are outperforming Bitcoin. This indicator helps traders predict when "altcoin season" is about to begin or end.
Fed Balance Sheet Growth Rate p.a.Plots the rate of change in the Fed Balance sheet.
Defaults to annual rate of change.
Option to plot the raw balance sheet data.

MacroCorrelation (Bitcoin Real Value)The best minds in the financial world think about how to determine the real value of an asset.
I constantly say that it is necessary to buy an asset only at the moment when its market price is below or equal to its fundamental value. Let's see what is the difference between these two concepts.
Fundamental value
Imagine that we decided to grow and sell, for example, strawberries. For this, we purchased the necessary equipment, tools, fertilizers, seeds, and more. Let's say that we needed $ 3000 for this purpose.
To facilitate the task, in our calculation we will not take into account all types of possible costs (electricity cost, workers' wages, necessary tax deductions, etc.).
If we had to take a loan to meet the initial needs, for example, at 10% per annum , then each borrowed $ 1000 in a year would cost us $ 1100. That is, $ 3000 would cost us $ 3300 per year.
Let's agree that our initial funds were completely enough to buy everything we needed, and we didn't need to take out a loan at a certain percentage. In this case, we exclude from the calculation the cost of the capital required to start your own business.
Suppose we managed to harvest 100 kg of strawberries. This means that the real value (fundamental value) of 1 kg of our strawberries is $ 30.
Market price
Things are a little different with the market price. The market price is determined by the volume of supply and demand for a particular product or service at a particular point in time.
By demand, we mean the intention to purchase a product or service (secured by the ability to pay a set price for it). A need that exceeds solvency is not a demand.
By offer, we mean the willingness to provide ownership (use) of the object of demand for a certain fee.
Simply put, the market price is the price at which the buyer is willing to buy (and the seller to sell) the volume of goods we need.
In our case, the price at which we sell 1 kg of our strawberries will depend on how much people really need our strawberries.
If we are the only sellers of strawberries in a certain territory and, at the same time, buyers really want to taste fresh strawberries, its market price can be as high as the last buyer is able to pay. If not, everything will depend on how high quality our product will be for its price. At the same time, the price constantly varies over a certain period of time ( seasonality and other factors). For example, if in winter we could sell 1 kg of our strawberries for $ 90, then in summer for $ 50. Strawberry prices range from $ 50 to $ 90.
Magic formula
We now understand what is the difference between fundamental value and market price. If the first is made up exclusively of a set of real metrics, the second is a variable factor that depends primarily on “human factors” (what is the maximum price the buyer is willing to pay, what is the minimum price the seller is willing to set at a particular moment in time).
You should try to buy an asset only at the moment when its market price is below or equal to its fundamental value.
However, how can you independently determine the fundamental value of an asset?
Unfortunately, there is no universal answer to this question, just as there is no universal “magic formula” in nature (my sincere respect, Joel Greenblatt) that could determine the fundamental value of any asset on the planet. The point is precisely in the criterion of universality. If we consider each asset (or at least the market) separately, we can well determine its fundamental value.
Even those things that seem free to us in everyday life (just their cost are negligible) have a fundamental value.
Three factors to assess the fundamental value of Bitcoin
Let's try to take a separate asset, for example Bitcoin , and do with it everything that we did earlier with our “strawberry business”.
When assessing the real (fundamental) value of Bitcoin , we will take into account 3 main factors.
1. The maximum possible and current supply in the Bitcoin market
The reward for mining a Bitcoin block is halved every 210,000 blocks. This fact is called halving (halving). When all blocks are mined, the total amount of existing bitcoins will be 21 million coins.
Accordingly, the maximum supply in the Bitcoin network will not exceed 21 million coins.
In reality, things are even better, since this volume also includes a certain amount of lost coins. By lost, we mean all those coins whose “private keys” the last owner no longer has access to. For example, at the time of the appearance of Bitcoin in 2009, its real value was doubtful and not obvious to most of its owners, many of whom did not pay due attention to understanding the safe storage of an asset, periodically losing access to hundreds and thousands of coins.
As a result, we understand that the total supply in the Bitcoin market will be significantly less than 21 million coins.
To evaluate the proposal, it is not enough to understand how much of the asset exists, because a certain amount of it, as we have already understood, can either be lost or be blocked for a long time. It is also important to take into account the criterion of “supply in time”. That is, the current total “liquidity” of the network.
2. Bitcoin network hashrate
The main indicator of the viability and stability of the Bitcoin network is the hash rate (computing power). Stable hashrate = network security.
3. The real value of the US dollar
When analyzing the Bitcoin / Dollar pair, in addition to the real value of Bitcoin , it is also necessary to take into account the real value of the US Dollar .
It is believed that assets such as stocks or cryptocurrencies are extremely volatile (the price can change over a wide range within a relatively short period of time). At the same time, to reduce volatility , experts advise using the so-called “currency baskets”.
A currency basket is a certain percentage of foreign currencies in which the investor's capital can be distributed. The ratio of currency units in the basket is used to reduce the potential risk of currency fluctuations.
The main problem is that, due to inflation , the purchasing power of the currencies themselves drops significantly over time.
With the $ 100 we earned in 1913, already in the 1920s we could have purchased 50% fewer goods and services than before. In the 1980s, it was 90% less, and in the 2010s it was already 98% less.
This fact must also be taken into account when assessing the real value of Bitcoin , since everything is relative, and in the Bitcoin / Dollar pair, we determine the value of Bitcoin , expressed in US dollars.
The real value of Bitcoin
After assessing the relationship of the factors described above and drawing up a mathematical formula, we can proceed to the analysis of the results. In order to cut off unnecessary noise when constructing the function, we will use the graph for 1 month.
Analyzing the resulting chart, first of all, the following is striking: the fundamental value of Bitcoin grows over time. This is due to the gradual expansion of the "user base" of the network, as well as the growth of its popularity among investors of completely different classes.
I propose to compare the graph obtained earlier with the graph of Internet users (in% of the number of adult US citizens ). Similar, don't they?
The more the number of Internet users, the higher its influence and economic potential. The more the number of users of the Bitcoin network, the higher its economic potential and fundamental value.
However, understanding the fundamental value alone is not enough. We, as investors, first of all need to understand when to buy any asset.
To do this, compare the chart of the market price of Bitcoin with the chart of its fundamental value obtained earlier.
Now that we have a complete picture of what is happening and understand both the fundamental value of the asset and its market price, the fact of the numerical prevalence of the price over the fundamental value for 116 out of 133 months becomes quite clear. Periods of Bitcoin being below its fundamental value are extremely rare and only take ~ 13% of the trading time.
For about 87% of all trading time, Bitcoin's market price is above its fundamental value. Those rare periods when traders are willing to sell bitcoin below its fundamental value are an incredible gift for a long-term investor.
Bull and Bear Markets
If you buy Bitcoin (like any other asset) below its fundamental value, this is an absolutely incredible idea in terms of potential profitability, who in their right mind would sell their assets below this mark ?!
It's all about the emotionality of people. Saying “I will not do stupid things when the time is right” is easier than actually maintaining composure. Especially when it comes to money. Your money. And sometimes even dreams.
The classical market theory usually divides the market into two main phases: A bull market is a period of time during which the price rises systematically (accordingly, the demands and expectations of traders gradually grow). A bear market is a period of time during which the price gradually falls (accordingly, traders' requests and expectations gradually fall).
There is also the concept of “correction”: A correction is a temporary change in the price of an asset, contrary to the main trend.
For the current day, there is not a single clear criterion that separates the concept of a bear / bull market from the concept of a correction. However, we can say with confidence that the market change (from bullish to bearish or from bearish to bullish ) is interconnected with the fundamental factors of the market. Corrections, on the other hand, have significantly less connection with fundamental indicators.
and are rather related to the “physiology of the market” (nothing can only rise in price every unit of time for a significantly long time, nothing can only fall in price every unit of time for a significantly long time).
In this case, the most rational would be to define a bear market as a delay in updating the absolute historical highs of the price with a preliminary touch of the fundamental value.
Buying below the fundamental value is always a smarter idea than buying above the fundamental value, since, in most cases, it is the touch of the fundamental value that globally separates a bear and a bull market.
Fun fact: If we were to buy Bitcoin every time it touched the fundamental value, the average buy price as of July 2021 would be $ 1,506.65, which is 87% less than the current fundamental value of Bitcoin .
Conclusions
1. The total amount of Bitcoins , as well as the speed of their production (mining) over time, are programmatically limited, which limits the volume of the maximum possible supply
2. Bitcoin is transported, which means that the volume of supply for the current minute will also depend on the actual volume of assets available for sale
3. The viability of the network is based on the amount of computer power supporting it (network hash rate)
4. When analyzing the Bitcoin / Dollar pair, in addition to the real value of Bitcoin , it is also necessary to take into account the real value of the US Dollar
5. Price ≠ fundamental value
6. Buying below the fundamental is always a smarter idea than buying above the fundamental.
7. Don't believe the headlines of financial news and the public words of financiers
8. Selling strawberries can make a fortune too

Block Time AverageBitcoins network adjusts to maintain an average block time of 10 Minutes per block.
This chart uses the Hashrate and Difficulty to provide the average block time
< 10 Mins = Hashrate is increasing (Green)
> 10 Mins = Hashrate is decreasing (Red)

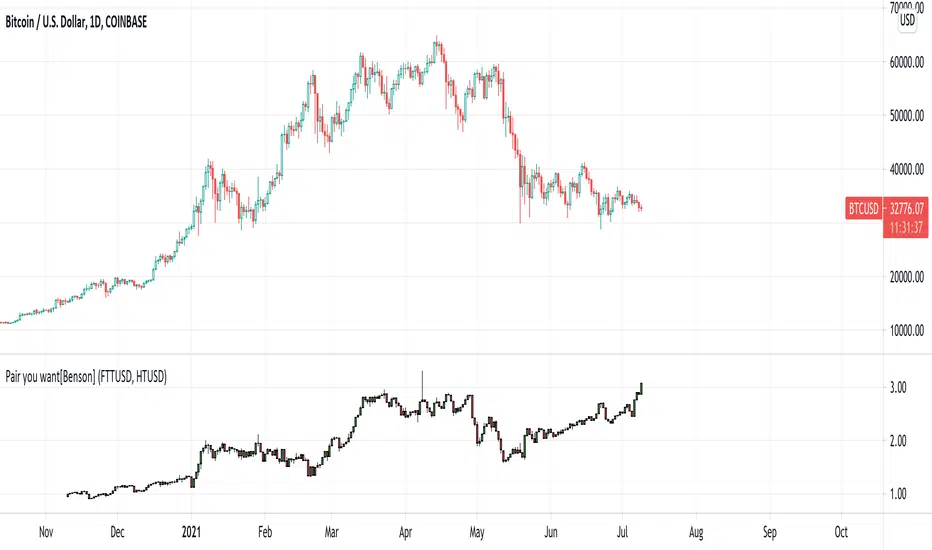
Pair you want[Benson]Create your own crypto pair to see the relative price movement between 2 coins.
This indicator is a good reference tool to do hedge trading.
Users can enter the exchange and ticker name they like.