Bitcoin (Criptovaluta)

BITCOIN CME FUTURES GAPSDisplays information about Bitcoin CME Futures Gaps over BTCUSD (or XBTUSD) charts.
You can configure a threshold percentage to only display gaps whose size is greater than that percentage. The gap precentage is calculated based on the current close price.
Gaps up are displayed in Orange, gaps down in Green

Bitcoin Comparison to GBTC!This script tells you if GBTC is overvalued or undervalued compared to Bitcoin.

200 Week Moving Average HeatmapСolors part of the SMA depending on the change in % (delta %) to the previous value. From blue(none to low increase) through green(moderate increase) to red(high increase).


BTC CME PremiumThe Chicago Mercantile Exchange bitcoin futures price versus a volume weighted index of bitcoin spot markets.
Positive values (green) means the CME price is higher than the spot index.
Negative values (red) means the CME price is lower than the spot index.
Whether a high CME price is bullish or not is up for debate so make of it what you will.
Weekends are highlighted with soft blue shading because during the weekend CME trading is halted which obviously has a big impact on the premium.
There's an option to turn this shading off.
Markets included for the volume weighted index:
Coinbase USD
Bitstamp USD
Bitfinex USD
Kraken USD
FTX USD
Binance USDT
Huobi USDT
This indicator is free, enjoy.

Scalping Strategy with SL and TP activation settingsThis strategy can be used on pretty much every timeframe that gives you a satisfying performance and will give you entries with a high probability of a winning trade.
Recommended are lower timeframes, because after all this is a scalping strategy and with that your chart wont be cluttered.
How to use this script?
Currently you can setup your positions SL and TP, because the markets vary in volatility it could improve the performance of the strategy.
You will simply get your signals and can decide to act upon them.
Stop loss: Simply your stop loss order which will trigger when price moves a given % away from your entry.
TP-Activation: When price reaches your % target it will trigger a stop limit order. So if price turns against your position after reaching your target it will close your position in profit and if it runs in your favoured direction it will trigger at a later stage.
Trailing-Offset-%: After reaching your % target it will trigger the TP order with an offset. So if you set your trailing offset to 0.1%, your TP order will be set behind 0.1 %. This can be used to test if the strategy would perform as well
if you leave more room for trades to play out.
Will this script make me profitable?
No strategy is a silver bullet and it depends mostly on you.
Trading is not easy and most people fail, because their risk management skills arent solid or they cant control their emotions.
This script will give you statistically often good entries, so even if you hit a losing streak your SL will protect you from losing more than necessary until you get a winning streak.
Patience and consistency is key to be profitable in the long run.
Does the script repaint?
Although you will get a notification when setting an alarm that the indicator may repaint, no security function is used and the signals will stay on the chart, because the signal is calculated based on the last candle close and will trigger with the next candle.
I am still looking into why that notification pops up.
You are free to try the indicator for a limited time to be sure.
My experience with the strategy
The overall statistical advantage is great. The strategy can be used simply as it is, but becomes better if you already have some experience with trading. Sometimes it will give you a good entry, reaches your target and the price still goes in your preferred direction. So your trading returns and experience could be improved with confluence, but it is totally fine as it is and if used right will help you get going.
Disclaimer: This is no financial advice. This is a tool and I am not responsible for your actions.
If you are interested in the indicator feel free to dm me on TradingView.

gold price levels denominated in usd/gramsPlots the gold price (USD) for the quantities (grams) identified as support or resistance in the indicator settings. Default values are:
75 gold grams
300 gold grams
500 gold grams
1000 gold grams
5000 gold grams
More context: The purchasing power of Bitcoin

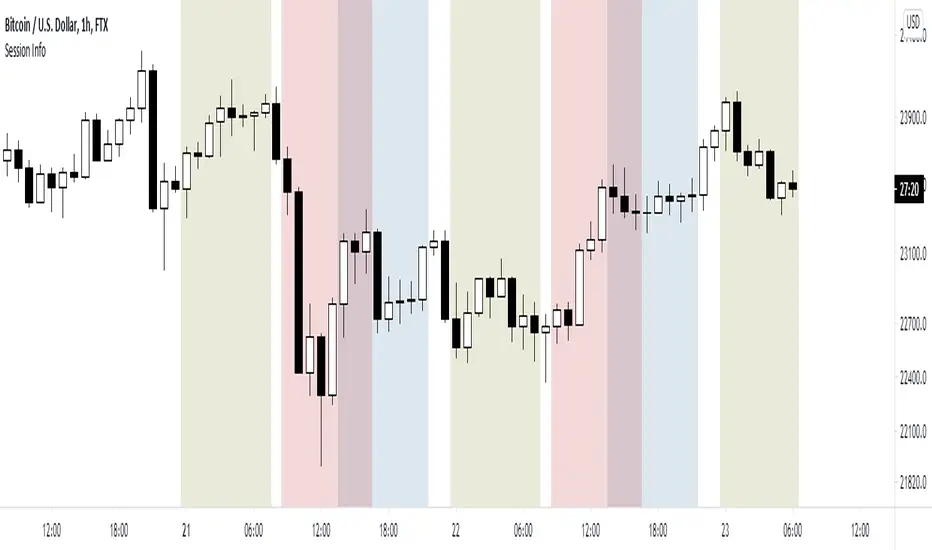
World market Session Information for bitcoinIt marks out different world markets active timings on the bitcoin charts.
You can also modify the script to a strategy and test out different strategies.
Finex PremiumBitfinex:BTCUSD premium/discount compared to market average spot exchanges.
Smoothed option available.

BTC On-Chain vs Exchange Volume ratioThis indicator compares on-chain transaction volume in BTC to spot exchange volume also denominated in BTC.
For the on-chain tx volume QUANDL data is used and for the exchange volume an aggregated index is made of some of the top spot exchanges.
Next a percentage ratio is made to give an idea of what type of volume is dominating.
Positive values (green) means on-chain volume is higher than exchange volume.
Negative values (red) means on-chain volume is lower than exchange volume.
These are the exchanges used for the spot index:
Binance USDT
Huobi USDT
Coinbase USD
Bitfinex USD
Bitstamp USD
Kraken USD
Bitflyer JPY
Bithumb KRW
Bittrex USDT
Poloniex USDT
In the settings you can choose to include or exclude certain exchanges.
There's also a smoothed moving average of which you can choose the length.
Because of limitations with the data you can only use this indicator on the daily time frame or higher.

Bitcoin Difficult Model [ChuckBanger]Simple script that graphically represents the mining difficulty of Bitcoin. It is ment to be used as a tool to decide when it is good time to dollar cost average (DCA) in your Bitcoin hodl position. When Price is below the difficulty model it is usually a good time to DCA.
Formula for the model used in this calculation is 0.002 * difficulty ^ 0.51. It is possible to change this numbers if necessarily.

Bitcoin Blockchain ToolkitA toolkit of all kinds of bitcoin market data, but mostly on-chain data.
In the settings you can select which metrics to show.
Metrics included:
Index: the BXBT spot dollar index
Mcap: bitcoin market cap data calculated by Tradingview
Dominance: bitcoin dominance vs altcoins
Volatility: the Bitmex BVOL volatility tracker
Hashrate: the bitcoin hashrate in giga hashes per second
Difficulty: how difficult it is for miners to find a hash
Miner revenue: bitcoins mined per day + transaction fees * market price
Cost per transaction: miner revenue divided by number of transactions
Transaction volume: total value of transaction output per day
Total transactions: unique transactions per day
Transaction fees: total BTC value of transactions per day
Unique addresses: number of unique addresses used per day

Quansium Series A BacktestThis comes with preconfigured setups or strategies. Simply choose one from our list based on the timeframe it was made for. Leverage can be changed; to keep trading safe, a maximum of 2 is allowed. In our findings, this was able to trade crypto (specifically BTC ), MES (Micro E-mini S&P 500 Index Futures ), and stocks. It is important to know that setups A, B, C, and D use variable position sizing, and dynamic stop loss/trailing stop/take profit, these parameters are provided through the alerts. The rest of the strategies were created with a simpler approach in mind, just plainly entry/exits signals.
Quansium as a framework:
Price reformat: we take the price source (Open, Close, High, Low) and remove any noise that affects the accuracy of our signals.
Time awareness: we take several time periods of the data on the chart such as start, end, and whole. We use this to add more depth to our signals.
Position size: our backtest tries to recreate as much as the real world trades as possible so our position is determined by the current equity. We also use the volatility of the market to increase or decrease our exposure or risk.
Risk awareness: stop loss, take profit, trailing stop are the risk exits we use to provide our users some peace of mind. These parameters are totally dynamic and follow the same behavior of the market.
Signals filtering: to make almost non-existent any errors and increase the quality of our trades, our indicators go through multiple phases, this avoid double entries or early exits, and help maintain a record of what has transpired and what’s currently taking place.
Indicators: whenever we can we use custom code or our own functions instead of the defaults ones provided. This gives us total control of what we’re trying to achieve. In many cases we tend to combine several indicators’ logic into one creating a more personalized take on it.
Easiness: since we started our main goal has been to provide the easiest and fastest way to alerts’ creation. It has taken us years to reach this level where now we already provide a list of preset strategies so the user doesn’t have to spend much time tinkering with scripts and more on other matters, because we know life is more than just trading.
Raw signals: we provide the option to turn off as much of our advanced features such as stop loss, take profit, trailing stop, dynamic sizing, etc, etc for a simple approach. Trade signals still go through the signals filtering method mentioned above,
Timeframe pairing: we take trading very seriously, by no way we’ll want the user to lose money (although such thing is expected because past results aren’t an indicative of futures ones), through years of experience we have found what are usually common mistakes the user makes, this feature allows us to only activate the strategy if the right timeframe is chosen.
Trend filters: through the years we have improved the arts of the trend. We like to keep things simple but yet powerful. We observe the macro and micro trend of the security. This helps confirm we are entering at the desirable timing. We also incorporate volume and volatility into decision making, we simply programmed it to trade when these are increasing and higher than the average values observed in both the short and long term. Finally we take into account the strength of the pair to make our final choice of whether to enter or wait, and if anything flashes contrary movement then we cancel the upcoming signal and stop monitoring until the next one comes along.
Full automated risk: stop loss, take profit, and trailing stops usually are set in percentages, and optimized even more using the current market behavior to become more adaptive. But always remains some sort of fixation, so the user must choose a value somewhere. This is where our framework shines the most, as previously mentioned before when we take time into our calculations, we use several periods to observe performance and get values that keep our risk exits natural and closest to the flow of the market itself.
Setups:
A: Centered oscillator with the difference of several moving averages with more sensitive settings. Momentum focused.
B: Centered oscillator using simple moving averages. Trend-Following focused.
C: Centered oscillator using smoothed data with the help of faster moving averages. Trend-Following focused.
D: Centered oscillator with the difference of several moving averages with less sensitive settings. Trend-Following focused.
E: Centered oscillator with the difference of moving averages where the standard deviation is applied first. It uses less sensitive settings. Trend-Following focused.
F: Finds the relationship between multiple readings of the price’s relative strength to better pin-point downs and ups. Trend-Following focused.
G: Centered oscillator with the difference of moving averages where the standard deviation is applied first. It uses more sensitive settings. Momentum focused.
H: Multiple centered oscillators using various moving averages. Trend-Following focused.
I: Centered oscillator using simple moving averages. Momentum focused.
Note: The framework is composed of almost 1000 lines of code as compared to each indicator that makes up the setup which is around 10. The power from Quansium doesn't come from the strategies themselves but rather the overall system that turns simple signals into complex and advanced trades.
Strategy Tester:
Initial Capital: chosen value is $20,000, as an approximate to Bitcoin’s ATH (All-Time High). In previous iterations we noticed some trades won’t go through if the capital was less than the ATH.
Order Size: 100% of equity (although the script controls this, and this is of no regards to the results).
Pyramiding: 1, system doesn’t place multiple entries in a row, only one at a time.
Commission: This simulates order execution with custom trading fees. Commissions are turned off by default because this script works in various markets and each operates differently. In order to reach results that are close to real world conditions, it is imperative the user fills this based upon their broker or exchange data.
When we started, we were focused on finding the best indicator, or creating it ourselves. After years we came to realize that the secret is not in which indicator you use but the framework behind it. All strategies have bad, good, best, worst performance periods. The key of a good system is to help keep you safe when it’s down and maximize your potential when it’s up. We hope this material at the very minimum inspires you to keep going and not lose faith, because it is not the smartest who win but those who persevere.

[MACLEN] HODL ZONE RENKO
PLEASE READ!
Trade at your own risk. Please read about renko charts before using this indicator. This indicator is for educational purposes only.
This Indicator is only valid in renko charts with 1 second timeframe. For BTCUSDT . With the traditional method and the size box of 80.
With this indicator we can detect zones of buy and sell. Even that is not recommended to use leverage, I use it to find an entry and use only small leverages. It could be also used to accumulate and HODL bitcoin .
Please, comment anything.
POR FAVOR LEER!
Tradea bajo tu propio riesgo. Por favor lee sobre las graficas renko antes de usar este indicador. Este indicador es solamente con fines educativos.
Este indicador es válido solamente en graficas renko con un timeframe de 1 segundo. Para BTCUSDT . Con cajas del método tradicional de un tamaño de 80.
Con este indicador podemos detectar zonas de compra y venta. A pesar de que no es recomendable usar apalancamiento, yo lo uso para encontrar entradas y solo uso apalancamientos pequeños. También podría usarse para acumular y holdear bitcoin .
Por favor, escríbeme cualquier duda o comentario.

BTC Aggregated Perps OBVAggregated on balance volume of the most relevant bitcoin perpetual swap contracts.
There's also an option to select which markets you want to include or exclude.
Complete list:
Binance USD
Binance USDT
Okex USD
Okex USDT
Bybit USD
Bybit USDT
Huobi USD
Bitmex XBT
FTX USD
Deribit USD
Kraken XBT

BTC Aggregated Spot OBVAggregated on balance volume of the most relevant bitcoin spot markets.
There's also an option to select which markets you want to include or exclude.
Complete list:
Binance USDT
Huobi USDT
Okex USDT
Poloniex USDT
Coinbase USD
Bitstamp USD
Bitfinex USD
Kraken USD
Gemini USD
FTX USD

BTC Aggregated Perps VolumeAggregated volume for the most relevant bitcoin perpetual swap contracts, denominated in US dollars.
There's also an option to select which markets you want to include or exclude.
Complete list:
Binance USD
Binance USDT
Okex USD
Okex USDT
Bybit USD
Bybit USDT
Huobi USD
Bitmex XBT
FTX USD
Deribit USD
Kraken XBT

BTC Aggregated Spot VolumeAggregated volume of the most relevant bitcoin spot markets.
There's also an option to select which markets you want to include or exclude.
Complete list:
Binance USDT
Binance BUSD
Coinbase USD
Coinbase EUR
Bitstamp USD
Bitstamp EUR
Kraken USD
Kraken EUR
Bitfinex USD
Gemini USD
Huobi USDT
Okex USDT
Bitflyer JPY
Bithumb KRW
FTX USD
CME
Grayscale

BTC Bitfinex USD L/S RatioThe Bitfinex USD long / short ratio.
Values above 1 means there're more longs than shorts.

BTC Spot Volume DominanceThis shows the relative dominance of spot volume compared to the volume of perpetual swaps.
Derivatives volume is always a lot higher than spot volume, so a relative ratio is made to compare.
The higher the ratio the more dominant spot markets are. Spot dominance during rallies is considered bullish.

BTC Futures ContangoThis indicator allows you to compare two futures contracts to the Bitmex XBT/USD perpetual swap contract.
There's an option in the settings to use a different chart as a reference.
It shows percentage-wise whether the futures are in contango or in backwardation.
Bullish and bearish warning signs are given at specific percentages. These can be customized.

BTC Bitmex Index PremiumThe price difference between the last price of the Bitmex XBT/USD perpetual swap contract and the BXBT spot bitcoin dollar index.
Positive values (green) means the BXBT index is trading at a premium, which is considered bullish.
Negative values (red) means the BXBT index is trading at a discount, which is considered bearish.
