BTC Perp Volume Per ExchangeBitcoin aggregated derivatives volume in stacked format or indexed format and denominated in USD.
This allows you to look at total volume of perpetual swap contracts and compare volume of different exchanges.
The indexed format makes it easier to look at the ratio of volume share of each exchange.
Markets included are:
Binance USDT
Huobi USD
Bybit USD
Bitmex XBT
FTX USD
Deribit USD
Phemex USD
Keep in mind that the Binance and FTX perps are dollar margined contracts. All the other ones are inverse contracts (coin margin).
In the settings you can exclude certain exchanges, but only do this in the "input" section and NOT in the "style" section.
If you get rid of markets in the style section it'll mess with the calculation and the data will be incorrect.
It's free so just add this indicator to your favourites.
Cheers.
Bitcoin (Criptovaluta)

BTC Spot Volume Per ExchangeBitcoin aggregated spot volume in stacked format or indexed format and denominated in USD.
This allows you to look at total volume and compare volume of different exchanges.
The indexed format makes it easier to look at the ratio of volume share of each exchange.
Markets included are:
Binance USDT
Okex USDT
Huobi USDT
Coinbase USD
Bitfinex USD
Bitstamp USD
FTX USD
In the settings you can exclude certain exchanges, but only do this in the "input" section and NOT in the "style" section.
If you get rid of markets in the style section it'll mess with the calculation and the data will be incorrect.
It's free so just add this indicator to your favourites.
Cheers.

Companion::InsurgentCompanion::Insurgent is a combined indicators strategy. Performances are pretty good on 1D, 4H and 1H timeframes and it can be used on Bitcoin and Altcoin markets.
Mainly, it is a trategy based on Ehlers formulas.
Used indicators:
- Ehlers Instantaneous Trend: trendline analysis;
- Ehlers Super Bandpass Filter: momentum detection;
- EMA: Long/Short time selector.
What the script does:
- determines trendlines combining mulitple indicators;
- automaticlally calculates Take profit and Stop Loss levels;
- permits automation generating Autoview signals (create an alert with {{strategy.order.alert_message}} in message text field to trap Autoview commands;
- supports for margin trading. Spot trading will be added in the future.
BACKTESTING
Backtest is not leveraged. Defaults are set as follow:
Capital: 10000
Percent of equity used for trades: 10%
Commission: 0.18% this is Bitfinex commission on orders
Change them accordingly on how you trade to get a more realistic backtest results.

NYCOB Kill Zone StrategyI have now turned the NYCOB Kill zone into a stand alone strategy!
Fully customizable in regards to time of entry and levels of entry but the standard settings are the best all around.
Original NYCOB Kill Zone text below
This script plots the H and L of the first 2 hours of the NYC session and shades the space between in which i deem the NYC Order Block
It also maps out the First two hours on the chart as well so you can understand when the OB has formed
Over the past 3 years of trading cryptocurrency i have noticed a phenomena that has occurred nearly every day
The H or L will 90% of the time will be posted in the first two hours of this session
knowing this means you understand if you just wait til this time you can better your odds at not getting stop hunted due to poor entry
A few things to take from this study are these.
1. after the OB is formed
2. whichever side gets taken out first (H/L) will 90% define the bias for the day. I have found that using the m13-m15 TF will add some more confirmation with 1-2 closes outside of range H/L/
3. After general bias has formed 2 things can happen
A) PA just takes off and there is really nothing you can do about it unless you had other studies that told you that will happen
B) PA will dip back INTO the OB and create the OTE which is any retracement below the .5 Fibonacci of the shaded OB
4. Typically OTE happens after the session has ended
5. If you used OTE off of the past days NYCOB then you can use the new (forming or just formed) NYCOB to CONFIRM your initial bias presented from the previous days OTE and bias.
6. When PA cannot close outside the NYCOB it presents a range to range play where PA will visit the opposite side of the range to chase liquidity,
7. When the NYCOB is TIGHT then deviation is more likely to result in price expansion, when the NYCOB is WIDE then deviation tends to present more range to range plays.
8. After bias is formed and OTE has been made your stops should always be outside the NYCOB. I use the m30 or H1 ATR to get a slight cushion from the OB to ensure i dont get stop hunted.
Standard TP are all set at the same level but you can adjust them accordingly
Shout out to Elevate-Trading family member Boederzeng for helping me with the code!

Heikin Ashi+RSI+EMA Strategy 2.0 v4 [Cryptocurrency] by GodtrixHi,
I know a lot of people are looking for a more sophisticated and customizable strategy tool, I'm facing the same problem too, so I created one for myself and decided to share it for free trials and if you think this tool do what you wanted, you can contact me for the subscription "Premium" version.
I'll keep it simple with point forms, if you have any further inquiries or questions, please feel free to message me. Thank you.
Best profit plan with this strategy is you trade on Future leverage while you hold on to your coin, so that when price goes up, your coin value goes up, and at the same time, you trade with your leverage to earn even more, easily doubling up your total profit.
Benefits:
Fully customizable and you can easily personalized it and FINE TUNE it according to the market or coin you trading on.
The strategy is based on REAL PRACTICAL trading skills, so it works in real-world.
I fixed the "repainting" issue so the backtest it shows you IS ACCURATE when you run for real-time.
We all know one indicator is not going to help you win your trades, so this strategy combines ALL three: EMA for long+short term trend, HA for short term trend, RSI for entry/exit
This strategy is designed for LONG trade (Buy low, Sell high), not for SHORT trade.
This is not day trading, it is more to mid-term trading, where there's only few trades per month
Mainly is coded to work with 3Commas bot auto trading, so you only need to key in your Bot ID & Email Token.
Bot trading NOTE:
You need to replace the Alert Message with this: {{strategy.order.alert_message}}
One Alert will work for both Buy and Sell Order
If you using other Bot service, you can enter Custom Command too, so it works on any bot service.
Lastly,
regarding the setting advice, I would say you try playing with different settings and your objective is to achieve a backtest result that has:
1) Profitable is > 80%
2) Losing trades is nearly 0 or below 25% of your winning trades. Trick is using far stop loss %
3) Net Profit be almost same or more than "Buy & Hold Profit"
If you interested in our subscription version, message me for price.
Best Luck & a million dollar profit to you,
Godtrix BITSTAMP:BTCUSD BINANCE:DOTUSDT

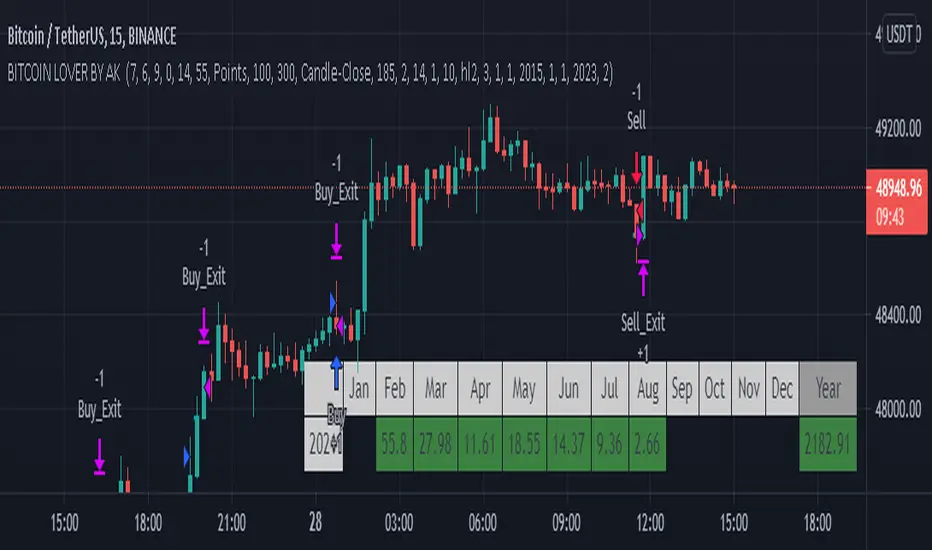
Bitcoin lover by Akthis strategy used to determine and anticipate potential changes in market price and reversals. The Highs referred to in the title are created based on the number of bars that exhibit lower highs on either side of a High, whereas the Lows are created based on the number of bars that exhibit higher lows on either side Low.it also analyzing price changes and reversals, a trader has more of an ability to determine and predict price patterns and general price trends...It take profit on pre define 500 points.. u can also change is take profit level. .and also added max intraday trades..so it help in risk management
brokerage added 0.02% and slippage added 20.
How it works??
It calculate swing on 5min chart.. When swing high is break it shows buy signal and when swing low is break it show sell signal.. And it book profit on 500 points.. U can also change profit points. .After booking profit if high or low of price break it again show buy and sell signal.. U can also use it with trend lines and moving average for better entry and exits..
I hope this will help trader for find out trends and profit booking and if u want to use it with comment strategy action you have to just add comment in comment box
caution: always follow risk management before using strategy
(D7R) Deribit Bitcoin FuturesDeribit Contract Futures Price with 3 different value display modes. (Percentage, Delta, Absolute).
This information can be used to understand when futures are trading at relative strong premium or discount against each other.
This information can either be used for hedging or price speculation when difference between contracts offer that arbitrage.

Williams Alligator + RSI + T3CCIWilliams Alligator strategy is based on indicator developed by a legendary trader Bill Williams, an early pioneer of market psychology.
The strategy is based on a trend-following Alligator indicator, which follows the premise that financial markets and individual securities trend just 15% to 30% of the time while grinding through sideways ranges the other 70% to 85% of the time. Williams believed that individuals and institutions tend to collect most of their profits during strongly trending periods.
Although Alligator is a very strong tool it has a lot of weak signals and has lag span on entries and exits. We added RSI oscillator and T3CCI to clear market noises and weak signals. Moreover the approach we intoduced to the indicator allows to enter positions and close them earlier than orginal indicator which ensures stronger signals
The strategy supports traditional and cryptocurrency spot, futures, options and marginal trading exchanges. It works accurately with BTC, USD, USDT, ETH and BNB quote currencies. Best to use with 1D timeframe charts
The strategy can be and should be configured for each particular asset. You can change filters and risk management settings to receive the most advanced accurate alerts
Advantages of this script:
Good for long and Short positions
Produces strong long-term entries and closures of positions
Stable to short-term market fluctutions
Easy configuration with a user friendly interface
Backtests show high accuracy around 85.71%
High Net Profit percentage around 21.26%
High profit factor around 82.403
How to use?
1. Apply strategy to the trading pair your are interested in at 1D timeframe chart
2. Configure the strategy: change filters values and risk management settings until Strategy tester shows good results according to mathematical expectation
3. Set up a TradingView alert to trigger when strategy conditions are met
4. Strategy will send alerts when to enter and when to exit positions
Feel free to copy and use this script for your ideas and trading!

ATR + %R Scalping StrategyThe Average True Range is a single line indicator that measures volatility. The indicator was originally developed by J. Welles Wilder to measure the volatility of commodities within the futures market.
ATR does not measure price trends or price direction hence %R and Parabolic SAR indicators were added.
The strategy enhances standard Average True Range and %R composition with trend confirmation and filters which clear out market noises and manipulations from triggers.
The strategy supports traditional and cryptocurrency spot, futures, options and marginal trading exchanges. It works accurately with BTC, USD, USDT, ETH and BNB quote currencies. Best to use with 5 and 15 minutes timeframe charts and Limit orders.
The strategy can be and should be configured for each particular asset. You can change filters and risk management settings to receive the most advanced accurate alerts
Advantages of this script:
Strategy has high profit factor around 30.32
Backtests show high accuracy around 91.18%
High Net Profit percentage
Low Drawdowns
Weak signals are filtered
Dynamic Take profit and Stop loss
Fast deals around 50 minutes per trade
Can be applied to any market and quote currency
Easy to configure user interface
How to use?
1. Apply strategy to the trading pair your are interested in at 5m or 15m timeframe chart
2. Configure the strategy: change filters values and risk management settings until Strategy tester shows good results according to mathematical expectation
3. Set up a TradingView alert to trigger when strategy conditions are met
4. Strategy will send alerts when to enter and when to exit positions

Sharktank - Pi Cycle PredictionThe Pi Cycle indicator has called tops in Bitcoin quite accurately. Assuming history repeats itself, knowledge about when it might happen again could benefit you.
The indicator is fairly simple:
- A daily moving average of 350 ("long_ma" in script)
- A daily moving average of 111 ("short_ma" in script)
The value of the long moving average is multiplied by two. This way the longer moving average appears above the shorter one.
When the shorter one (orange colored) crosses above the longer (green colored) one, it could mean the top is in.
These moving averages rise at a certain rate. Using these rates we could try to estimate a possible crossover moment. That's exactly what this indicator does! It gives the user a prediction of when a crossover might happen.
Special thanks to:
- Ninorigo, for making his indicator public. This one uses his as a starting point.
- The_Caretaker, for coming up with this idea about calling a top. Yet, his is more price-based, this one is more time-based.

Multi Moving Average Crossing (by Coinrule)Moving Averages are among the most common trading indicators. They are straightforward to interpret and effective to use.
One of the limitations of using moving averages is they can provide buy and sell signals with a relatively high lag , making it very difficult to spot the lows and tops of the trend.
Moving averages calculated with a low number of periods like the MA9 (the average of the previous nine price periods) react very fast to price moves providing prompt signals. On the other side, more signals may end up with more false-signals and more trades in a loss.
On the contrary, moving averages calculated with a higher number of periods like the MA100 (which considers the previous one hundred price periods) give more reliable signals, but with a delay.
A system catching the crossing of the MA50 over the MA100 is a good compromise for successful long-term strategies. It provides, on average, reliable buy signals.
The Multi Moving Average Crossing Strategy tries to optimize the exit without waiting for the same opposite crossing (MA50 below MA100). It uses the MA9 crossing below the MA50, instead, to spot a better time for selling.
The setup is as follows.
BUY when the Moving Average 50 crosses above the Moving Average 100
SELL when the Moving Average 9 crosses below the Moving Average 50
The higher is the time frame to calculate the Moving Averages, the better is the overall performance of the strategy. The 4-hour (or 6-hour) time frame seems to be the best, even if it results in fewer trades. If you want to trade more still with good results, the 1-hour time is a good compromise.
Advantages of the strategy
This strategy seeks to catch those that are more likely relevant uptrends and close the trade relatively quickly. More trades mean more opportunities. This is especially effective if you run the strategy on all the available coins on the market, as you could do with Coinrule.
Generally, a Multi Moving Averages approach beats the classic crossing strategy involving only two Moving Averages. We backtested a sample of twenty trading pairs to assess the benefits empirically.
The results show that the Multi Moving Average Strategy
outperforms 13 out of 20 times
has 95% higher average return
has 67% higher median return
The strategy assumes each order to trade 30% of the available capital and opens a trade at a time. A trading fee of 0.1% is taken into account.

Cryptos Relative Strength Oscillator
This is an oscillator made of biggest 40 cryptocurrency/USDT pairs.
* It shows relative strength and change of crypto market during certain time on given interval.
* The tool has a bunch of data put together into one oscillator:
* top and bottom lines are made of 3 strongest and 3 weakest crypto pairs (out of 40)
* has visible names of that pairs for several candles back (it cannot show more due to TV's Pine limitations)
* in settings you can set up 2 methods of calculations:
1) % change from SMA of price, default is SMA 5
2) % changes from x-candles back, to see that change from the last candle please turn of 'Moving Average' and set up 'Bars Back' to 1
* you can change source to close/hl2/ohlc2/etc
Notice 1:
- to have nicer visibility of whole oscillator make it bigger part of whole screen then you normally use for other oscillators
Notice 2:
- scroll your mouse to widen the horizontal axis, so names of certain crypto pairs will be more readable
Notice 3:
- script has 40 Pine security functions (to gather all the data from all pairs) so it can load up to several seconds
- also every change in settings will possibly result in longer loading time
ps. This script is invite-only for the members of our trading group (info in signature, group is free of charge).

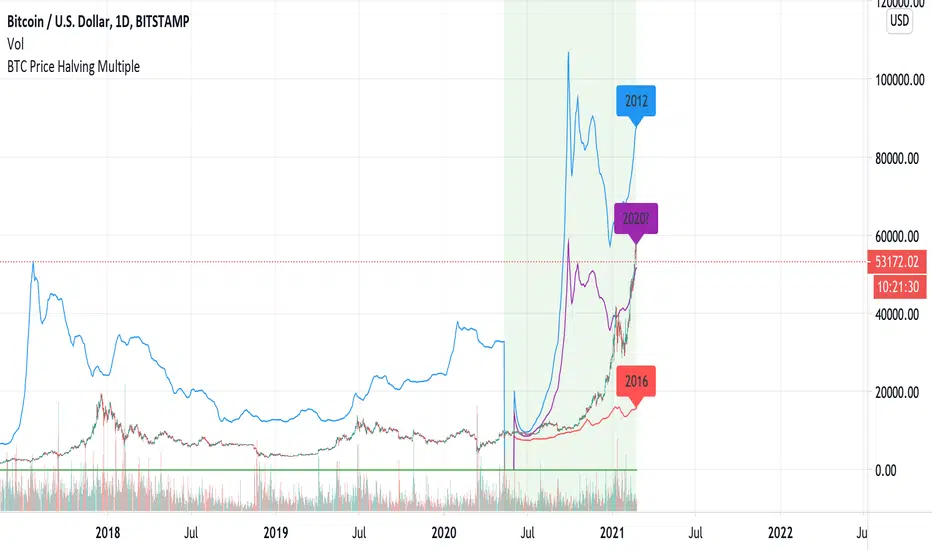
MA Multiplier with FibonacciThis implementation of the "2-Year MA Multiplier" gives you some control over the indicator, you can change the multiplier from it's default of 5, you can change the lookback from it's default of 730 days and I've also added three fibonacci traces between the moving average and it's multiple that you can play with. Oh and you can also choose the data source ('close' or 'hl2' make most sense).
The formula for this indicator was created by Philip Swift.
Thanks to @Pladizow for pointing me to this indicator.

MA200W buy sell BTC ColoredA script to help you plan your entrances and exits with beautiful colors for BTC. It just helps to better highlight the gap between the start of the week and the end.
It only work on Weekly.
Info :
Blue ... you can wait, enjoy your life
Green is when you buy
Yellow when you enter bull market
Orange is when you begin to take care of next week
Red when you begin to sell low part
White, if while a week you see white you can sell bigs bags, if it end with White you can close majors positions
Warning White may not appear, if second week after first Red week is not White you can sell large position
Good luck and take a breath

Scalping using RSI 2 indicator with TSLThis strategy implements a simply scalping using the RSI (calculated on two periods), the slopes of two MAs ( EMA or SMA ) having different lengths (by default, I use 50 and 200).
A trailing stop loss (%) is used.
Entry conditions:
.) Fast MA > Slow MA and Price > Slow MA and RSI < Oversold Threshold ------> go Long
.) Fast MA < Slow MA and Price < Slow MA and RSI > Overbought Threshold ------> go Short
Exit conditions:
.) Long entry condition is true and (close >= TP or close <= TSL ) ----> close short position
.) Short entry condition is true and (close <= TP or close >= TSL ) ----> close long position
The strategy performed best on Bitcoin and the most liquid and capitalized Altcoins but works excellent on volatile assets, mainly if they often go trending.
Works best on 3h - 4h time frame.
There's also an optional Volatility filter, which opens the position only if the difference between the two slopes is more than a specific value, which can be set in the study inputs. The purpose is not opening positions if the price goes sideways and the noise is way > than the signal.
Note:
.) the RSI length is 2;
.) the oversold Threshold is 90%;
.) the overbought Threshold is 10%;
.) by default, the trailing stop loss per cent is 1%;
.) by default, the fast MA length is 50;
.) by default, the slow MA length is 200;
.) by default, the MA used is EMA.
Cheers.

RSI Classic Strategy (by Coinrule)One of the questions hobbyist traders more often ask is: what is the perfect trading indicator?
Every indicator is just a tool, so its efficiency is proportional to your ability to read its signals and translate them into an actionable trading strategy. The RSI is likely the most flexible and easy to use among the technical indicators.
This trading strategy tries to catch short-term swings on the coins of your choice with a simple yet profitable setup.
Buy when the RSI is lower than 30 (you can adjust it to 35 in times of steep uptrend).
Sell when the RSI is greater than 65 (the target may range between 60 and 75 depending on the volatility of the coin).
Note that the buy signal comes when the indicator crosses below 30 and not when it crosses above 30 as it happens on the built-in RSI strategy on Tradingview.
The present script overperforms the built-in strategy, even adding trading fees and using a lower amount of capital for each trade (30%). That means that the system can deliver higher net-profits with lower risk levels.
A typical example of market conditions where this strategy works perfectly is as follows.
The first initial breakout indicates that a new leg up in the trend may start. Bitcoin starts to trade within a range which you can identify when it reaches the point 3. That is the perfect time to start the rule because
- trading within a channel anticipates possible swings up and down
- the trend is on the upside, providing low downside risk in buying the dips.
This strategy works well with selected coins of your choice, and it's a great fit on leverage exchanges like Binance Futures.
If you prefer to run it across all available coins on the market, instead, you may choose an optimized version.

Arbitrage Sniper (POC)Good Morning Traders!
Today I want to share with you the proof-of-concept of how you would be able to do arbitrage with crypto pairs.
THE INDICATOR MUST BE PLACED ON THE TRADING PAIR OF THE TWO CURRENCIES (i.e. ETH/BTC, EOS/ETH etc.)
This arbitrage method is based on the transitional decorrelation between the crypto treding pair and the price ratio of the involved currencies, of course computing commissions as well.
Whenever the non-arbitrage condition is not respected, there is an arbitrage oportunity.
This indicator won't consider the chance of shorting, so if the arbitrage oportunity occurs the indicator will suggest you just the chance of buying the relative-undervalued currency (but inside the code you will know how to do the alternative method as well, by shorting the relative-overvalued currency)
Let's take the trading pair ETH/BTC (as in the graph) → if we assume commissions for the 0.075% of the order, the non-arbitrage condition will be presented like this
This arbitrage method will need three orders, so n=3
So let's assume that P(ETH)/(P(BTC)*P(ETH/BTC))>(1-0.075)^(-3) → it means that the price of Ethereum is currently overreated enough (relatively to the trading pair) for doing arbitrage.
We have two alternatives:
• Buy BTC, change it into ETH (by "buying" ETH in the trading pair ETH/BTC) and then sell ETH
• Sell ETH, buy BTC, change it into ETH (by "buying" ETH in the trading pair ETH/BTC)
On the other hand, if P(ETH)/(P(BTC)*P(ETH/BTC))<(1-0.075)^(-3) → it means that the price of Ethereum is currently underrared enough (relatively to the trading pair) for doing arbitrage.
We have two alternatives:
• Buy ETH, change it into BTC (by "selling" ETH in the trading pair ETH/BTC) and then sell BTC
• Sell BTC, buy ETH, change it into BTC (by "selling" ETH in the trading pair ETH/BTC)
I'm saying that is nothing more than a proof-of-concept since:
- Arbitrage Oportunities will emerge frequently just nearly zero commissions
- Data of prices are retrieved using security() function and there can be some delay (so the arbitrage oportunity will be already extinguished by the time the signal is retrieved)
- In order to have the freshest data, repiainting will occurr

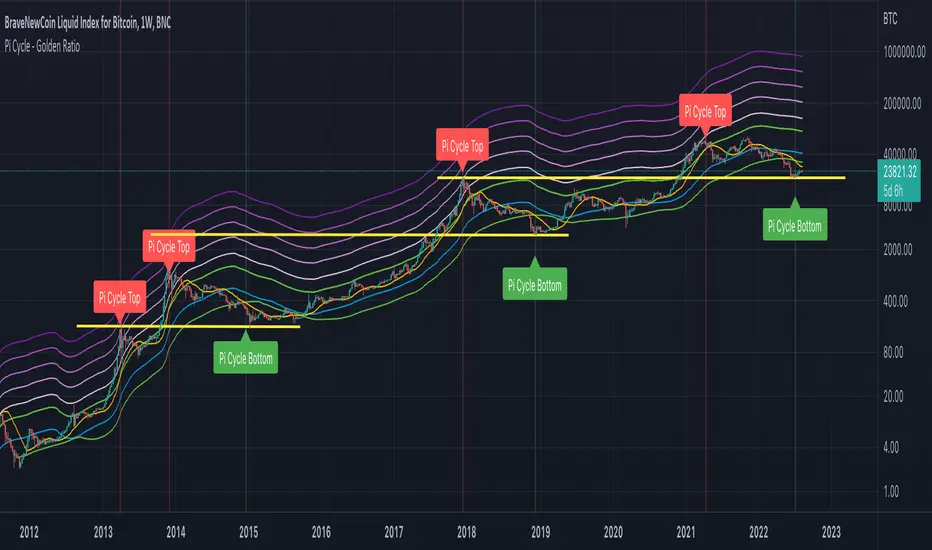
CryptoSignalScanner - Pi Cycle - Golden Ratio MultiplierDESCRIPTION:
All credits are going to Philip Swift who has written an article on Medium about the PI Cycle Top and The Golden Ratio Multiplier .
Based on the article this indicator has been created to display and indicate the Bitcoin PI Cycle Top which has historically been effective in picking out the market cycle highs within 3 days. It also displays the Golden Ratio Multiplier which explores Bitcoin's adoption curve and market cycles.
• The PI Cycle Top is based on the 350DMA (Daily Moving Average) multiplied by 2 and the 111DMA (Daily Moving Average)
• The Golden Ratio Multiplier is based on the 350DMA (Daily Moving Average) the The Golden Ratio which is defines as 350DMA * 1.61803398875 and the Fibonacci Sequence which is defined as 350DMA * 2, 350DMA * 3, 350DMA * 5, 350DMA * 8, 350DMA * 13 and 350DMA * 21
HOW TO USE:
• The PI Cycle Top is picking the market cycle tops within 3 days.
When the 350DMA x2 crosses below the 111DMA Bitcoin price peaks in its market cycle. This indicates that the market is overbought and it is time to take profit.
• The Golden Ratio Multiplier pics the top on every market cycle in Bitcoin’s history and forecasts when Bitcoin will top in the coming market cycle.
In 2011 the top was at 350DMA * 21
In 2013 the top was at 350DMA * 13
In 2014 the top was at 350DMA * 8
In 2018 the top was at 350DMA * 5
If we look at the results above the forecast for next top should be at 350DMA * 3
FEATURES:
• You can change the Long Moving Average which is by default 350
• You can change the Short Moving Average which is by default 111
• You can show/hide the Pi Cycle Top labels
• You can show/hide the Pi Cycle Bottom labels
• You can show/hide the Pi Cycle Moving Averages
• You can show/hide the Golden Ratio
• You can show/hide the Fibonacci Sequence
• You can set an alert when the Pi Cycle Top is reached
REMARKS:
• This advice is NOT financial advice.
• We do not provide personal investment advice and we are not a qualified licensed investment advisor.
• All information found here, including any ideas, opinions, views, predictions, forecasts, commentaries, suggestions, or stock picks, expressed or implied herein, are for informational, entertainment or educational purposes only and should not be construed as personal investment advice.
• We will not and cannot be held liable for any actions you take as a result of anything you read here.
• We only provide this information to help you make a better decision.
• While the information provided is believed to be accurate, it may include errors or inaccuracies.
HOW TO GET ACCESS TO THE SCRIPT:
• Access to this script is free of charge
• You can drop me a message to get access to the script
Good Luck,
SEOCO
Adaptive RSI and MACDHello guys,
this script provides a adaptive version of the RSI and MACD. Also you can check in the settings for the long-short-ratio of bitcoin and ethereum.
The indicator is adaptive, because it looks at historic price action of a specific period to define, wether the trend is bullish or bearish and therefore adapts the values.
What you need to look out for:
- MACD crosses, highs (top area) and lows (lower area)
- RSI divergences (e.g. adaptive rsi falls and price goes higher)
- long-short divergences (e.g. long-short ratio rises and price goes down)
- if macd or rsi is above the middle line, the trend is rising and other way around
Let me know, what you've been thinking bout the script :-)

Binance Z VolumeBTC perpetual volume on Binance is about 4x spot volume.
Comparing spot and perpetual volumes could provide useful insights into market sentiment.
Abnormal increases in the spot market could be associated with accumulation. Abnormal increases in the perpetual market, on the other hand, could predict volatility as well lows and highs.
This script represents a Z-score of the volume of perpetual and 4xspot on Binance.
High values above 0 mean that the volume is skewed towards perpetual contracts. Values below 0 mean that the volume is skewed towards spot contracts.
Feel free to suggest changes and improvements of this script.
Translated with www.DeepL.com (free version)
BIO

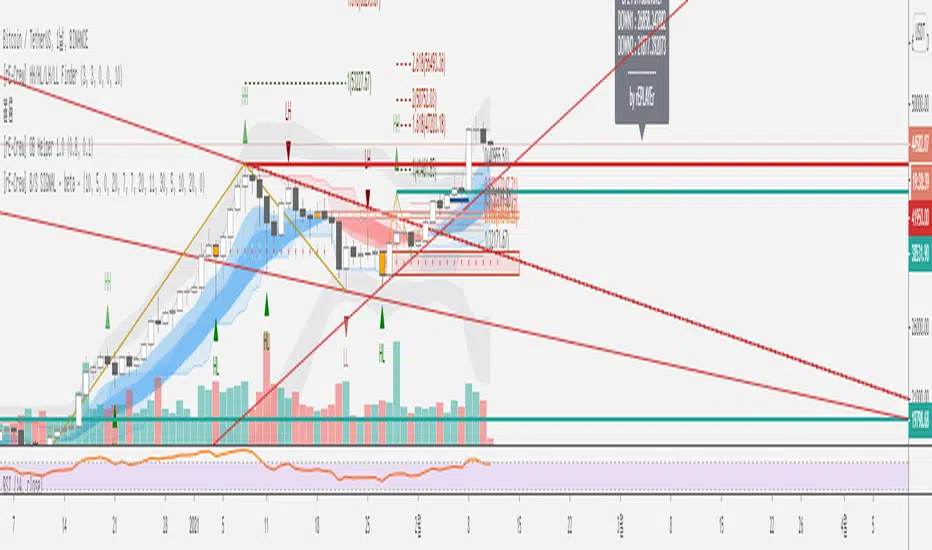
[rE-Crew] HH/HL/LH/LL Finder Open versionMy English is poor.
So I ask for your understanding.
You can find HH/HL/LH/LL using this indicator
HH : Higher High
HL : Higher Low
LH : Lower High
LL : Lower Low
This indicator is useful for Dow-Theory.
enjoy :)
이 지표는 HH/HL/LH/LL 을 찾아주는 지표입니다.
다우 이론에 유용하게 쓰여질 수 있습니다.
영어를 잘못하니 이해해주시면 감사하겠습니다 ^^;
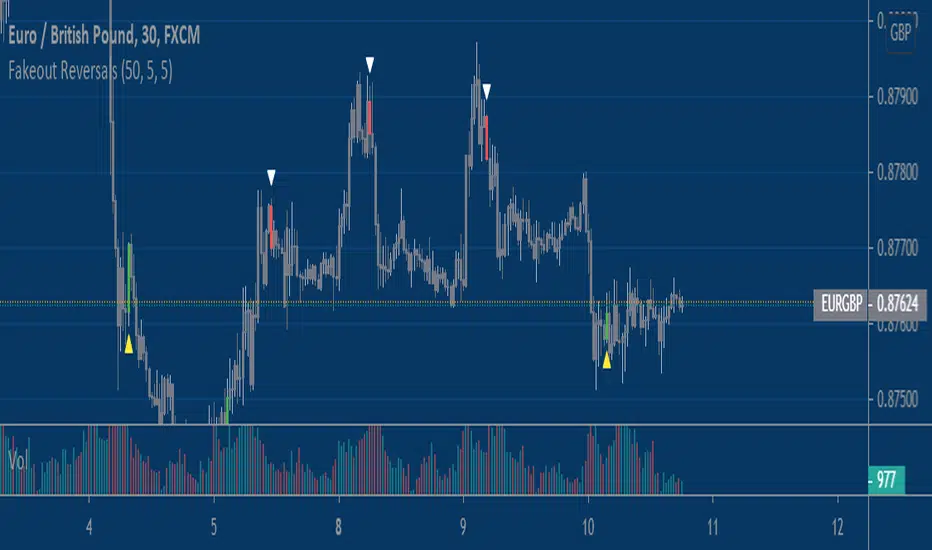
Fake-out ReversalsThis script combines two simple concepts, stop running and short term momentum, into a simple visual signal that can be applied to any market and any timeframe with some adjustment. It looks for price to violate a prior extreme within a certain lookback window, followed by price triggering a momentum filter that helps put the proverbial 'wind at your back' for the user. Users have the ability to customize three inputs; 1) Bars used to calculate price extremes 2)Bars since price violated that extreme 3)The sensitivity of the momentum filter.
You will find that these signals work best in choppy and rangebound price action, less so in trending/grinding markets. For entertainment/educational purposes only.
Enjoy!