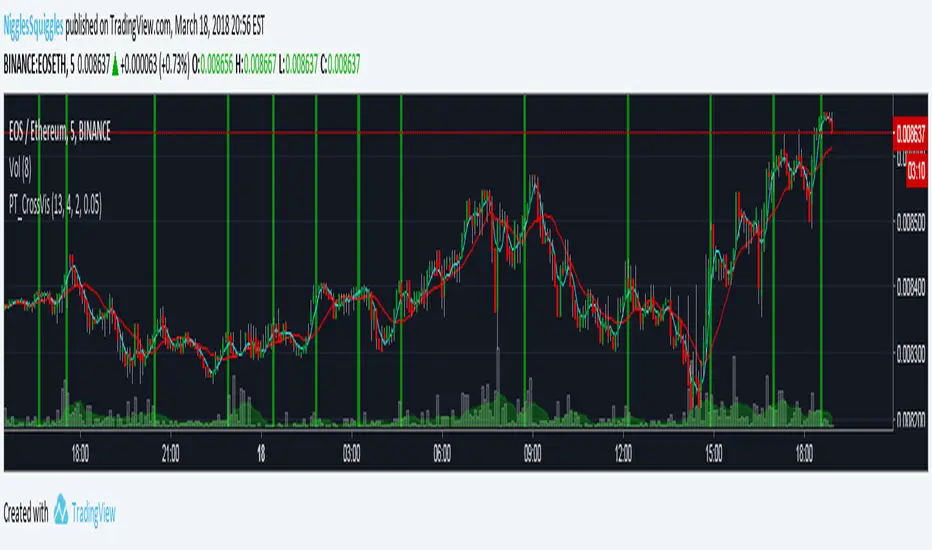
PT_MA Cross VisualiserThis indicator is designed for use with Profit Trailer's CROSS strategies.
The user can select either EMA or SMA averages and input their own buy value settings.
Cerca negli script per "profit"
PT_MA_GAIN_VisualiserThis indicator is designed for use with Profit Trailer's GAIN strategies.
The user can select either EMA or SMA averages and input their own buy value settings.
It incorporates trailing values, either manual trailing values or automatically calculated values based on volatility.

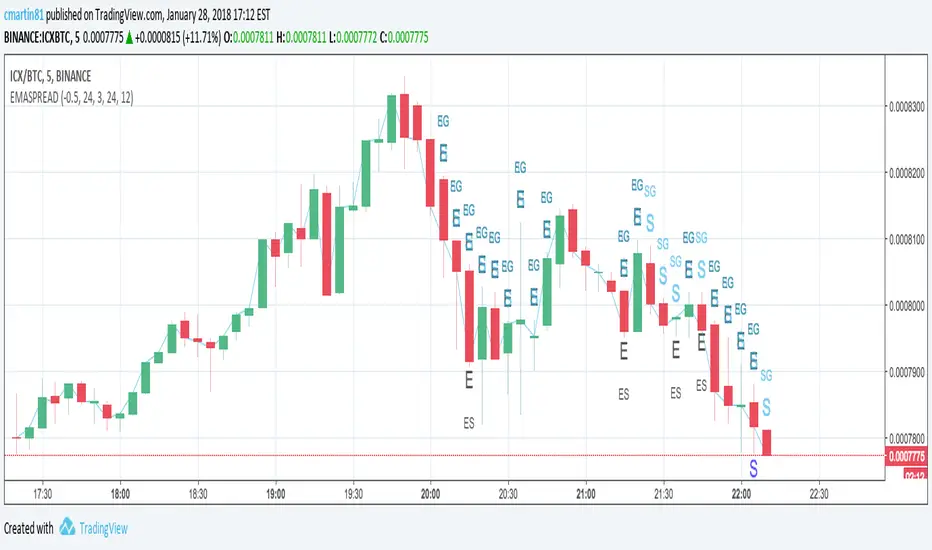
PT_maSpreadThis indicator is designed for use with Profit Trailer's SPREAD strategies.
The user can select either EMA or SMA averages and input their own buy value settings.
It incorporates trailing values, either manual trailing values or automatically calculated values based on volatility.

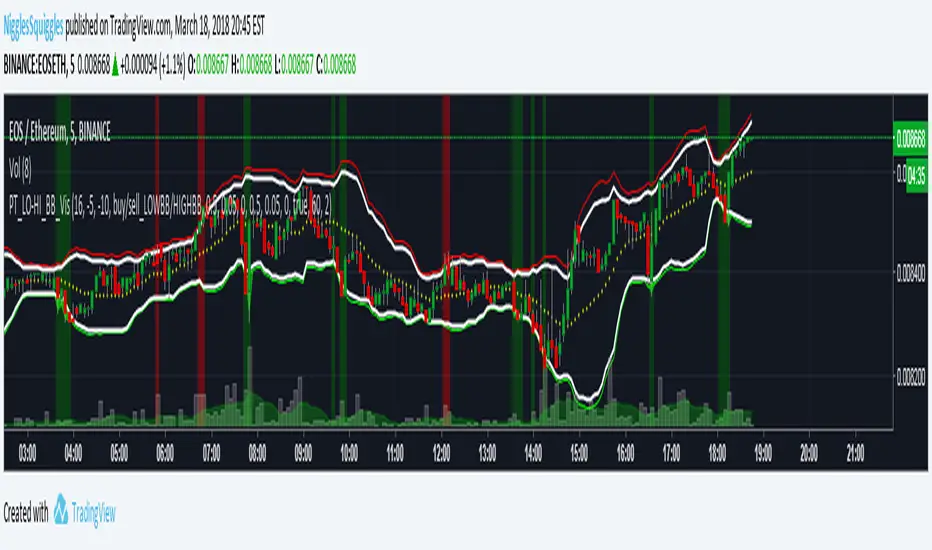
PT_LOW-HIGH BB VisualiserThis Bollinger Band indicator is customised for use with Profit Trailer.
It incorporates the various strategies (High BB, Low BB) and allows you to plot out your buy and sell values to see where your targets relate to price.
It incorporates trailing values, either manual trailing values or automatically calculated values based on volatility.
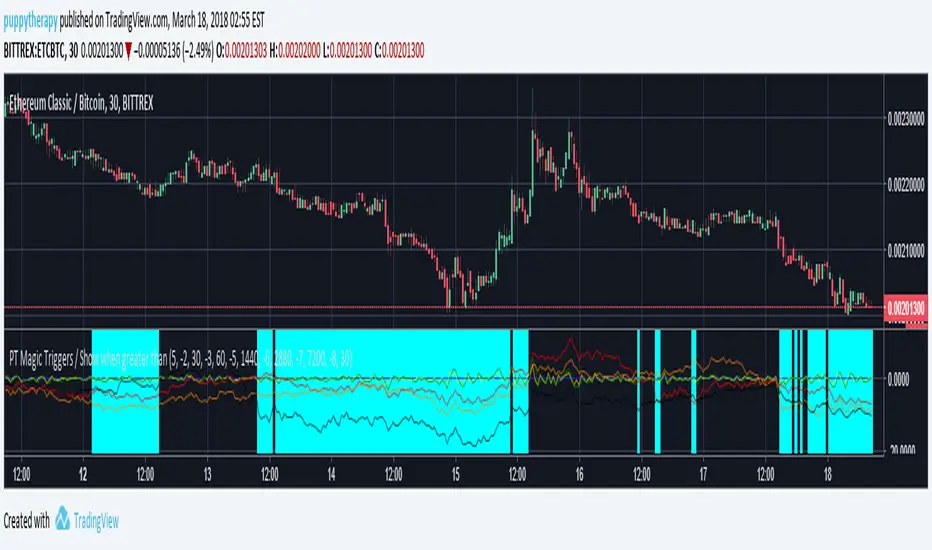
PT Magic Triggers - When smaller than Trend Value ( SOM )PTM Script for Profit trailer if you dont know what it is dont read :)
I just wanted to roll this out ASAP there will be no detailed description.
If the value is smaller then your defined Trend value it will make the background aqua.( Basically you want to be defensive in those areas ) Multiple logical conditions OR /AND combined are beeing worked on.
If questions i will try to answer them here in hour build factory discord.
discord.gg
HighLowPricePercentage of ProfitTrailer Feeder offset criteriaThis is to check the distance/difference of the current price from the norm and is over the MinutesToMeasureTrend time window or LongTermMinutesToMeasureTrend.
You need to put the values in your appsetting and time interval of candle chart.
Default is 120 minute of MinutesToMeasureTrend value and 720 minute of LongTermMinutesToMeasureTrend value on 5 minute candle chart.
This script is to help myself understand the criteria of Feeder.
Any comments and suggestions are welcome.

profit_trailer_backtesting v2As a result of I can't update my previous post,https://www.tradingview.com/script/2SdFFndn/,I just post new one,change the visibility to protected.
Features:
Backtesting in profit trailer's strategy.
Support profit trailer's buy strategy :
HIGHBB,LOWBB,EMAGAIN,EMASPREAD,EMACROSS,SMAGAIN,SMASPREAD,SMACROSS
Sell strategy:
GAIN,HIGHBB
DCA_buy strategy:
LOWBB,EMAGAIN,EMASPREAD,SMAGAIN,SMASPREAD,SMACROSS
DCA_sell strategy:
GAIN,HIGHBB
SOM(Sell only mode),Use BTCUSD data in specific time range, because of the limit of tradingview,you will need to change the data resolution by BTC_data_source_resolution to backtest further date from now,but the result will be inaccurate.
trailing buy > This method may not be in the same way as PT itself,because we can't truly get the bid and ask in order book by tradingview. set it to 0 if you don't want to use it.
Indicators of those strategy.
PLEASE READ THE NOTE BELOW IF YOU WANT TO USE DCA STRATEGY
DCA_enabled_value (negative number) should be ALWAYS > ALL_stop_limit_trigger or the script will just do stop loss,this follow the setting of PT.
And it means the value of net loss you want to let the trade to be DCA. if second trade (DCA trade) be made, all setting prefix by ALL_ will be ignored exclude ALL_BTC_XXX prefix for sell only mode.
CA_buy_contracts will overwrite the value you set in script option > properties > order size to number of contract,default is 100% in qty_percent.
DCA_buy_value work like same thing ALL_buy_value does.
DCA_buy_trigger is the net loss value (negative number) of open trades,if statement of strategy reach and net loss < DCA_buy_trigger,the DCA will buy.
DCA_sell_trigger will only work when DCA sell strategy is HIGHBB,it work like ALL_min_profit.
DCA_sell_value means % profit in GAIN, % of BB in HIGHBB.
DCA_stop_loss_trigger will only work when ALL BUYS have be completed,that means if you set DCA_max_buy_times = 10 ,the script will buy 11 times include the first buy(not DCA buy).
The indicators of DCA may looks terrible,you can turn them off in option.
comment if you got bug or anything suggestion.
ToDo:
rebuy_time,stop_loss_timeout
Feel free to buy me some redbull.
ETH:
0xd793607CBA1d07fE5A94884076AE94C36B6e7D8d

Low EMA of EMAgain over the chart for ProfitTrailerThis script prints low EMA line over the chart.
Buy value and time frame numbers can be modified in format.
Basically this is same with previous scripts of mine.
Though this does not show the spread between the price and low EMA line (EMAgain) and buy value, you can see the buy trailing signal.
If you set buy value positive for gain starategy, the buy trailing will start from the time point indicated by "▲".
If you set buy value negative for gain starategy, the buy trailing will start from the time point indicated by "▼".
This script is to help myself understand the buy strategies of ProfitTrailer.
Any comments and suggestions are welcome.

EMAgainEMAgain in ProfitTrailer is the strategy using the spread difference between the price and combination of fast EMA and slow EMA .
Buy value and time frame numbers are from popular setting, which can be modified in format.
If you set buy value positive for gain starategy, it is mostly between the price and slow EMA except one or two candle right after cross (sometimes three candles). In the time point indicated by "▲", the trailing for buy will start.
If you set buy value negative for gain starategy, it is mostly between the price and fast EMA except one or two candle right after cross (sometimes three candles). In the time point indicated by "▼", the trailing for buy will start.
This script is to help myself understand the buy strategies of ProfitTrailer.
Any comments and suggestions are welcome.

SMAgainSMAgain in ProfitTrailer is the strategy using the spread difference between the price and combination of fast SMA and slow SMA.
Buy value and time frame numbers are from popular setting, which can be modified in format.
If you set buy value positive for gain starategy, it is mostly between the price and slow SMA except one or two candle right after cross (sometimes three candles). In the time point indicated by "▲", the trailing for buy will start.
If you set buy value negative for gain starategy, it is mostly between the price and fast SMA except one or two candle right after cross (sometimes three candles). In the time point indicated by "▼", the trailing for buy will start.
This script is to help myself understand the buy strategies of ProfitTrailer.
Any comments and suggestions are welcome.

SMAgain vs EMAgain for ProfitTrailerSMAgain or EMAgain in ProfitTrailer is the strategy using the spread difference between the price and combination of fast MA and slow MA.
Time frame numbers are from popular settings.
If you have positive buy value for gain starategy, it is mostly between the price and slow MA except one or two candle right after cross (sometimes three candles).
If you have negative buy value for gain starategy, it is mostly between the price and fast MA except one or two candle right after cross (sometimes three candles).
This script is to help myself understand the buy strategies of ProfitTrailer.
Any comments and suggestions are welcome.

EMASPREAD - SMASPREAD - EMAGAIN - SMAGAIN for profit trailerYou can turn on and off EMASPREAD - SMASPREAD - EMAGAIN - SMAGAIN
Play with the different indicators and see how it will affect the buy trigger.
Trailing is not implemented!
This is still a work in progress. Please leave a comment if you are liking what you see :)
Trend-following Microprofit w/ Smart DCA + Profit Plot + AlertsThis alert script is oriented towards automated trading with Gunbot.
I call it "Options Galore" because of all the user-configurable settings it offers for up-trending and down-trending markets. (See: " Market Tone " study).
A strategy script for quantitative backtesting, smarter buy/sell indicator such as TSI or Stoch RSI, and stop loss/trailing stop are all in the pipeline. Please share any other suggestions in the comments!
Features:
Set backtesting range, or start forward testing from the current time. Historical Renko charts can lead to repainting, which is avoided by keeping the chart open in your browser and running with real time data.
Average protection: only buy if price drops by a certain % below your average price -- can be automatically toggled by market trender if we want to continue buying during an uptrend. This reduces net profit but increases gross profit.
Gain protection: only sell if price is a certain % above your average price -- can be automatically toggled by market trender. Wait for larger profits in an uptrend, but sell earlier in a down trend.
Minimum percent gain can also be set to a negative value to allow selling at a loss. This is not true stop loss behavior, we still need a sell signal from the indicator. This means we will try to get the best price above your price floor, but in some rare situations we may not sell before the price drops below your price floor.
Position plotter: plots average long position price relative to current price.
Plot loss level: plots average price - loss %. With pyramiding turned off, this can be used to find out where to set your stop loss.
This script is free to use, just comment or PM for access. It is mainly meant to showcase some new features, and is only safe to use in carefully selected markets such as USDT-BTC.
Stay posted for upcoming scripts with smarter signaling and additional features! If you would like to add these features to your own preferred strategy, please PM me.

Indicator: Profitability by Day & Hour (stacked, non-overlay)What it does
This tool performs a simple seasonality study on the selected symbol. It measures historical returns and summarizes them in two horizontal heatmaps:
Hours table (top) — Columns 00–23 show the average return of each clock hour, plus sample size, win rate, volatility (SD), and a t-score.
Days table (middle) — Columns 1–7 correspond to Mon–Sun with the same metrics.
Summary (bottom) — Shows the most profitable day and hour in the history loaded on your chart.
Green cells indicate higher average returns; red cells indicate lower/negative averages. The layout is centered on the screen, with the hours table above the days table for quick scanning.
How it works (methodology)
Returns: by default the indicator uses log returns ln(Ct/Ct-1) (you can switch to simple % if you prefer).
Daily aggregation (no look-ahead): day statistics are computed from completed daily closes via a higher timeframe request. Yesterday’s daily close vs. the prior day is added to the appropriate weekday bucket, preventing repaint/forward bias.
Hourly aggregation (intraday only): hour statistics are computed bar-to-bar on the current intraday timeframe and accumulated by clock hour (00–23) of the symbol’s exchange timezone.
Metrics per bucket:
Mean: average return in that bucket.
n: number of observations.
Win%: share of positive returns.
SD: standard deviation of returns (volatility proxy).
t-score: mean / SD * sqrt(n) — a quick stability signal (not a hypothesis test).
The indicator does not rely on future data and does not repaint past values.
Reading the tables
Start with the Mean row in each table: it’s color-mapped (red → yellow → green).
Check n (sample size). A bright green cell with very low n is less meaningful than a mild green cell with large n.
Use Win% and SD to judge consistency and noise.
t-score is a compact “signal-to-noise × sample size” measure; higher absolute values suggest more stable effects.
Typical observations traders look for (purely illustrative): for some equity indices, the first hour after the cash open can dominate; for FX/crypto, certain late-US or early-Asia hours sometimes stand out. Always verify on your symbol and timeframe.

Custom Ichimoku Cloud with Signals📊 OVERVIEW
This indicator generates trading signals based on Ichimoku Cloud breakouts and breakdowns. It identifies when price decisively moves through the cloud boundaries, filtering out false signals from consolidation periods.
📈 KEY FEATURES
- Transition-based signals only when price breaks through cloud
- Candle body must completely clear cloud (no touching)
- Alternating signal system prevents consecutive duplicate signals
- Built-in alerts for automated notifications
- Standard Ichimoku components included
⚙️ HOW IT WORKS
BUY SIGNAL: Triggered when candle body moves completely above cloud after being inside/below
SELL SIGNAL: Triggered when candle body moves completely below cloud after being inside/above
🎯 USE CASES
- Trend continuation trading
- Breakout trading strategies
- Cloud support/resistance analysis
- Multi-timeframe analysis
📝 PARAMETERS
- Adjustable Ichimoku periods (Conversion, Base, Lagging Span B)
- Customizable lookback period for transition detection
- Visual signal markers with alerts
⚠️ DISCLAIMER
This indicator is for educational purposes. Past performance doesn't guarantee future results. Always use proper risk management and combine with other analysis methods.
⚠️ DISCLAIMER & RISK WARNING
This indicator is provided for informational and educational purposes only and should not be considered as financial advice.
TRADING RISKS:
- Trading involves substantial risk of loss and is not suitable for all investors
- Past performance is not indicative of future results
- You can lose more than your initial investment
- Never trade with money you cannot afford to lose
NO GUARANTEES:
- This indicator does not guarantee profits or predict market movements with certainty
- Signals are based on mathematical calculations and may produce false signals
- Market conditions can change, making any strategy ineffective
- Success depends on multiple factors beyond this indicator
USER RESPONSIBILITY:
- You are solely responsible for your trading decisions
- Always conduct your own research and analysis
- Consider consulting with a qualified financial advisor
- Use proper risk management and position sizing
- Test thoroughly on demo accounts before live trading
TECHNICAL LIMITATIONS:
- Indicator may be subject to repainting in real-time conditions
- Historical results do not represent actual trading
- Signals are for analysis only, not automatic trade execution
- Performance varies across different timeframes and instruments
By using this indicator, you acknowledge that you understand these risks and accept full responsibility for your trading outcomes. The author assumes no liability for any losses incurred.
NOT FINANCIAL ADVICE - FOR EDUCATIONAL PURPOSES ONLY

Futures PnL Levels [MFFU]Futures PnL Levels is a purpose-built indicator designed specifically for futures traders using TradingView. Whether you're backtesting strategies, planning trades, or managing live positions, this tool gives you a clean, visual overlay of your Profit & Loss directly on the chart, based on your custom input.
Why This Indicator is Different
If you trade using Tradovate through TradingView , you’ve likely noticed a major limitation: TradingView does not show your real-time PnL. This has made it nearly impossible to track live profits and losses within the charting platform until now.
Futures PnL Levels bridges that gap . By inputting your entry, TP, SL, and contract size, you can now replicate a live, dynamic PnL experience directly on your TradingView chart. This solves a long-standing issue for Tradovate users and significantly improves real-time trade awareness.
Key Features
Trade Modeling
Define your trade parameters upon activating the indicator:
Set your entry price , profit target , and stop loss
Input the number of contracts to reflect real-world position sizing
Visual PnL Display
Auto-drawing Take Profit (TP) , Stop Loss (SL) , and Breakeven levels
Live PnL tracking that moves with current market price
Optional live display of floating PnL values and breakeven zones
Styling & Display Options
Adjust line colors and widths for TP/SL/Breakeven
Differentiate real-time positive vs. negative PnL with separate colors
Toggle visibility of label lines and full readouts
Customize label size , price rounding , and other chart elements
Position Summary Table
View a compact summary of your trade parameters
Float this table anywhere on the chart (e.g., top right )
Provides an at-a-glance view of your current setup
Built for CME Futures
Fully compatible with CME instruments like ES, NQ, CL, GC , and more
Supports both long and short positions
Works with auto-detected or manually defined futures contracts
Who It’s For
Futures traders looking to plan trades visually before entering a position
Backtesters and strategy developers who need PnL clarity during analysis
Active traders using Tradovate through TradingView who are missing live PnL tracking
Why Use Futures PnL Levels ?
Unlike generic TP/SL indicators, this tool offers a true replacement for missing PnL visibility in the TradingView + Tradovate ecosystem. Instead of manually inputting your profits, this indicator lets you see your trade’s performance unfold in real time — directly on the chart .
Whether you're preparing a precise entry or managing an open position, Futures PnL Levels adds structure, confidence, and clarity to every trade.

EPS+Sales+Net Profit+MCap+Sector & Industry📄 Full Description
This script displays a comprehensive financial data panel directly on your TradingView chart, helping long-term investors and swing traders make informed decisions based on fundamental trends. It consolidates key financial metrics and business classification data into a single, visually clear table.
🔍 Key Features:
🧾 Financial Metrics (Auto-Fetched via request.financial):
EPS (Earnings Per Share) – Displayed with trend direction (QoQ or YoY).
Sales / Revenue – In ₹ Crores (for Indian stocks), trend change also included.
Net Profit – Also in ₹ Crores, along with percentage change.
Market Cap – Automatically calculated using outstanding shares × price, shown in ₹ Cr.
Free Float Market Cap – Based on float shares × price, also in ₹ Cr.
🏷️ Sector & Industry Info:
Automatically identifies and displays the Sector and Industry of the stock using syminfo.sector and syminfo.industry.
Displayed inline with metrics, making it easy to know what business the stock belongs to.
📊 Table View:
Compact and responsive table shown on your chart.
Columns: Date | EPS | QoQ | Sales | QoQ | Net Profit | QoQ | Metrics
Metrics column dynamically shows:
Market Cap
Free Float
Sector (Row 4)
Industry (Row 5)
🌗 Appearance:
Supports Dark Mode and Mini Mode toggle.
You can also customize:
Number of data points (last 4+ quarters or years)
Table position and size
🎯 Use Case:
This script is ideal for:
Fundamental-focused traders who use EPS/Sales trends to identify momentum.
Swing traders who combine price action with fundamental tailwinds.
Portfolio builders who want to see sector/industry alignment quickly.
It works best with fundamentally sound stocks where earnings and profitability are a major factor in price movements.
✅ Important Notes:
Script uses request.financial which only works with supported symbols (mostly stocks).
Market Cap and Free Float are calculated in ₹ Crores.
All financial values are rounded and formatted for readability (e.g., 1,234 Cr).
🙏 Credits:
Developed and published by Sameer Thorappa
Built with a clean, minimalist approach for high readability and functionality.

Supply In Profit Z-ScoreZ-score of BTC Supply in Profit.
Supply in Profit is an On-Chain BTC indicator that shows the percentage of BTC in profit.
In this indicator you can choose to use a Z-Score or not.

Risk Calculator PRO — manual lot size + auto lot-suggestionWhy risk management?
90 % of traders blow up because they size positions emotionally. This tool forces Risk-First Thinking: choose the amount you’re willing to lose, and the script reverse-engineers everything else.
Key features
1. Manual or Market Entry – click “Use current price” or type a custom entry.
2. Setup-based ₹-Risk – four presets (A/B/C/D). Edit to your workflow.
3. Lot-Size Input + Auto Lot Suggestion – you tell the contract size ⇒ script tells you how many lots.
4. Auto-SL (optional) – tick to push stop-loss to exactly 1-lot risk.
5. Instant Targets – 1 : 2, 1 : 3, 1 : 4, 1 : 5 plotted and alert-ready.
6. P&L Preview – table shows potential profit at each R-multiple plus real ₹ at SL.
7. Margin Column – enter per-lot margin once; script totals it for any size.
8. Clean Table UI – dark/light friendly; updates every 5 bars.
9. Alert Pack – SL, each target, plus copy-paste journal line on the chart.
How to use
1. Add to chart > “Format”.
2. Type the lot size for the symbol (e.g., 1250 for Natural Gas, 1 for cash equity).
3. Pick Side (Buy / Sell) & Setup grade.
4. ✅ If you want the script to place SL for you, tick Auto-SL (risk = 1 lot).
5. Otherwise type your own Stop-loss.
6. Read the table:
• Suggested lots = how many to trade so risk ≤ setup ₹.
• Risk (currency) = real money lost if SL hits.
7. Set TradingView alerts on the built-in conditions (T1_2, SL_hit, etc.) if you’d like push / email.
8. Copy the orange CSV label to Excel / Sheets for journalling.
Best practices
• Never raise risk to “fit” a trade. Lower size instead.
• Review win-rate vs. R multiple monthly; adjust setups A–D accordingly.
• Test Auto-SL in replay before going live.
Disclaimer
This script is educational. Past performance ≠ future results. The author isn’t responsible for trading losses.

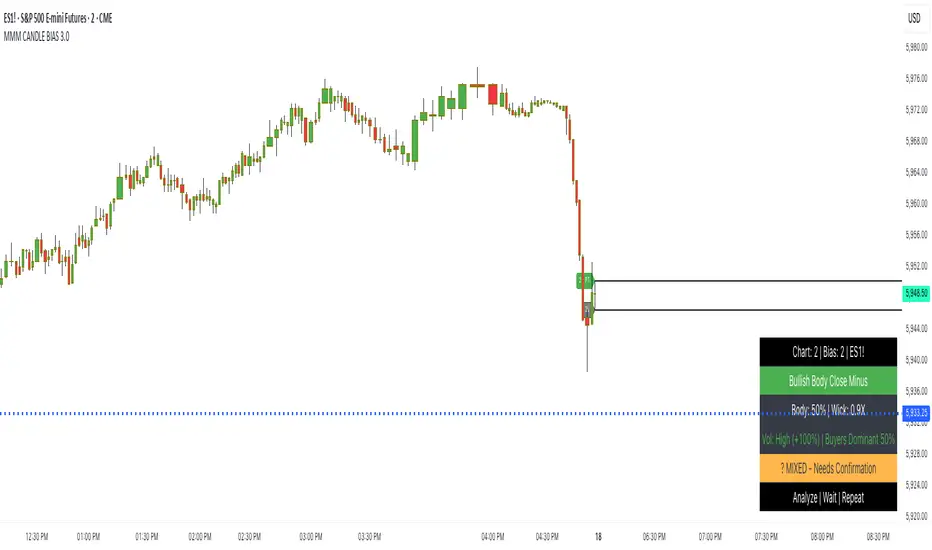
DAILY CANDLE PROFIT TARGET BIAS @MaxMaserati
Max Maserati Method for Candle Bias and effective price action Analysis
The MMM CANDLE BIAS 2.0 indicator, built on the proprietary Max Maserati Method, classifies candles to deliver clear, real-time market bias insights. It decodes price action, revealing institutional trading patterns often missed by retail traders.
The Six Core Candle Classifications: The Foundation of MMM Analysis
Master these six closing patterns, and you'll unlock the true language of price action. These are the building blocks of institutional trading behavior:
Bullish Body Close
Identification: Candle closes above the previous candle’s high.
Psychology: Strong buying pressure overcomes prior resistance.
Implication: Signals bullish trend continuation or reversal.
Bearish Body Close
Identification: Candle closes below the previous candle’s low.
Psychology: Intense selling pressure breaks past support.
Implication: Indicates bearish trend continuation or reversal.
Bullish Affinity
Identification: High tests or breaches previous low, but close stays within previous candle’s range.
Psychology: Buyers defend lower levels, rejecting downside.
Implication: Hidden bullish strength in consolidation.
Bearish Affinity
Identification: Low tests or breaches previous high, but close remains within previous candle’s range.
Psychology: Sellers cap upside attempts, gaining control.
Implication: Subtle bearish pressure despite failed breakout.
Seek & Destroy
Identification: Candle breaks both previous high and low, closing inside previous range.
Psychology: Institutions test liquidity on both sides before committing.
Implication: Direction depends on close—upper half (bullish affinity) or lower half (bearish affinity).
Close Inside
Identification: High and low stay within previous candle’s range.
Psychology: Consolidation with underlying directional bias.
Implication: Bias determined by close position relative to range.
Plus/Minus Strength System
Bullish Strength: Measures distance from low to close (buying pressure).
Bearish Strength: Measures distance from high to close (selling pressure).
Plus (+): Dominant strength significantly outweighs the other, indicating strong directional conviction.
Minus (-): Balanced strengths suggest a contested market, requiring caution.
Key Features
Automated Pattern Recognition: Instantly detects candle formations.
Color-Coded Bars: Green for bullish, red for bearish bias.
Dynamic Profit Targets: Projects targets based on higher timeframe high/low.
Real-Time Metrics: Displays bullish/bearish strength percentages and volume delta.
Customizable Table: Shows timeframe, symbol, bias, volume, and special note (“Analyze | Wait | Repeat”).
Bias Lines: Plots high/low lines on higher timeframe, with optional extension.
Labels: Customizable bias and profit target labels (Tiny, Small, Normal sizes).
Trading Advantages
Reveals institutional moves before retail traders react.
Detects reversals ahead of conventional indicators.
Enables precise entry timing with smart money.
Enhances risk management with clear strength signals.
Simplifies complex price action into actionable insights.
Profit Target Framework
Bullish Patterns: Target higher timeframe high.
Bearish Patterns: Target higher timeframe low.
Plus Strength: Expects direct move to target.
Minus Strength: Anticipates measured advance with potential pullbacks and/or violations.
Visual Implementation
Lines and Labels: High/low bias lines and profit target markers adapt to timeframe.
Table Display: Configurable position (top/middle/bottom, left/center/right) with key metrics.
Bar Coloring: Optional coloring based on bias or plus/minus strength.
Trader’s Mantra
"Analyze | Wait | Repeat" - Discipline turns market reading into consistent profits.
Elevate your trading with MMM CANDLE BIAS 2.0, where professional-grade analysis meets intuitive design.
Note: Based on the proprietary Max Maserati Method for educational and analytical use.
Multi-Indicator Swing [TIAMATCRYPTO]v6# Strategy Description:
## Multi-Indicator Swing
This strategy is designed for swing trading across various markets by combining multiple technical indicators to identify high-probability trading opportunities. The system focuses on trend strength confirmation and volume analysis to generate precise entry and exit signals.
### Core Components:
- **Supertrend Indicator**: Acts as the primary trend direction filter with optimized settings (Factor: 3.0, ATR Period: 10) to balance responsiveness and reliability.
- **ADX (Average Directional Index)**: Confirms the strength of the prevailing trend, filtering out sideways or choppy market conditions where the strategy avoids taking positions.
- **Liquidity Delta**: A volume-based indicator that analyzes buying and selling pressure imbalances to validate trend direction and potential reversals.
- **PSAR (Optional)**: Can be enabled to add additional confirmation for trend changes, turned off by default to reduce signal filtering.
### Key Features:
- **Flexible Direction Trading**: Choose between long-only, short-only, or bidirectional trading to adapt to market conditions or account restrictions.
- **Conservative Risk Management**: Implements fixed percentage-based stop losses (default 2%) and take profits (default 4%) for a positive risk-reward ratio.
- **Realistic Backtesting Parameters**: Includes commission (0.1%) and slippage (2 points) to reflect real-world trading conditions.
- **Visual Signals**: Clear buy/sell arrows with customizable sizes for easy identification on the chart.
- **Information Panel**: Dynamic display showing active indicators and current risk settings.
### Best Used On:
Daily timeframes for cryptocurrencies, forex, or stock indices. The strategy performs optimally on assets with clear trending behavior and sufficient volatility.
### Default Settings:
Optimized for conservative position sizing (5% of equity per trade) with an initial capital of $10,000. The backtesting period (2021-2023) provides a statistically significant sample of varied market conditions.

FA Dashboard: Valuation, Profitability & SolvencyFundamental Analysis Dashboard: A Multi-Dimensional View of Company Quality
This script presents a structured and customizable dashboard for evaluating a company’s fundamentals across three key dimensions: Valuation, Profitability, and Solvency & Liquidity.
Unlike basic fundamental overlays, this dashboard consolidates multiple financial indicators into visual tables that update dynamically and are grouped by category. Each ratio is compared against configurable thresholds, helping traders quickly assess whether a company meets certain value investing criteria. The tables use color-coded checkmarks and fail marks (✔️ / ❌) to visually signal pass/fail evaluations.
▶️ Key Features
Valuation Ratios:
Earnings Yield: EBIT / EV
EV / EBIT and EV / FCF: Enterprise value metrics for profitability
Price-to-Book, Free Cash Flow Yield, PEG Ratio
Profitability Ratios:
Return on Invested Capital (ROIC), ROE, Operating, Net & Gross Margins, Revenue Growth
Solvency & Liquidity Ratios:
Debt to Equity, Debt to EBITDA, Current Ratio, Quick Ratio, Altman Z-Score
Each of these metrics is calculated using request.financial() and can be viewed using either annual (FY) or quarterly (FQ) data, depending on user preference.
🧠 How to Use
Add the script to any stock chart.
Select your preferred data period (FY or FQ).
Adjust thresholds if desired to match your personal investing strategy.
Review the visual dashboard to see which metrics the company passes or fails.
💡 Why It’s Useful
This tool is ideal for traders or long-term investors looking to filter stocks using fundamental criteria. It draws inspiration from principles used by Benjamin Graham, Warren Buffett, and Joel Greenblatt, offering a fast and informative way to screen quality businesses.
This is not a repackaged built-in or autogenerated script. It’s a custom-built, interactive tool tailored for fundamental analysis using official financial data provided via Pine Script’s request.financial().

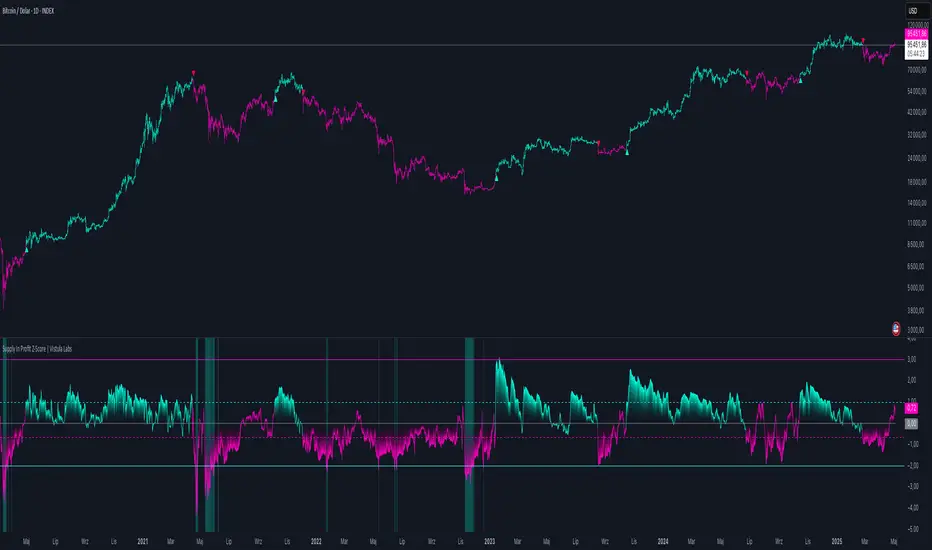
Supply In Profit Z-Score | Vistula LabsOverview
The Supply In Profit Z-Score indicator is a Pine Script™ tool developed by Vistula Labs for technical analysis of cryptocurrencies, specifically Bitcoin (BTC) and Ethereum (ETH). It utilizes on-chain data from IntoTheBlock to calculate the difference between the percentage of addresses in profit and those in loss, transforming this metric into a Z-Score. This indicator helps traders identify market sentiment, trend-following opportunities, and overbought or oversold conditions.
What is Supply In Profit?
Supply In Profit is defined as the net difference between the percentage of addresses in profit and those in loss:
Profit Percentage: The proportion of addresses where the current value of holdings exceeds the acquisition price.
Loss Percentage: The proportion of addresses where the current value is below the acquisition price.
A positive value indicates more addresses are in profit, suggesting bullish sentiment, while a negative value indicates widespread losses, hinting at bearish sentiment.
How It Works
The indicator computes a Z-Score to normalize the Supply In Profit data relative to its historical behavior:
Z-Score = (Current Supply In Profit - Moving Average of Supply In Profit) / Standard Deviation of Supply In Profit
Current Supply In Profit: The latest profit-minus-loss percentage.
Moving Average: A customizable average (e.g., EMA, SMA) over a default 180-bar period.
Standard Deviation: Calculated over a default 200-bar lookback period.
Key Features
Data Source:
Selectable between BTC and ETH, pulling daily profit/loss percentage data from IntoTheBlock.
Customization:
Moving Average Type: Options include SMA, EMA, DEMA, RMA, WMA, or VWMA (default: EMA).
Moving Average Length: Default is 180 bars.
Z-Score Lookback: Default is 200 bars.
Thresholds: Adjustable for long/short signals and overbought/oversold levels.
Signals:
Long Signal: Z-Score crosses above the Long Threshold (default: 1.0).
Short Signal: Z-Score crosses below the Short Threshold (default: -0.64).
Overbought/Oversold Conditions:
Overbought: Z-Score > 3.0.
Oversold: Z-Score < -2.0.
Visualizations:
Z-Score Plot: Teal for long signals, magenta for short signals.
Threshold Lines: Dashed lines for long/short, solid lines for overbought/oversold.
Candlestick Coloring: Matches signal colors (teal/magenta).
Arrows: Green up-triangles for long entries, red down-triangles for short entries.
Background Colors: Magenta for overbought, teal for oversold.
Alerts:
Conditions for Long Opportunity, Short Opportunity, Overbought, and Oversold.
Usage Guide
Trend Following
Long Entry: When Z-Score crosses above 1.0, indicating potential upward momentum.
Short Entry: When Z-Score crosses below -0.64, suggesting potential downward momentum.
Overbought/Oversold Analysis
Overbought (Z-Score > 3.0): Consider profit-taking or preparing for a reversal.
Oversold (Z-Score < -2.0): Look for buying opportunities or exiting shorts.
Timeframe
Uses daily IntoTheBlock data, ideal for medium to long-term analysis.
Interpretation
High Z-Score: Indicates Supply In Profit is significantly above its historical mean, potentially signaling overvaluation.
Low Z-Score: Suggests Supply In Profit is below its mean, indicating possible undervaluation.
Signals and thresholds help traders act on shifts in market sentiment or extreme conditions.
Conclusion
The Supply In Profit Z-Score indicator provides a robust, data-driven approach to analyzing cryptocurrency market trends and sentiment. By combining on-chain metrics with statistical normalization, it empowers traders to make informed decisions based on historical context and current market dynamics.