CRYPTO 3EMA Strategy with Take Profit & Stop Loss based on ATRSimple 3 EMA Strategy with plotted Take Profit and Stop Loss
Entry condition:
- Middle EMA cross above the Slow EMA
- Set take profit and stop loss exit conditions based on ATR Indicator
Exit condition:
- Fast EMA cross below the Middle EMA
Cerca negli script per "profit"

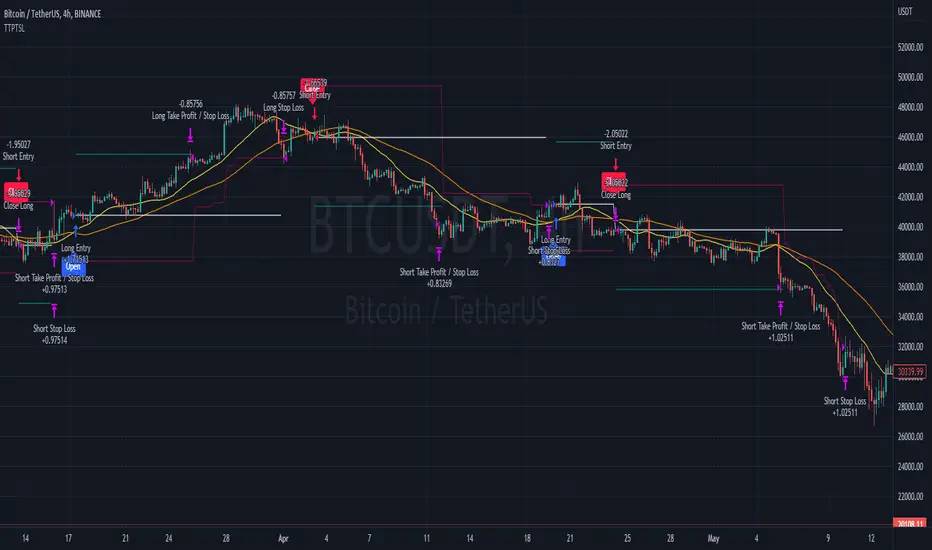
Trailing Take Profit Trailing Stop LossThis script demonstrated a dual trailing take profit and stop loss strategy. Where you take 50% (configurable) of the profit when a price level is reached and then you get the rest when a trailing stop loss is hit.
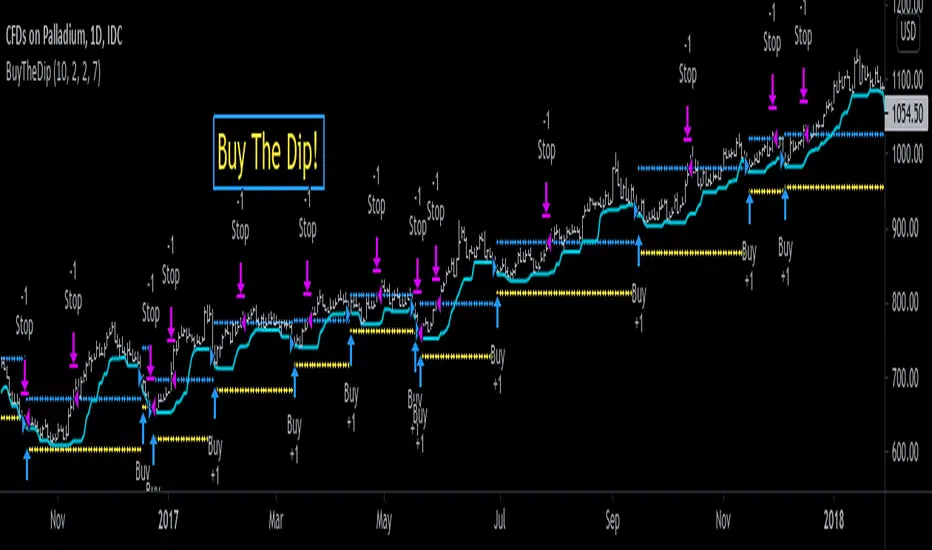
Buying Dip Strategy With Take Profit And Stop Loss [racer8]"Buy low, sell high."
This system buys the dip and takes profit for a high win rate.
It uses an ATR take profit and ATR stop loss.
It buys the dip when the close is below the previous 7 day low.
Daily timeframe is best.
Enjoy ♡
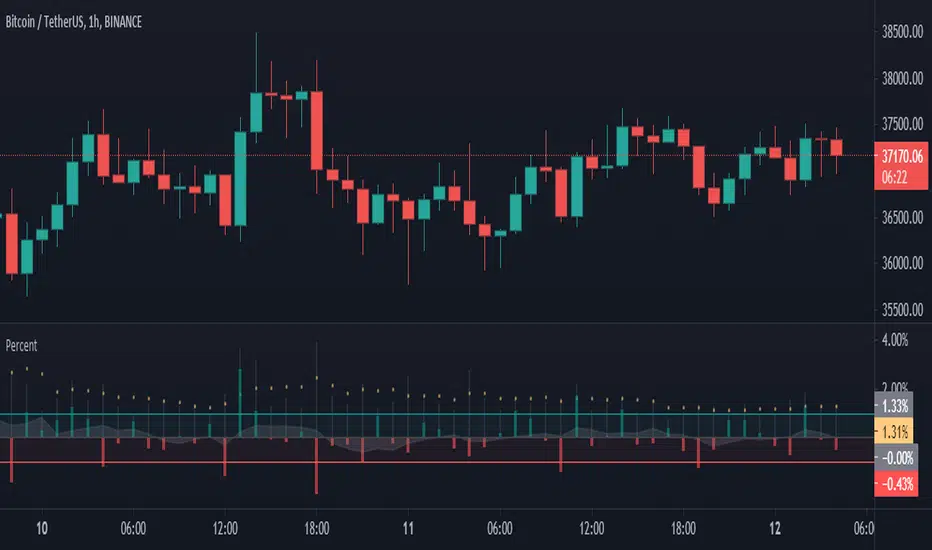
Percentage of Price ProfitThis indicator shows the percentage change in the price per candle, In this way, you will be aware of the amount of profit in the desired time period.
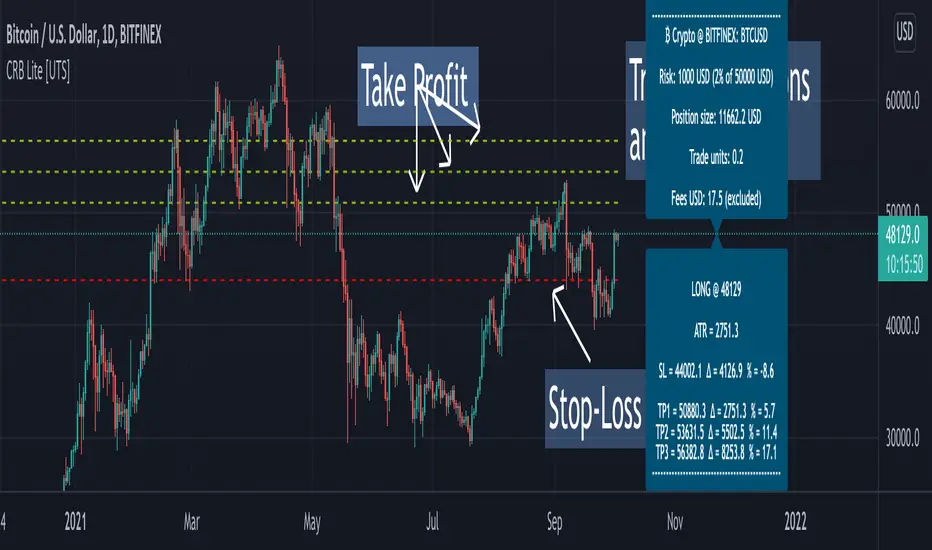
Crypto Risk Buddy - Lite: Position Size, SL & TP System [UTS]
Crypto Risk Buddy - Lite
Position Size, Stop Loss & Take Profit System
The ultimate system to calculate trading risk on crypto assets.
The 'Lite' version is limited to BTC as base currency.
₿ Cyptocurrencies
Position Sizing
De-risk possible drawdown by calculating a proper position size.
Define your risk percent based on your net value
Freely define your account currency
Trade any asset by the customizable Base / Quote currency factor
Calculate trading fees
Show all information on a customizable data screen
Stop Loss
Minimize trade risk by calculating your stop-loss.
Percent, Value and Delta display from current price
ATR based (Average True Range, modifiable)
Custom SL value possible
Adjustable
Two visual representations on chart
Automatically and real-time calculated on screen
Take Profit
Multiple take-profit levels to ensure not giving back to the market.
Up to 3 take profit levels to define
ATR based (Average True Range, modifiable)
Custom TP values possible
Easily customizable
Two visual representations on chart
Automatically and real-time calculated on screen
Currencies
Choose an account currency and calculate your risk for every trading pair.
USD
EUR
GBP
AUD
CAD
CHF
HKD
JPY
NOK
NZD
RUB
SEK
SGD
TRY
ZAR
BTC (crypto)
ETH (crypto)
USDT (crypto)
BUSD (crypto)
USDC (crypto)
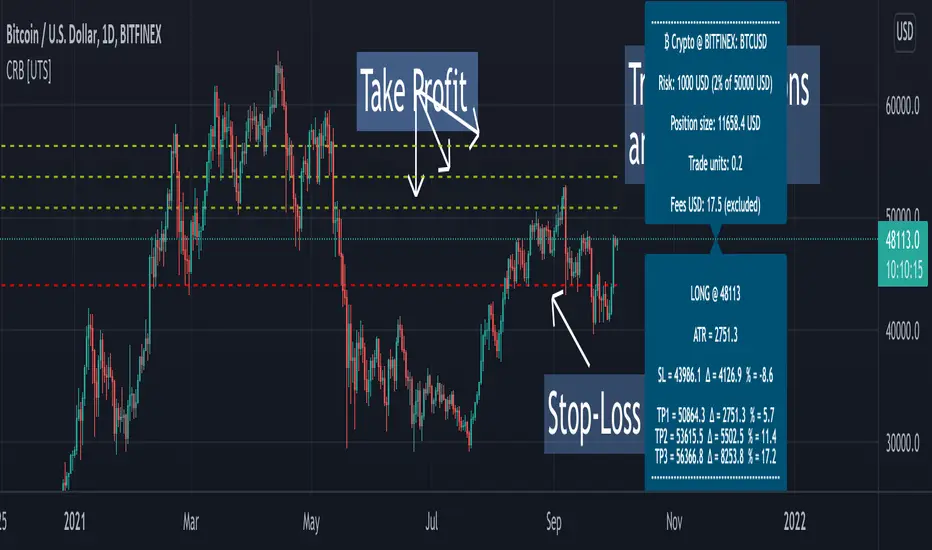
Crypto Risk Buddy: Position Size, SL & TP System [UTS]
Crypto Risk Buddy
Position Size, Stop Loss & Take Profit System
The ultimate system to calculate trading risk on crypto assets.
₿ Cyptocurrencies
Position Sizing
De-risk possible drawdown by calculating a proper position size.
Define your risk percent based on your net value
Freely define your account currency
Trade any asset by the customizable Base / Quote currency factor
Calculate trading fees
Show all information on a customizable data screen
Stop Loss
Minimize trade risk by calculatig your stop-loss.
Percent, Value and Delta display from current price
ATR based (Average True Range, modifiable)
Custom SL value possible
Adjustable
Two visual representations on chart
Automatically and real-time calculated on screen
Take Profit
Multiple take-profit levels to ensure not giving back to the market.
Up to 3 take profit levels to define
ATR based (Average True Range, modifiable)
Custom TP values possible
Easily customizable
Two visual representations on chart
Automatically and real-time calculated on screen
Currencies
Choose an account currency and calculate your risk for every trading pair.
USD
EUR
GBP
AUD
CAD
CHF
HKD
JPY
NOK
NZD
RUB
SEK
SGD
TRY
ZAR
BTC (crypto)
ETH (crypto)
USDT (crypto)
BUSD (crypto)
USDC (crypto)
PIVOT EDGE - The complete trading setup - LITEIntroduction to the Indicator " PIVOT EDGE - The complete trading setup - LITE "
The Foundation layout for this indicator is based on PIVOT's which are nothing but the most important levels that the price has respected in the past.The values for the pivots are derived from the key attributes of the price in any timeframe such as the OPEN, HIGH, LOW and CLOSE. These define the mood of the price and where it intends to move in relation to the previous range formed.Earlier HIGH - LOW i.e the RANGE indicates the possible movement that a stock can make in the current session and as per the calculated pivots we can possible find out the tentative supports and resistances. In addition to this indicator, It is advisable to use the price action theory which helps in taking a right decision for entries.
This indicator by itself is complete in nature, i.e it guides the user for possible entry levels and the projected targets that we can achieve and also the likely stop loss limit in case the price reverses. So beforehand even before entering into a trade position, the user can ascertain what can be his loss or max profit and then he can chose an optimum position size for favorable results.
The beauty of this Indicator lies in the fact that it can be used for all types of trading like Scalping, Intra day, Swing or Positional and Investments also. It works on all timeframes and across all market segments like EQUITY, COMMODITIES, FUTURES , OPTIONS , FOREX etc.
This indicator can be used for any exchange and any timezone also without any changes or adjustments needed.
Now let us understand the features of this Indicator in detail.
TIMEFRAME - It has options to choose between Day,week and month as timeframe. By default it is set to Day timeframe
DISPLAY MAJOR LEVELS - These are the important support and resistance levels calculated based on the past price data. Most important ones are marked in BOLD RED and BOLD GREEN between which the price tends to move generally.
Apart from these, We have breakout level marked in light green and if price breaks this level we can expect targets upto extended levels and beyond marked in blue.
we also have breakdown level marked in light red and if price breaks this level we can expect targets down up to extended levels and below it marked in blue.
In addition I have coded intermediate target levels that appear in light gray between the extended levels or blue lines. Sometimes when the gap between these targets are huge, price cannot reach the targets and reverses at these intermediate targets. You can use them as targets or trailing stoploss based on your plan
DISPLAY HIDDEN LEVELS - These levels are intermediate supports and resistances that can be used whenever the present day indicated range is very wide. Whenever we have an explosive moments in market the range of that day is very huge and so he next day support and resistance band becomes very wide indicating the sideways movement day within that range. And on those days we can switch on the hidden levels and the price respects these levels and most of the days it is inside this range only.
DISPLAY PREVIOUS HIGH / LOW / CLOSE - I have included Daily / Weekly and monthly levels. It is important to know the earlier highs / lows and close since price respects it very must just like support and resistance.
PEMA - This is an important EMA based indicator which potentially indicates curves of support and resistance during retracements or pullbacks. If the curves are breached then the trend is reversed and the price will tend to move to the next pivots.
VALUE AREA - One of the most important feature of this Indicator is this which is derived from the Volume profile concepts. It indicates the fair value area Indicated by orange band and the upper and lower limits indicated by orange lines. Whenever the price is overvalued or undervalued, it is pushed back to its fair value and we can judge the present price position in relation to the value area and then take position in anticipation of the price reaching its fair value area. This must be coupled with price action for favorable results.
IMPORTANT NOTE : This indicator does not guarantee any favorable results nor protect your from any loss. You own the complete risk of your trades. It is suggested that you use this indicator and do back testing for considerable period to understand how it works the the potential win rate it can give.
If you have any doubts or need any clarifications of assistance in understanding, you can message me and i will try to help.
I will soon try to make a Video and explain the use of this indicator for better clarity and understanding.
Happy and Safe trading - Mohan from PIVOT EDGE

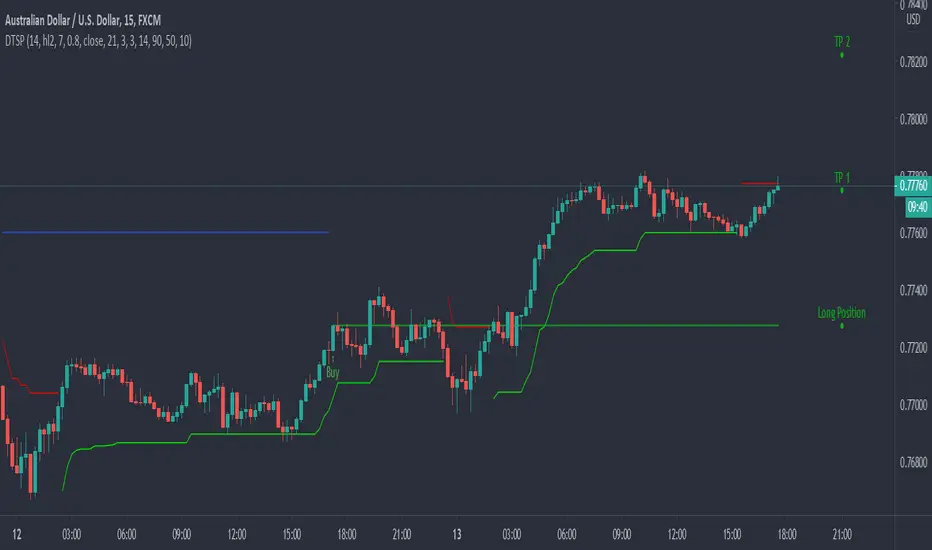
Dynamic Take Profit & Signals (AussieBogan)Dynamic Take Profit & Signals (DTS) help us to dynamically place potential take profit levels. These levels are measured based on standard deviation in conjunction with swing high and low points. Head over to the settings to control your take profit and multiplicative factor setting.
In short, higher values of either setting will return more spread out between tp's. The logic behind using the standard deviation is that a low value of it will return tp closer to where you entered the trade, as such it will have higher chances of the price reaching them.
The Indicator also has alert features for buy and sell so any trader can be aware of every potential signal the indicator produces.
Strategy - Profit Maximizer by PMaxIt is a small modification to the "Profit Maximizer Max" script to make it a strategy by date range.

Buy - Take Profit OR Stop Loss % BasedScript looks back for a certain period of time and than enter when price close above that look back period ema. Once enter it does not care for how many times price cross above or below. Once entered, it will either hit percenatage based take profit of stop loss.

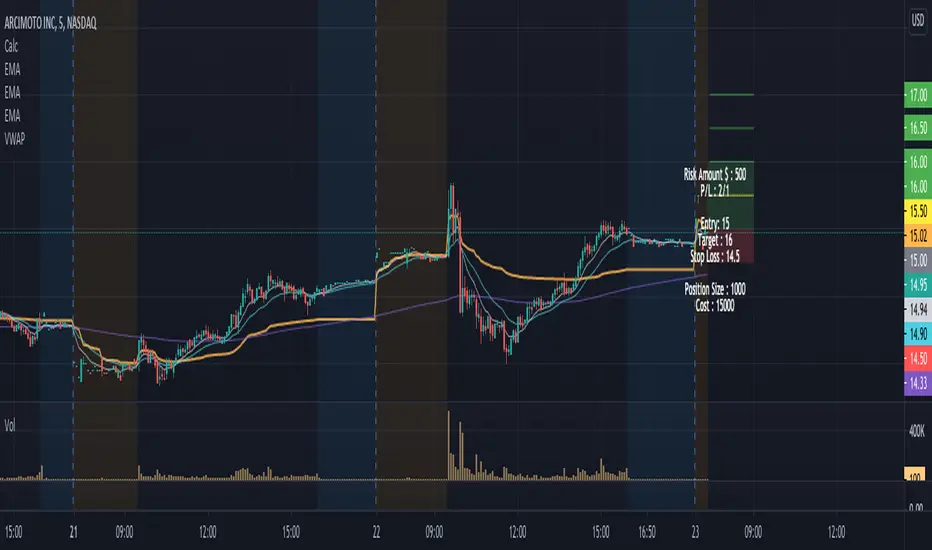
Position Size Calculator w/ profit targetsThis script helps the user visualize profit targets and calculates position size based on the input risk amount.
Input variables:
- Risk amount
- Entry price
- Stop loss amount
- Profit target amount
Calculated variables:
- Profit loss ratio
- Position size
- Postion cost
Plotted variables:
- shaded: entry price --> price target (green filled)
- shaded: entry price --> stop loss target (red filled)
- 1:1 p/l ratio --> yellow line
- 2:1, 3:1, 4:1 p/l ratios --> green lines
Overlay text can be toggled on/off in parameter input section
KS Profit TrendStrategy for KS Profit Trend indicator
ATTENTION !!!
Work on the KS Profit Trend indicator is carried out only on the timeframe of 15 minutes!
You do not need to try to trade on other periods.
The transaction can last from one hour to four days.
On average, about 10-15 main UP/DOWN signals are received per month. You can also use strategies 2 and 4 throughout the entire trading period.
This script is based on the work of Fibonacci levels, candle analysis, moving averages, as well as the concept of searching for reversal trend formations along the average lines of resistance and support.
You can trade using four strategies:
Strategy 1. Trade according to the signals.
Open a short / long position after fixing the down/Up signal candle. We place take profit and stop loss orders at the levels indicated by the indicator. You can also configure the TP and SL parameters yourself, depending on the individual risk management. Optimal settings are made for BTC and ETH. For other trading pairs, you can adjust the values yourself to get the best result. The reverse signal serves as a notification of a trend change.
Strategy 2. Trade by support and resistance levels.
After the signal appears, we place pending orders. The first order is placed on the Central border. The second order, depending on the trend direction (short/long position), is placed at the High Bound/Lower Bound levels. The reverse signal serves as a notification of a trend change.
Strategy 3. Trading combines Strategy 1 and Strategy 2.
Strategy 4. Trade in quick scalping mode.
It is possible to leave only the Trend line and Attention signals enabled for scalping.
In the script settings, you can specify:
1. Whether to display the value of the Attention signal.
2. Choose fast trading (recommended for ETH) or slow trading (recommended for BTC and low-volatility trading pairs).
Attention!!! You must have only two consent symbols either on fast signals and fast plot levels or on slow signs and slow plot levels.
3. Whether to display the levels of Take profit and Stop loss.
4. Whether to display the Trend line
This script is optimally configured for trading ETH and BTC, as well as suitable for any exchange and any assets.
As an example, screenshots of the trading session on the Moscow exchange in the form of Sberbank shares and FOREX.com as a eur / usd pair.
You can choose which trading mode to use for any selected trading pair and any exchange (fast or slow), depending on the style of the trading process.
For all questions regarding the indicator operation, as well as the provision of the KS Profit Trend trial period, you can contact @KalinkaSV in Telegram.
Стратегия для индикатора KS Profit Trend.
ВНИМАНИЕ!!!
Работа по индикатору KS Profit Trend ведётся только на таймфрейме 15 минут !
Не нужно пытаться торговать на других периодах.
Сделка может длиться от часа до четырёх дней. В среднем за месяц получается около 10-15 основных сигналов UP/DOWN.
Так же работать по стратегии 2 и 4 можно на протяжении всего торгового периода.
Данный скрипт основан на работе уровней Фибоначчи, скользящих средних, свечного анализа, а также концепции поиска разворотных трендовых формаций по уровням сопротивления и поддержки.
Вы можете торговать по четырём стратегиям:
Стратегия 1. Торговля по сигналам.
Открываем короткую/длинную позицию после закрепления сигнальной свечи Down/Up.
Размещаем ордера тейк-профита и стоп-лосса на указанных индикатором уровнях.
Так же вы можете самостоятельно настроить параметры TP и SL в зависимости от индивидуального риск-менеджмента.
Оптимально произведены настройки для BTC и ETH.
По остальным торговым парам можно самостоятельно корректировать значения для получения максимального результата.
Обратный сигнал служит оповещением о смене тренда.
Стратегия 2. Торговля по уровням поддержки и сопротивления.
После появления сигнала размещаем отложенные ордера. Первый ордер размещаем на Central border.
Второй ордер в зависимости от направления тренда (короткая/длинная позиция) размещаем на уровнях High Bound/Lower Bound.
Обратный сигнал служит оповещением о смене тренда.
Стратегия 3. Торговля совмещает в себе Стратегию 1 и Стратегию 2.
Стратегия 4. Торговля в режиме быстрого скальпинга.
Возможно для скальпинга оставить включенными для отображения только Трендовую линию и сигналы Attention.
В настройках скрипта вы можете указать:
1. Следует ли отображать значения сигнала Внимание.
2. Выбрать быструю торговлю (рекомендовано для ETH и высоковолатильных торговых пар) или медленную торговлю (рекомендовано для BTC и низковолатильных торговых пар).
Внимание! У вас должно быть только два символа согласия либо на fast signals и fast plot levels либо на slow signals и slow plot levels.
3. Отображать ли уровни Тейк-профита и Стоп-лосса.
4. Отображать ли Трендовую линию.
Данный скрипт оптимально настроен на торговлю ETH и BTC, а так же подходит для любой биржи и любых активов.
Как пример представлены скриншоты торговой сессии по Московской бирже в виде акций Сбербанка, и FOREX.com в виде пары eur/usd.
Вы сами выбирается какой режим торговли использовать для любой выбранной торговой пары и любой биржи (быстрый или медленный) в зависимости от стиля торгового процесса.
По всем вопросам касаемо работы индикатора, а так же предоставления пробного периода KS Profit Trend, можно обратиться в Телеграмм к @KalinkaSV

Bitlinc MARSI Study AST w/ Take Profit & Stop loss - beta 0.1This script is beta 0.1 - will update as soon as the script is tradable
This script is based on AST on a 10 minute timeframe. You can change the asset and the timeframe for any asset you want to trade, but for it to work correct ALL settings have to be testes in the Strategy section of the TradingView. Each assets and timeframe require a different mixture of settings. This is NOT a one settings fits all trading for all assets on any timeframe. Below are the settings and explanation on how it works.
How it fires a buy / sell:
The script will plot an RSI with upper and lower bands in a separate indicator window. The idea behind this script is to fire a LONG when MA crosses OVER lower band and fire a SHORT when the MA crosses under the lower band. Each order that fires is an OCO (Order Cancels Order) for pyramiding.
Settings:
You have full control of these settings as mentioned above, you must configure every part of this script for each asset and timeframe you trade.
- Length of MA
- Length
- Upper bands of RSI
- Lower bands of RSI
- Take profit percentage
- Stop loss percentage
- Month to start and end the strategy (within 2020)
- Day to start and end the strategy (within 2020)
- Quantity type
- Slippage
- Pyramiding
***Remember that after the signal to enter or exit a trade is fired, the alert will trigger AFTER the close of the candle that caused the tigger to fire

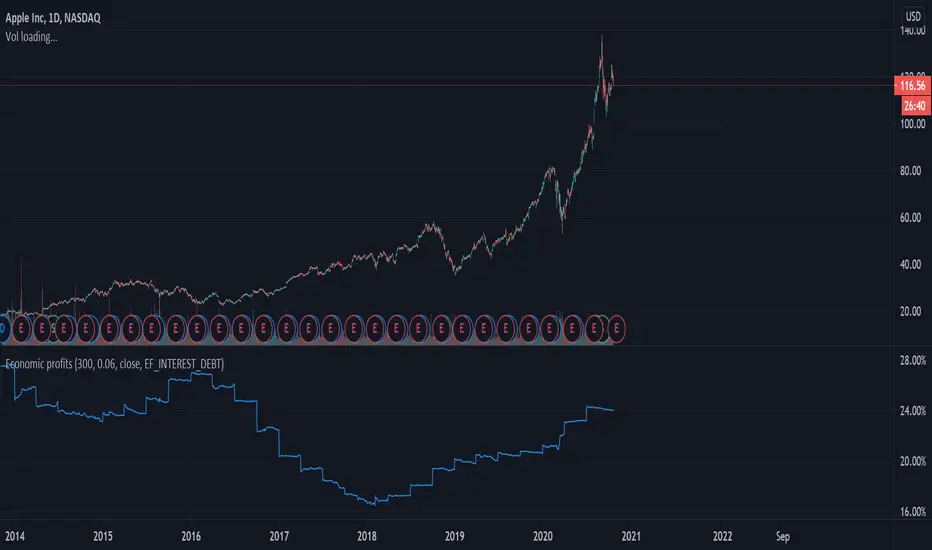
Economic profits (ROIC-WACC)Fundamental Chart
quantifying a competitive advantage
Economic profits (EP) measures the spread between
a firms return on invested capital and weighted average cost of capital.
Companies that have a positive EP means that the firm generates a higher
return then it cost to raise the capital required for investment.
a company that can maintain a an positive excess EP will see its value
increase as growth increases and vice versa.
EP can be used as a quantitative measure, indicating a durable competitive advantage.
best used as a comparable metric within an industry group.
As in most case when analyzing historic fundamentals, consistency is paramount.
as well as future expectations.
notes on code:
- average TTM ROIC TTM
- Coast of equity uses CAPM
- 6% required rate of return (option to change as desired)
- Value of equity, market value
- Value of debt, book value (due to limitations)
- risk free rate, US10Y
1st published scrip, let me know what you think in the comments.
MACD Strategy KMACK Rev 1.1Hull smoothed 45/10 macd
Please note that the macd/rsi values do not print unless the current day is Monday-Friday and the market will be open.
14 period hull smoothed rsi marks the rsi value at each macd reversal and will not signal a long position above 70 or a short position below 30
Macd and rsi will only display on the current day and will only display the last 2 hours
Lit candles occur after 0920 nyse time
Alerts or entries will only fire after 0931 nyse time
Entry signal will confirm with the 5 minute candle.
Long entry requires the current 5 minute candle to close>=hlc3
Short entry requires the current 5 minute candle to close<=hlc3
Buy/sell alerts will only fire in the last 10 seconds of the realtime (current) bar
Options:
Select bias
Modify macd lookback period(s)
Alerts:
Buy
Sell
Rsi crossing into the power region (60)
Rsi crossing into the weakness region (40)
Current strategy exits position upon signal opposite to selected bias, this is for simplicity.
There are currently no add-on strat signals but the alerts/lit candles will fire
Successful trades average >55% with an average profit factor of 3%
Net profit averages 3%
Max drawdown averages below 0.25%
Added order size input
Added show/hide strat signals. Still lights the bars green/red. Make sure your bar color setting in tv is set to a transparent color so you can see the bright reds and greens.
Added a couple lines of code that fire the alert/strat if macd reverses and the corresponding 5min candle does not agree and the following candle does agree. Added an average of 1.5% winning trades.
Message me for free trial access
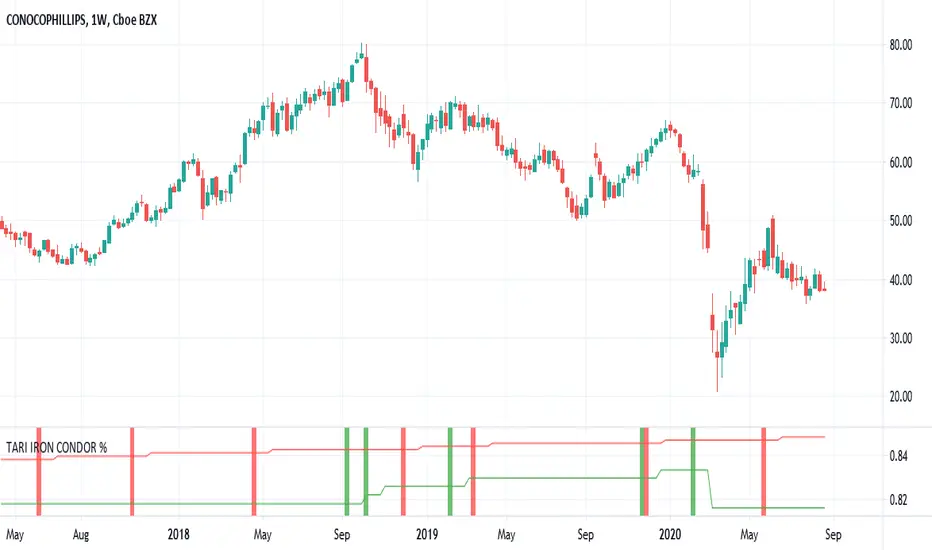
TARI IRON CONDOR %Hi guys!
I give here some details about my new script.
It's a script to find the best opportunity to trade options, sotcks, etf, index, an ocean of securities!
It works it's best on Weekly time frame, and that's how I use it.
There are only 2 settings to do before to dive into the market:
Period: it means how many candles you want to trade before expiration.
Strike: it's where to sell the put and the call, as % of actual price.
It's easier to get it reading about my routine:
Monday morning I open the Weekly chart, I set "period" to match it with next expiring day (if next regular expires in 2 weeks I set period=2, if I prefer to trade a weekly option I can set "period=1"), and I set a Strike. "Strike" 10% means that the short legs must be placed +/-10% from Monday opening price ( we call this price just opening price). If Monday open is 100$ (opening price is 100), and I choose 7%Strike, the short put must be placed @ 93$, the short call @107$.
On the script you can find a green or a red histogram, when it appears it means that there is a good edge to trade iron condor.
On the right side of the indicator you will see the success rate for green and red signal. You can play with Strike to find the better odds, for exemple: XYZ with 10% strike gives 88% success ( so reward / risk ratio is (100-88)/88=12/88= 0.14), and all the trades that gives you by your broker platform a succes rate lower than 88% (that means RR higer than 0.14), is good for us!
So basically we know for each strike and each expiring date, on a given security, our odds by TARI CONDOR, we know our Reward / Risk ratio, and when the market pays more than what we see by the strategy, we have an edge.
If I find a good opportunity I jump on my broker platform and place an order. It's not always possible to find a decent RR, in thoese cases I place a pending order, so maybe after a few days it can be executed as the price moves closer to the wings. But we trade only if we have a real edge! I trade about 10 iron condors in a week.
Once the order has been executed it's time to manage the position, the rules are the basic rules for iron condor: if one candle cloes at the end of the week over one long strike we roll ( up the puts and down the calls) the side that is still in profit, until around the opening price, to collet more credit, raising our RR. If one spread is deep ITM we can close that side, lowering our max loss.
That's it. I will publish my trades over the next days, to better understand the power of this script.
By TARI CONDOR we can trade almost everityhing with options, having a good edge on our side, plus all the benefit in trading options instead trading stocks or etf (levarage is the most important).
Subscribe and Enjoy your wallet!
Tari
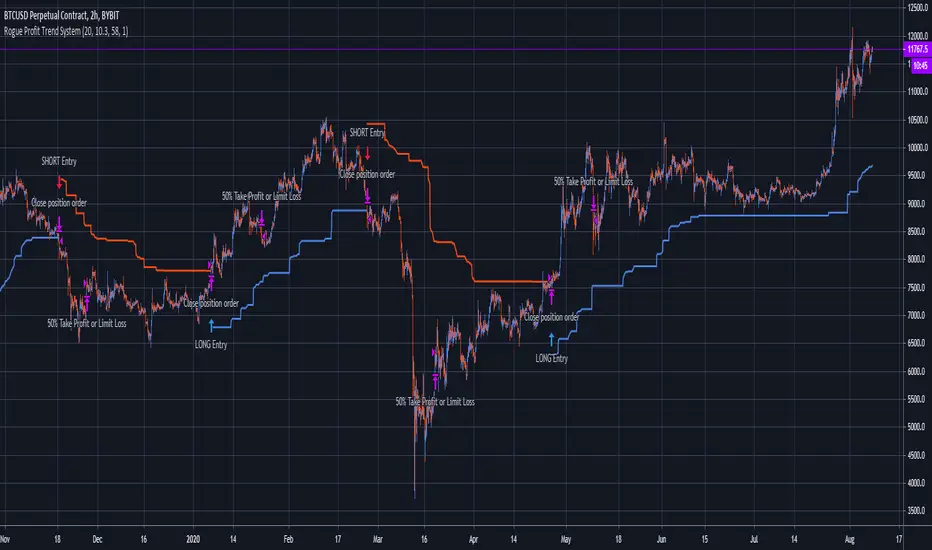
Rogue Profit Trend SystemThis system can be used for all assets. This script identifies trends and when to enter and exit. There is also built in risk management in the form of a take profit target or a reduction of risk to limit a losing trade. Inputs are variable and can be changed to better suit the asset and time frame you are trading. Since the risk management (take profit or limit loss) is calculated by 50% of your position, this system is designed to trade in multiples of two's. For example, you enter into a position with $100 at risk, when your risk management signal fires, it will reduce your position by 50% to either snag some profit or limit a loser leaving you with $50 in the position. Close the trade completely when the trend reverses for either a profit or loss.
Nothing about trading is easy. You will have losing trades. Managing your risk is the key to success which is why this system is so powerful. Markets are fluid and random so you will have to put some time and effort into adjusting the system inputs for each asset and the respective time frame you are trading and continue to adjust as time passes. This system will make you money if you manage it correctly and systematically.
Message me for two day trial access. Happy trading!
Rockstar Long Take profit flagFlag to indicate a good time to consider taking profit if you are in a long position.
The indicator will show a green diamond in an uptrend where the price is overbought and could pull back.
Conditions for flag:
Price above 20MA
20MA above 50MA
50MA above 200MA
RSI > 70
Close price is far from 20MA (about to pull back and overbought)
All inputs configurable in the settings for the indicator.
Please do not trade based on indicators alone. Use your strategy and be careful!

ATR with Take and StopThis simple indicator will plot the take profit and stop loss values based on the ATR indicator.
It's possible to set how many times the ATR value will be applied to the closing price and
what trade type is used, Long or Short.

ATR Take Profit bandsSimple ATR-scaled levels or bands of suggested price to take profit on directional trades.

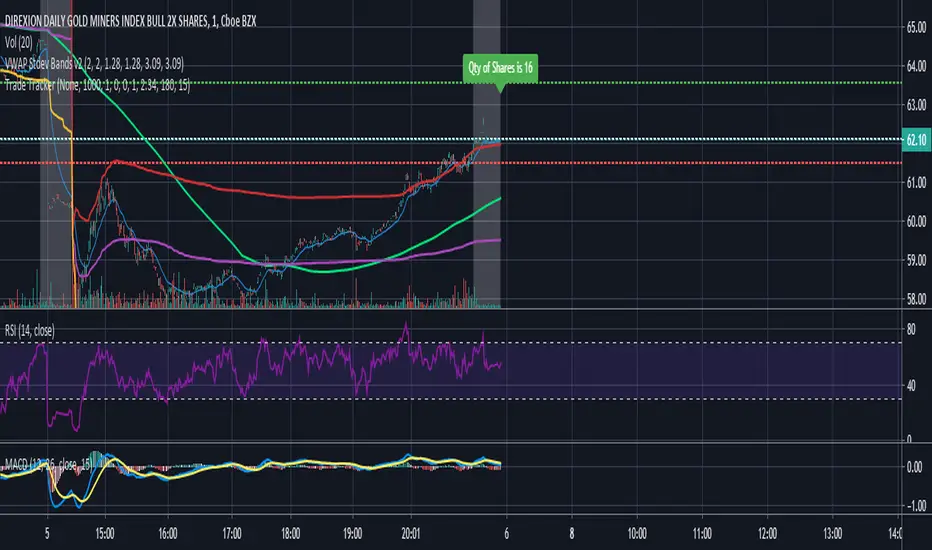
Trade Tracker - Real time stop loss and take profitTrade Tracker;
Key features
- Real time tracking of stop loss
- Real time tracking of Take Profit
- Real time tracking of break even point
- SMA integration
- EMA integration
Break even point calculated by doubling the single fee cost and adding stamp duty percentage.
Stop loss calculated by the customized percentage.
Take Profit calculated by the customized percentage.
Visually see how many shares you can buy. In the settings tab add your account balance. E.G 1000. You can then also add a portion size if you only want to trade with half your account. For this simply add 2 in the portion field. Alternatively add any multiplier you like.
Nikesh Price CycleEvery Script has a pattern and it follows a cyclic movement which results into many small and big swings. We have tried to capture these cyclic pattern. Division line acts here as a pivot point which defines a holistic view of bulls and bear power. Price moving above division line indicates bullish trend and price moving below division line indicates bearish trend. Price scale bar defines trend momentum. when price crosses price scale bar with green scale bar colour it shows we should enter. we will keep on booking our profit on near next fib level. we will exit the trend once price candle crosses linear regression line. for safe entry in case of bulls entry-- price scale bar,linear regression line and mid avg term line should be below price candle. In case of bears entry--price scale bar,linear regression line and mid avg term line should be above price candle.

[alert] XBT Stable Max Profit Swing Strategy* This alert indicator is pair of strategy indicator 'XBT Stable Max Profit Swing Strategy'
Trend tracking strategy indicators through trend analysis.
Through 20 years of programming experience and years of quant experience,
I have developed this strategy indicator for Tradingview that enables stable and high returns.
Optimized for XBTUSD 4H.
I really hate repainting indicators.
No real trades can be done with it.
This is the one I am currently using for real trading.
This indicator is never repainted !!
For replay to check the repaint indicator,
A 2-day trial period is provided.
Minimized the loss when the price is going sideway, which is a disadvantage of the trend tracking strategy.
The default setting is recommended, but it is also possible to optimize it by setting the details of the three category settings.
(Trade points of settings A, B, and C factors are displayed in the transaction history to help tuning)
For detailed backtesting, a backtesting period can be set.
* Note: Backtesting results do not guarantee future results.
This indicator is an invite only indicator.
If you want to use this indicator, contact with my information below.
