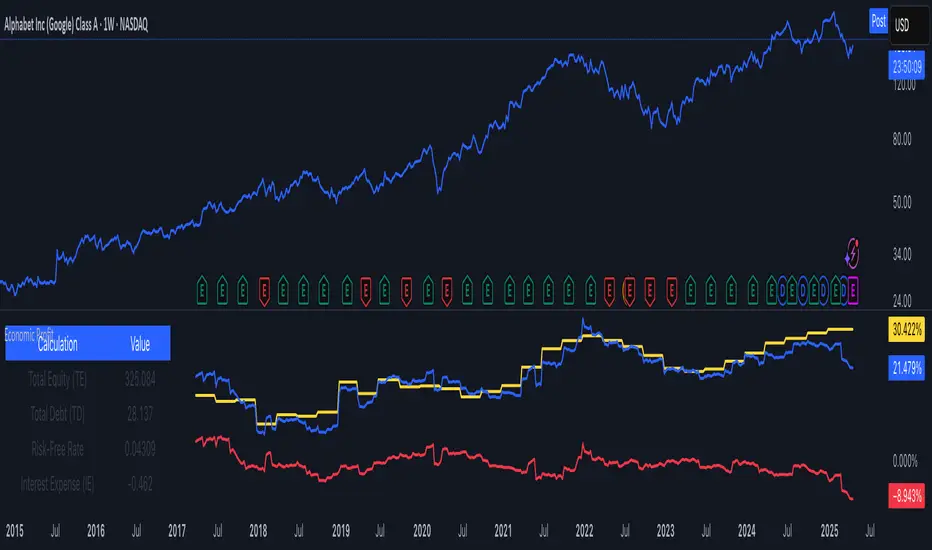
Economic Profit (YavuzAkbay)The Economic Profit Indicator is a Pine Script™ tool for assessing a company’s economic profit based on key financial metrics like Return on Invested Capital (ROIC) and Weighted Average Cost of Capital (WACC). This indicator is designed to give traders a more accurate understanding of risk-adjusted returns.
Features
Customizable inputs for Risk-Free Rate and Corporate Tax Rate assets for people who are trading in other countries.
Calculates Economic Profit based on ROIC and WACC, with values shown as both plots and in an on-screen table.
Provides detailed breakdowns of all key calculations, enabling deeper insights into financial performance.
How to Use
Open the stock to be analyzed. In the settings, enter the risk-free asset (usually a 10-year bond) of the country where the company to be analyzed is located. Then enter the corporate tax of the country (USCTR for the USA, DECTR for Germany). Then enter the average return of the index the stock is in. I prefer 10% (0.10) for the SP500, different rates can be entered for different indices. Finally, the beta of the stock is entered. In future versions I will automatically pull beta and index returns, but in order to publish the indicator a bit earlier, I have left it entirely up to the investor.
How to Interpret
We see 3 pieces of data on the indicator. The dark blue one is ROIC, the dark orange one is WACC and the light blue line represents the difference between WACC and ROIC.
In a scenario where both ROIC and WACC are negative, if ROIC is lower than WACC, the share is at a complete economic loss.
In a scenario where both ROIC and WACC are negative, if ROIC has started to rise above WACC and is moving towards positive, the share is still in an economic loss but tending towards profit.
A scenario where ROIC is positive and WACC is negative is the most natural scenario for a company. In this scenario, we know that the company is doing well by a gradually increasing ROIC and a stable WACC.
In addition, if the ROIC and WACC difference line goes above 0, the company is now economically in net profit. This is the best scenario for a company.
My own investment strategy as a developer of the code is to look for the moment when ROIC is greater than WACC when ROIC and WACC are negative. At that point the stock is the best time to invest.
Trading is risky, and most traders lose money. The indicators Yavuz Akbay offers are for informational and educational purposes only. All content should be considered hypothetical, selected after the facts to demonstrate my product, and not constructed as financial advice. Decisions to buy, sell, hold, or trade in securities, commodities, and other investments involve risk and are best made based on the advice of qualified financial professionals. Past performance does not guarantee future results.
This indicator is experimental and will always remain experimental. The indicator will be updated by Yavuz Akbay according to market conditions.
Cerca negli script per "profit"
Position and Profit/LossHelps users track their position and profit/loss in real-time.
Instructions :
Open the indicator settings
Input your Quantity, Buy Price, Fee, and Target Price
This indicator is designed to provide users with simple real-time tracking of their positions and profit/loss within a trading session. It offers clear and concise information that enables users to understand their current position's profitability, making it easier for them to manage their trades effectively.
Input parameters
qty : Quantity of the position (default value: 100.0). The target label is represented by a green cross
buy_price : Buy price of the position (default value: 1.0).
fee : Fee percentage for the transaction (default value: 0.0016). note that this is not a percentage, but rather a decimal. So 0.0016 is 0.16%
target : Target price for the position (default value: 1.0). This is an extra label to show you where your target is on the chart. The target label is represented by a green cross
In addition to the main profit/loss label, the script also displays two auxiliary labels. The "BuyPrice" label presents the buy price of the position as a red cross symbol on the chart, allowing users to easily identify their entry point. The "targetSell" label displays the target sell price as green cross symbol, indicating the desired exit point for the position. These visual markers help users visualize their trading strategy.
The script takes into account that users may only need this information displayed on the last bar, as continuous updates might not be necessary. By checking if the current bar is the last one, the script ensures that the labels are only displayed when relevant.
Limitations
The script assumes that trading is done using the same quantity; which is not always the case. This will change with subsequent updates.

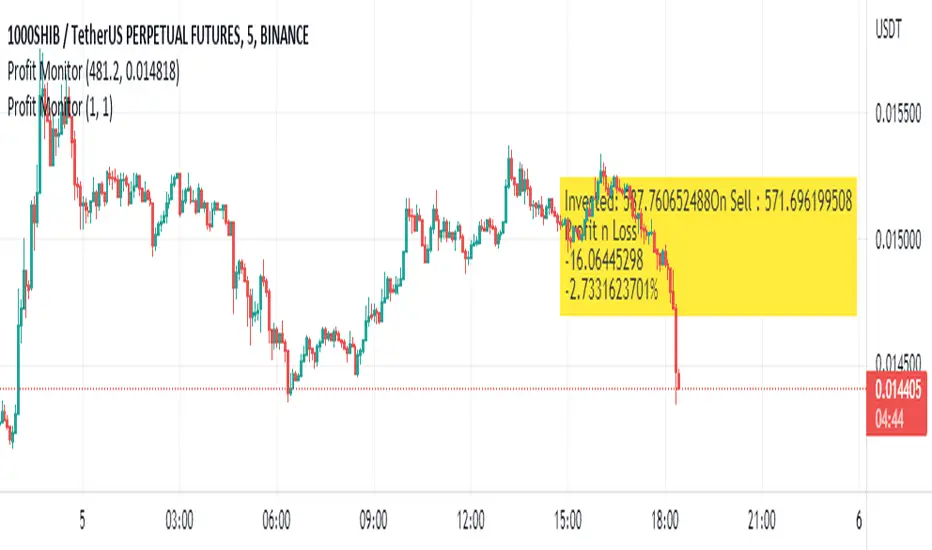
Profit MonitorProfit monitor refers to a tool or system used to track and analyze a company's financial performance, specifically its profitability. This can be in the form of software, spreadsheet, or dashboard that displays key metrics such as revenue, expenses, and net profit over time. The goal of a profit monitor is to give stakeholders, such as business owners, investors, or managers, a clear and up-to-date view of the company's financial health, enabling them to make informed decisions and identify areas for improvement.
BTC Profitable Wallets StrategyBTC Profitable Wallets Strategy - plots the percentage of profitable BTC wallets and places long orders when the profitable wallet share crosses above 50%, historically a very accurate point to catch the next Bull Run early.
The only setting is a smoothing option using the Moving Average method and length of your choice.
On Chain Data is queried from IntoTheBlock.
This is a 'HODL' strategy, with no exit given. If you'd like to see the historical performance check the Open Profit or place a sell order at the current date.

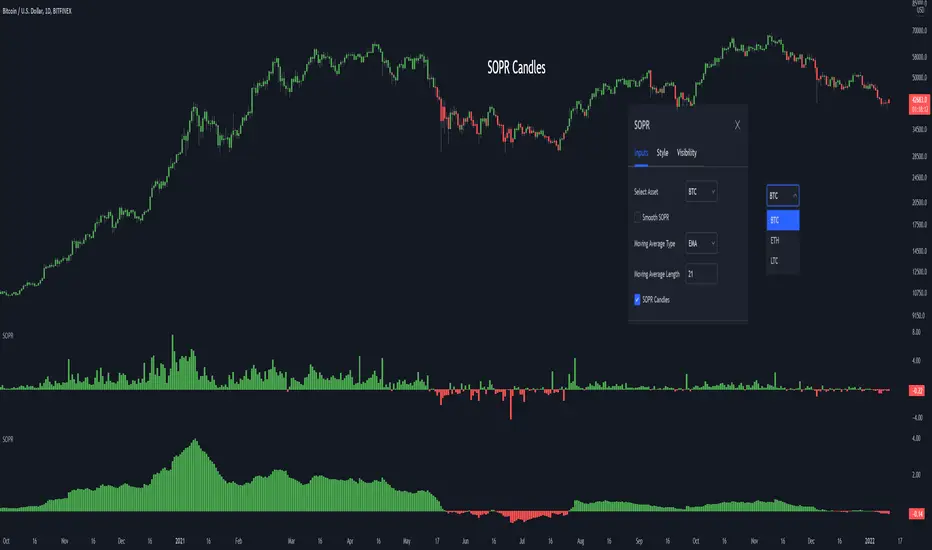
SOPR - Spent Output Profit RatioThe SOPR (Spent Output Profit Ratio) indicator provides insight into macro market sentiment, profitability and losses taken over a particular time-frame. It reflects the degree of realised profit for all coins moved on-chain.
SOPR is measured by considering only coins moved the timescale considered (daily, hourly etc), and taking the ratio between the fiat value at the time of UTXO creation, and the fiat value when the UTXO is spent.
SOPR values greater than 1 implies that the coins moved that day are, on average, selling at a profit (price sold is greater than the price paid).
SOPR value less than 1 implies that the coins moved that day are, on average, selling at a loss (price sold is less than the price paid).
You have the ability to see the SOPR of BTC, ETH and LTC. You can also smooth the SOPR using an EMA or SMA of your choice.
Thank you to both TradingView and Glassnode for adding all the on-chain data
Khair Day trade with profit lossBest used when applied for intraday trading. Users can customize length and deviation to fit their needs. Works best for high volatility stocks.
This strategy only works intraday intervals, so it means when you try to apply it to day/week/month it won't show any entry or exits.
Bollinger band breakout with non-standard deviation along with profit targets and stop loss.
There are 2 profit targets that can be adjusted based on individual preference.
This strategy minimizes risk and only opens trades when the probability of profitability is higher.

Fixed Percent Stop Loss & Take Profit % - For Study Scripts===========
Fixed Percent Stop Loss & Take Profit % - { FOR STUDY SCRIPTS! }
===========
A neat example of how to set up Fixed Stops and Take Profit as a percent of the entry price - This is for setting Alerts within your own Study Script for when either your SL or TP get hit.
Yup, that's about it!
You can ignore the actual entry/exit orders - they're based on a simple MA cross and are therefore NOT relevant, NOT profitable and NOT recommended!
You should be using this code as a way of adding Stops and Takes to your own scripts - hope it helps!
Set your "Open Long/Short" Alerts to be triggered "Once per Bar Close" - Set your "SL/TP" Alerts to trigger "Once per Bar".
--
We wrote this with a bit of a rush on! ~ If you spot any mistakes/bugs just let us know and we'll get round to them asap!
-----------
Good Luck and Happy Trading!

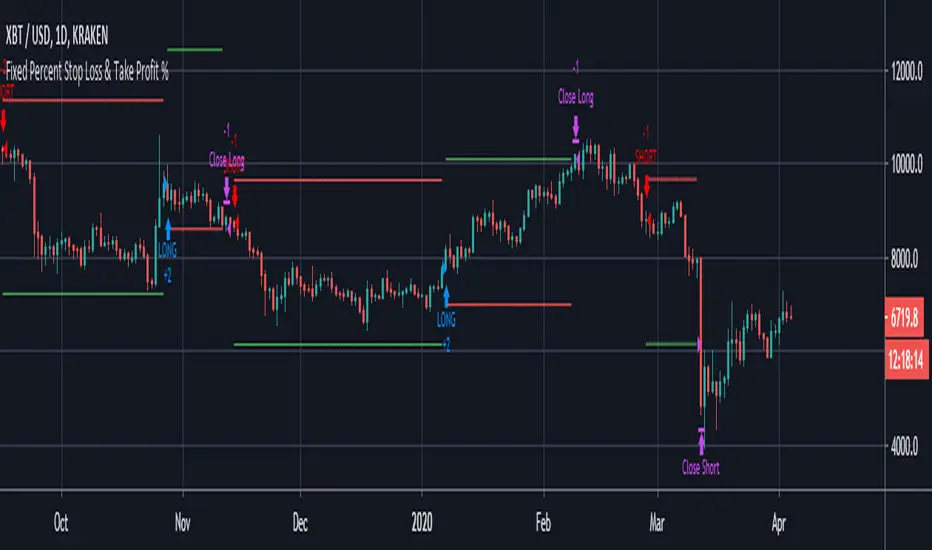
Fixed Percent Stop Loss & Take Profit %===========
Fixed Percent Stop Loss & Take Profit %
===========
A neat example of how to set up Fixed Stops and Take Profit as a percent of the entry price.
Yup, that's about it!
You can ignore the actual entry/exit orders - they're based on a simple MA cross and are therefore NOT relevant, NOT really profitable and NOT recommended!
You should be using this code as a way of adding Stops and Takes to your own scripts - hope it helps!
-----------
Good Luck and Happy Trading!


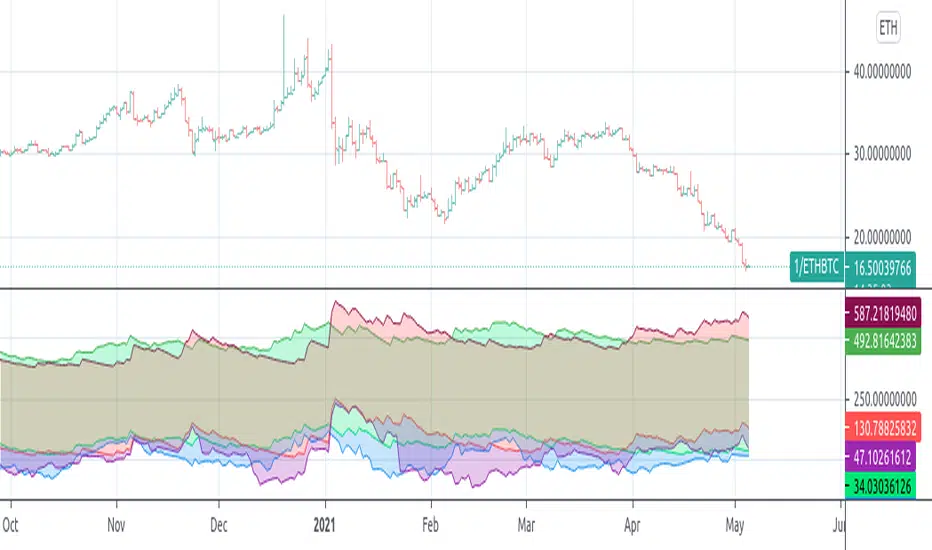
Altcoin Profitability Tracker 2Ever wonder which altcoins are performing better than Bitcoin? This script plots the profitability of 15 altcoins and BTCUSD so you can quickly determine where to invest your money.

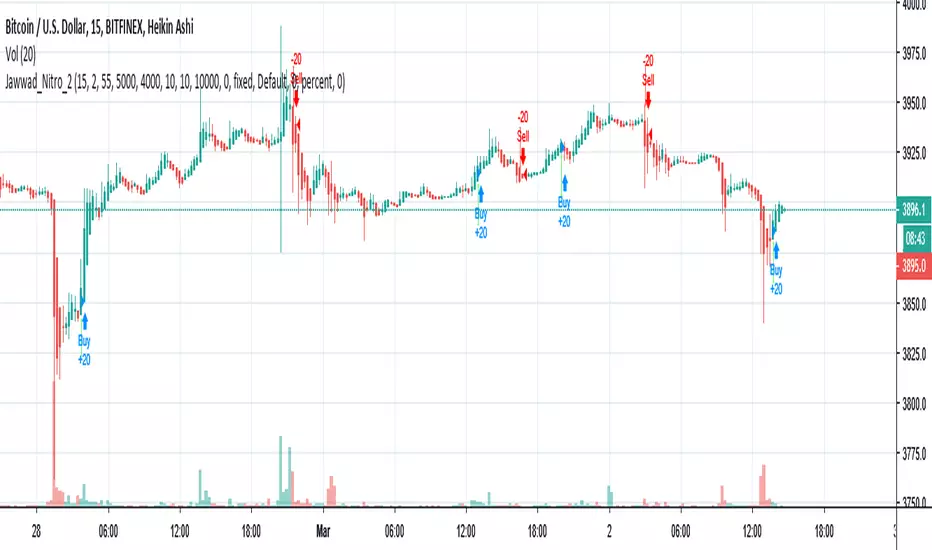
Jawwad Nitro_2 Crypto Forex Strategy - Highly ProfitableThis strategy is tested on selected crypto and forex pairs. It seems to be highly profitable and non-repainting. You can make some good money until you are following it properly and not playing with the settings.
1. Use 15 minute Heiken-ashi chart.
2. Apply the strategy.
3. Enjoy!!!
If this strategy works for you, please don't forget to buy me a cup of coffee... If you find anything wrong, please let me know. I shall be happy to fix it for you.
Cheers,
Jawwad
Eze Profit - VWAP + MACD Combined SignalThe Eze Profit - VWAP + MACD Combined Signal is an advanced trading tool designed to help traders align price trends with momentum confirmation for better decision-making. By combining Volume-Weighted Average Price (VWAP) and Moving Average Convergence Divergence (MACD), this indicator provides clear entry and exit signals, allowing traders to follow trends and take advantage of momentum shifts.
How It Works:
VWAP:
VWAP represents the average price of an asset, weighted by volume, over a specific period.
It acts as a dynamic support/resistance level and trend filter. Price above VWAP indicates bullish conditions, while price below VWAP suggests bearish conditions.
MACD:
MACD measures momentum through the difference between fast and slow exponential moving averages (EMAs).
Signals are generated when the MACD line crosses its signal line:
Bullish Crossover: Indicates increasing upward momentum.
Bearish Crossunder: Indicates increasing downward momentum.
Combined Logic:
Long Signal: Triggered when price is above VWAP, and MACD exhibits a bullish crossover.
Short Signal: Triggered when price is below VWAP, and MACD exhibits a bearish crossunder.
The script tracks the trader's "in-position" state to prevent redundant signals and ensure clarity.
How to Use:
Use this script to identify potential long and short trading opportunities:
Buy Signal: Enter a long position when the price moves above VWAP and MACD confirms bullish momentum.
Sell Signal: Exit or short when the price drops below VWAP and MACD confirms bearish momentum.
Combine with additional tools like support/resistance, volume analysis, or candlestick patterns for confirmation.
Features:
VWAP Trend Filter: Dynamically adjusts to the trading session to identify overall trend direction.
MACD Momentum Confirmation: Detects key momentum shifts with configurable settings for fast, slow, and signal lengths.
Position State Tracking: Avoids signal redundancy by monitoring open positions.
Buy/Sell Visualizations: Plots Buy/Sell signals directly on the chart for ease of use.
Alerts: Notifies traders in real-time when a long or short signal is triggered.
Customizable Settings:
MACD Fast Length, Slow Length, and Signal Smoothing parameters.
VWAP timeframe resolution to adapt to different trading styles (e.g., intraday or daily).
Credits:
This script is based on standard VWAP and MACD calculations provided by TradingView’s library and has been enhanced with unique logic for combined signal generation.
Notes:
This indicator is intended for educational purposes and should not be considered financial advice. Use it as part of a broader trading strategy alongside other tools for optimal results.

Partial Profit Calculator [TFO]This indicator was built to help calculate the outcome of trades that utilize multiple profit targets and/or multiple entries.
In its simplest form, we can have a single entry and a single profit target. As shown below in this long trade example, the indicator will draw risk and reward boxes (red and green, respectively) with several annotations. On the left-hand side, all entries will be displayed (in this case there is only one entry, "E1"). On the bottom, the "SL" label indicates the trade's stop loss placement. On the top, all target prices are displayed (in this case there is only one target, "TP1"). Lastly, on the right-hand side a label will display the total R that is to be expected from a winning trade, where R is one's unit of risk.
In the following example, we have two target prices - one at 18600 and one at 18700. You can input as many target prices as you'd like, separated by commas, i.e. "18600,18700" in this example. Make sure the values are separated by commas only, and not spaces, new lines, etc. As a result, we can see that the indicator draws where our profit targets would be with respect to our entry, E1. The indicator assumes that equal parts of the trade position are taken off at each target price. In this example on Nasdaq futures (NQ1!), since we have 2 target prices, this would be equivalent to assuming that we take exactly half the trade position off at TP1, and the remaining half of the position at TP2.
If we wanted to take more of the position off at a certain target, we could simply duplicate the target price. Here I set the target prices to "18600,18600,18700" to enforce that two thirds of the position be taken off at TP1 and TP2, while the remaining third gets taken off at TP3.
We can also show outcome annotations to describe how much R is generated from each possible trade outcome. Using the below chart as an example, the stop loss indicates a -1R loss. The total R from this trade criteria is 1.33 R, and each target price shows how much R is being generated if one were to take off an equal part of the position at said target prices. In this case, we would generate 0.17 R from taking one third of the position off at TP1, another 0.5 R from taking one third of the position off at TP2, and another 0.67 R from taking the remaining one third of the position off at TP3, all adding up to the total R indicated on the right-hand side label.
Using multiple entries works the same way as using multiple target prices, where the input should indicate each entry price separated by commas. In this example I've used "18550,18450" to achieve an average price of 18500, as indicated by the "E_avg" label that appears when more than one entry price is utilized. We can also opt to display risk as dollars instead of R values, where you can input your desired risk per trade, and all values are shown as dollar amounts instead of R multiples, as shown below with a risk per trade of $100.
This is meant to be an educational tool for trades that utilize multiple profit targets and/or entries. Hope you like it!

Volatility Adjusted Profit Target
In my 'Volatility Adjusted Profit Target' indicator, I've crafted a dynamic tool for calculating target profit percentages suitable for both long and short trading strategies. It evaluates the highest and lowest prices over the anticipated duration of your trade, establishing a profit target that shifts with market volatility. As volatility increases, the potential for profit follows, with the target percentage rising accordingly; conversely, it declines with decreasing volatility. As a trader, setting an optimal Take Profit level has always been a challenge. This indicator not only helps in determining that level but also dynamically adjusts it throughout the trade's duration, providing a strategic edge in volatile markets.

ATR profit and loss linesWhat is ATR?
Taking a candlestick, the following 3 transactions are calculated:
1-The difference between the high of the day and the low of the day
2-The difference between today's high and yesterday's close
3-The difference between today's low and yesterday's close
Atr takes the average of these 14-day candlesticks after making their calculations and it predicts how high or low a candle can go and these give us support and resistance helps with points
If you have noticed a rise in your chart and have no idea how high it will go, you can use Atr profit and loss lines.
The red zone is the stop point, the blue zones are the snow zones.
Must be used with macd. macd is validator.
There is an increase in your chart, you opened the atr profit and loss lines upwards and if macd gives you an increase, it is recommended that you enter the trade at that time. It is recommended to increase your loss line 1 step in the direction of profit every 2 profit breaks on atr profit and loss lines.
ATR Nedir?
Bir mum barı ele alınarak şu 3 işlem hesaplanır:
1-Günün yükseği ile günün düşüğü farkı
2-Günün yükseği ile dünün kapanışının farkı
3-Günün düşüğü ile dünkü kapanışın farkı
ATR ise 14 günlük bu mum barlarının hesaplarını yaptıktan sonra ortalamasını alır ve bir mumum ne kadar yükselip düşebileceği konusunda tahmin verir ve bunlar bize destek ve direnç noktaları konusunda yardımcı olur
Eğer grafiğinizde bir yükseliş farketmişseniz ne kadar yükseleceği konusunda fikriniz yoksa Atr kar zarar çizgilerini kullanabilirsiniz.
Kırmızı bölge durdurma noktası,mavi bölgeler kar bölgeleridir.
Macd ile birlikte kullanılmalıdır.macd doğrulayıcıdır.
Grafiğinizde yükseliş var,atr kar zarar çizgilerini yukarı yönlü açtınız ve macd size yükseliş veriyorsa işte o sırada işleme girmeniz tavsiye edilir.atr kar zarar çizgilerinde her 2 kar kırılımında bir zarar çizginizi kar yönünde 1 kademe arttırmanız önerilir

Manual PnL (Profit and Loss) % Tracker - spot long only
This is a manual profit and loss tracker. It takes the user's manual input of total cost and quantity, and then outputs a table on the bottom right of the chart showing the profit or loss %, average purchase price, gross profit or loss, and market value.
Instructions:
1. Double click the indicator title at the top left of the chart
2. Select the "Inputs" tab and click the empty field next to "Symbol" to enter the traded symbol+exchange. This entry MUST be the same as the chart you are on, for example BTCUSDT/BINANCE (indicator will not display otherwise)
3. Enter the Total Cost and Qty of shares/coins owned
4. Optional - change positive or negative colors
5. Optional - under the "Style" tab, change the color of the average price (AVG) line
Note that for the average price (AVG) line to be shown/hidden you must enable/disable "Indicator and financials labels" in the scales settings.
For crypto or other tickers that have prices in many decimal places I would suggest, for the sake of accuracy, adjusting the decimal places in the code so that for prices under $1 you will display more info.
For example let's say you purchase x number of crypto at a price of 0.031558 you should change the code displaying "0.00" on line 44 to "0.000000"
This will ensure that the output table and plotted line will calculate an average price with the same number of decimals.

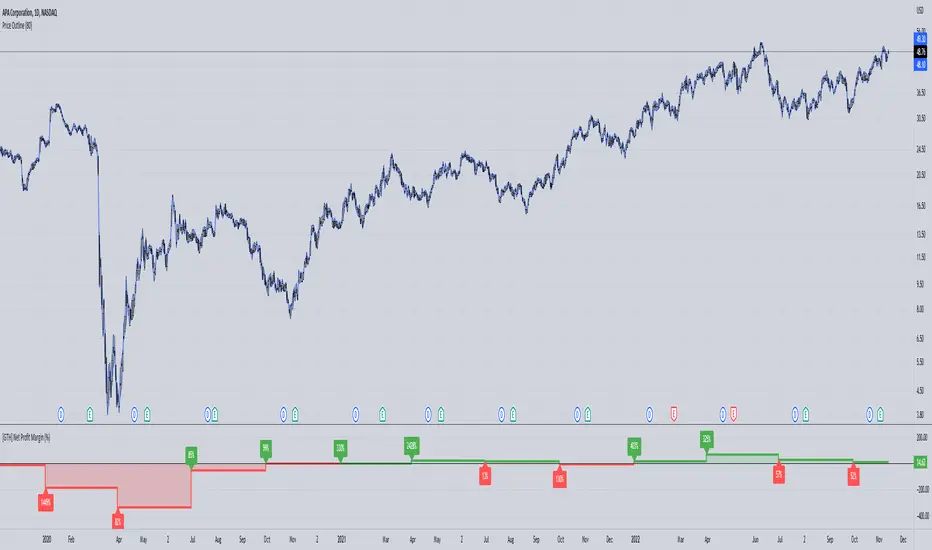
[GTH] Net Profit Margin (%)Displays the Net Profit Margin in a more "readable" fashion than the built-in TV Indicator.
This indicator concludes the series of 'Minervini-indicators', consisting of "GTH Earnings", "GTH Revenues" and "GTH Net Profit Margin (%)".
Famous trader Mark Minervini repeately describes rising earnings, revenues and net profit margin as the most important financials for finding superperformers.
In case of reporting a malfunction: Please be specific. Statements like "does not work" are useless. Thanks.
Artharjan Profit & Loss CalculatorHi,
Artharjan Profit and Loss Calculator allows users to calculate Profit and Loss of their trades and see it on the chart itself
Users are supposed to select either Long or Short, Enter quantity and enter traded price. The live P&L will be plotted on the chart.
Happy trading :-)
Rahul

Indicator - ATR Profit Loss - DGHi Traders,
This is an on chart indicator that can be used for setting take profit and stop losses very easily using the Average True Range Indicator (ATR). Using a volatility adjusted TP and SL will allow you to set your targets and losses based on market conditions. In the settings, you are able to adjust how much of a multiplier you require depending on your risk tolerance and strategy. For those that follow the NNFX method, the defult settings are preset to 1xATR TP and 1.5xATR SL.
How to use:
- For longs, 'isLong' box must be ticked, for shorts, this box is unticked
- For longs, green line is TP, red line is SL
- For shorts, red line is TP, green line is SL
Regards,
Dillon Grech

BT Profit Sniper 3.0BT Profit Sniper 3.0 is a completely new strategy built from the ground up as a successor to previous 1.0 and 2.0 versions of Profit Sniper.
Offering up huge improvements, including multiple position triggers, derived from Bollinger Bands and Chande Momentum as well as our own bespoke stochastic ribbons that provide trend pivots . Another big decision was to remove the MACD from the indicator package, as invariably users preferred using the built-in MACD .
So how does it work?
3.0 operates off two timeframes in parallel, your Trend Timeframe (Higher Timeframe concerned with identifying market up & down trends), and your Trade Timeframe (Lower Timeframe to actually backtest Longs & Shorts in).
Within each timeframe, you can tailor your preference for waiting for either Stochastic Ribbon cross only, or Ribbon Cross followed by Chande Confirmation for that additional market structure confidence.
You also have the option to trade with trend so the indicator will automatically flag & alert only Shorts in a Short trend, and Longs in a Long Trend.
User parameters allow traders to add trailing stop, toggle between percentage and USD value, providing higher accuracy in the forecast rate.
If you would like access, please send me a PM.

Profit HarbingerProfit Harbinger is privately owned paid indicator on trading view, It is what I consider to be the current precipices of my trading journey. After years of trading stocks and crypto working tirelessly to perfect my strategy it was only after really sitting down with my mentor and teacher that we developed the alpha version of this strategy. After working for what seemed like forever on the math, and code. I developed this indicator to work in my stead. This indicator is the development of the aforementioned strategy converted into a machine to take all the emotions out of trading the various trade-able assets.
