[ALL-IN-ONE] Algorithmic S/R and Pivots and Long Term LevelsHello my trading padawans.
Hope you're all having a blast
Here's the invite-only script of the week. The ALL-IN-ONE saga continues with another script.
This time, I compiled a lot of algorithmic supports and resistances (S/R) - to be used with any indicators out there.
Those S/R are universal and work with all asset classes (FOREX, CRYPTO, INDICES, STOCKS, COMMODITIES, ...)
No one can predicts which S/R will stop a move - generally - the high timeframes S/R + the SMAs with a big input value - work as strong walls often forcing the candles to retrace a bit short-term.
At Today's post (October, 25th 2019 - 12 pm UTC-4), we see how useful they were, to identify how high BTC/USD could go before retracing.
I. 💎 SCRIPTS ACCESS 💎
1.🖐️ Access can only be requested through my website.
2.🖐️ My website URL is in this script signature at the very bottom (you'll have to scroll down a bit and going past the long description) and in my profile status available here : Daveatt
3.🖐️ A tutorial article/video will be provided on those sub mentioned links + Tradingview
4.🖐️ You obviously can contact me directly for more information
II. 🔎 ALL-IN-ONE Supports and Resistances 🔎
You can display the algorithmic S/R, and/or pivots, (not finished yet) and the long terms levels.
For the 3 types of S/R, I pre-selected those that I think are the most relevant and useful for everyone. Please let me know if you'd like me to add/remove some.
All those listed by default are important and provide a MAP for a trader.
They give great take profits zones, levels where it's better to wait for a pullback before entering.
2.1 👁️🗨️ S/R mode 👁️🗨️
Each type of S/R can be displayed or not.
2.2 📱 Mobile optimized display 📱
Preview : imgur.com I posted 2 images there
The script is made using the newest version of Pinescript, and displaying small labels for every support/resistance.
✨ This will come in handy for mobile users - they'll get nice looking labels displayed at the right of their chart.
Each S/R type have its own labels and label position. The script users can activate/deactivate them at will
Let's review quickly each one.
2.3 Algorithmic SMAs
I cherish, love, sometimes despite them, but they're very relevant for all asset classes. The tool displays as many relevant algorithmic and generic SMAs that I could think of.
The indicator lists about 18 different SMAs in multiple timeframes.
2.4 Pivots
7 pivots are displayed (S1/S2/S3/P/R1/R2/R3)
You can choose one of 4 pivot point types:
- Traditional
- Woodie
- Fibonacci
- Camarilla.
The fun doesn't stop here. You can also select a timeframe between Daily/Weekly/Monthly/Yearly for those pivots.
For INDICES, for example, I use a lot the daily Traditional Pivots.
2.5 Long Terms Levels
Display by default the highest/lowest weekly/monthly/quarterly/monthly levels.
The scripts user can chose to select the previous highest/lowest also.
-------------------------------------------------------------------------------------------------------------------------------------
If you have any doubts or questions, please hit me up directly or ask in the comments section of this script.
I'll never claim I have the best trading methodology or indicators.
You only will judge and I'll appreciate all the questions and feedback you're sending my way.
They helped me a ton for developing indicators based on all the requests I received.
May the force 💪 be with you all 🥳.
Dave
Cerca negli script per "profit"

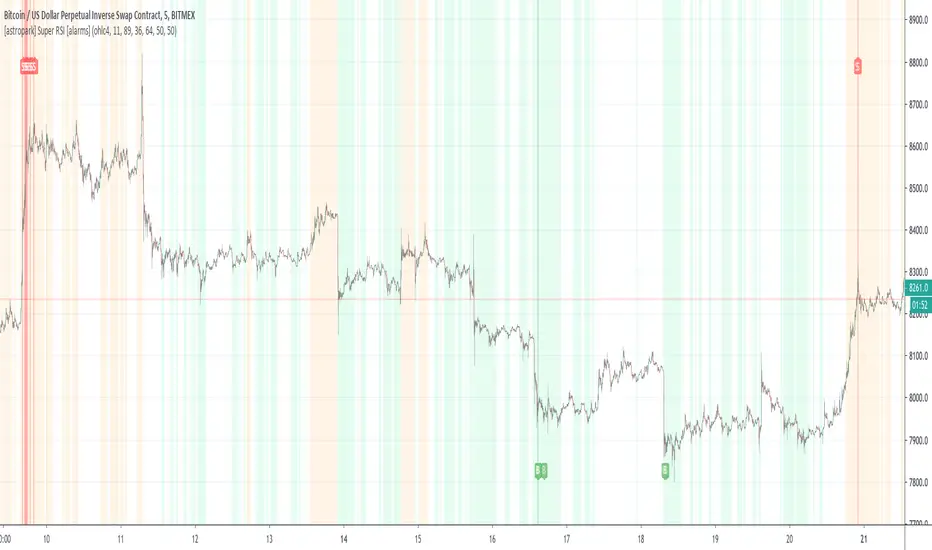
[astropark] Super RSI [alarms]Dear Followers,
today a new Scalper Tool , which works great on 3 minutes and 5 minutes timeframes , but also down to 1m and up to 30m!
I called it " Super RSI ", as it is based on RSI and inherits some basic functionality from it.
If you check its settings, you will see that you can have 3 different buy-sell sources (first two are active by default):
STRONG BUY/SELL : buy when white area deeply falls into oversold-red zone and sell when white area gets into overbought-green zone (you can set and edit at which level oversold and overbought zones start);
CROSSES : buy when the black RSI line in the middle between red and green area cross under the buy cross limit value and sell when it crosso over the sell cross limit value (you can set and edit specific cross ranges for both buy and sell);
WEAK BUY/SELL : buy when green area at least go below 50 level and sell when red area at least goes above 50 level (you can edit both levels); these conditions are highlighted as background color and are very useful for taking (at least partial) profits in trades.
By default the script will be placed as overlay on the chart, but
> you can activate the oscillator plot by disabling the "hide all plot" option
> and place it in a below pane by clicking on the black arrow at then end on the indicator name in chart and selecting "move to -> a new pane below"
This strategy can trigger till 10 buy or 10 sell signals in a row before reverting, so use a proper money management .
Strategy results are calculated on 20 trading days using 1000$ as initial capital and working at 10x leverage.
The user who wants to use this strategy, especially via an automated bot, must always set a stoploss at 3-5% from entry point or use a proper risk management strategy .
This is not the "Holy Grail", so use it with caution.
This script will let you set all notifications you may need in order to be alerted on each triggered signals.
The backtesting script version of this indicator, which will let you backtest this script and find best settings for your preferred market, can be found here below:
This is a premium indicator , so send me a private message in order to get access to this script .
[astropark] Super RSI [strategy]Dear Followers,
today a new Scalper Tool , which works great on 3 minutes and 5 minutes timeframes , but also down to 1m and up to 30m!
I called it " Super RSI ", as it is based on RSI and inherits some basic functionality from it.
If you check its settings, you will see that you can have 3 different buy-sell sources (first two are active by default):
STRONG BUY/SELL : buy when white area deeply falls into oversold-red zone and sell when white area gets into overbought-green zone (you can set and edit at which level oversold and overbought zones start);
CROSSES : buy when the black RSI line in the middle between red and green area cross under the buy cross limit value and sell when it crosso over the sell cross limit value (you can set and edit specific cross ranges for both buy and sell);
WEAK BUY/SELL : buy when green area at least go below 50 level and sell when red area at least goes above 50 level (you can edit both levels); these conditions are highlighted as background color and are very useful for taking (at least partial) profits in trades.
By default the script will be placed as oscillator on a specific pane below the chart, but
> you can disable the oscillator plot by enabling the "hide all plot" option
> and place it as overlay on chart by clicking on the black arrow at then end on the indicator name in chart and selecting "move to -> existing pane above"
This strategy can trigger till 10 buy or 10 sell signals in a row before reverting, so use a proper money management .
Strategy results are calculated on 20 trading days using 1000$ as initial capital and working at 10x leverage.
The user who wants to use this strategy, especially via an automated bot, must always set a stoploss at 3-5% from entry point or use a proper risk management strategy .
This is not the "Holy Grail", so use it with caution.
This script will let you backtest the strategy and find best settings for your preferred market.
The alarms script version of this indicator, which will let you set all notifications you may need in order to be alerted on each triggered signals, can be found by searching for " Super RSI".
This is a premium indicator , so send me a private message in order to get access to this script .

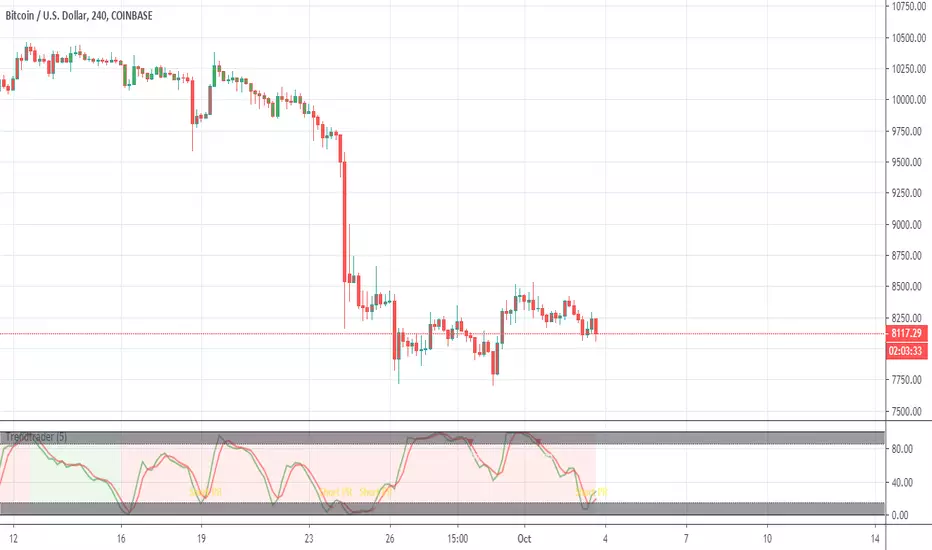
Trendtrader with profit/rentry==Strategy==
Adjust trend code until the majority of the up-trends are green and the downtrends are red. Take 20% profits at the first and second take profit levels while leaving the rest of the trade in until close.
==Indicator includes==
EMA cross, trend analysis, stoc-RSI TP and re-entries.
==Credits==
Trade Indicators for the strategy, jhanson107, for the trend indicator, and Zekis for helping with the TP and re-entries.
Ori Bitcoin Mining ProfitabilityThis indicator shows Mining Profitability USD/Day for 1 THash/s. Have options to toggle line/trend view, log on/off and smoothing for line view.

Long Short Double strategyLong Short Double strategy
Long short strategy with stoploss and take profit.
I use this script for 5min btcusd on Bitmex. (The strategy also works on other exchanges, with some small adjustments in RSI)
Leverage 10x 375% profit in 2 weeks. NO REPAINT.
U can Adjust the RSI for long and shorts entry`s.
Study is Autoview ready. send me a PM for Paid access.
If you like this strategy buy me a Pizza, Dinner, or lambo:)
BITCOIN: 3BMEXTEMinsUUqUwr9GEjNA6ZBsVXB1g6u
LITECOIN: LdG82pyEMMji9Bynw3hvWgUshbMKfiFdJw

MarketSpy XMarketSpy trading suite was designed to sniff out momentum swings and allow you to profit riding the wave. No matter what market, no matter the timeframe - this is all you need, from here on out this is your trading desk.
It's made up of three main components (with future add-ons in development):
1. MarketSpy X - the ultimate entry and exit tool that is built using custom momentum algorithm to find exact moments of reversals - without a fail. It's the one on the bottom with "green pulse dot" buy signals and "blood diamond" sell indicators.
2. MarketSpy ARmageddon (Augmented Reality) - price action overlay that analyses trends and is a confirmation tool for MarketSpy X. Can show confluence from top 5 market indicators, gives signals of reversals or chop zones, predicts prices(!) and is fully dynamic that reacts to market conditions LIVE.
3. MarketSpy S/R - This thing sniffs out and draws support and resistance based on math, not human eye. This means that MarketSpy effectively can go head to head with bots and algorithms and see right through the market to give you incredibly accurate points of interest where machines and humans sell and buy - ride the way together with the whales. Sounds cliche until you try it.
For more - visit our discord.

Direction Power StrategyThis strategy is based on the very well known ADX indicator, some risk management was applied, TP, SLand the most vital, trail stop.
If you have any questions let me know!
Ah, ps. It works better on longer timeframes, tried it also on shorter timeframes but becomes less profitable

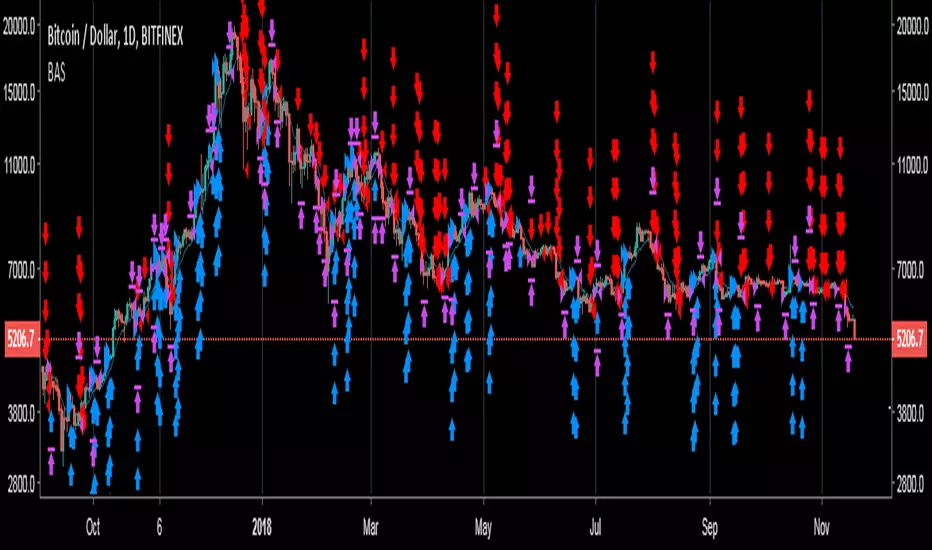
What is ProfitableBTC, BNB or your favorite Alt Coin? This indicator shows what is profitable at the moment. Red bars are alt days, green bars are BTC days. Otherwise, it is a BNB day.
Hmm, most of the time it is a BNB day!

9 Seasons Rainbow Multiple Time Frames Pattern DEMO [9SRDEN]The indicator discovers profitable patterns by associating Price Season of multiple time frames.
Full Name: 9 Seasons Rainbow - Multiple Time Frames Associated Price Wave Pattern Indicator
This is redefined from “9 Seasons Rainbow Indicator DEMO”, with clearer definition of 9 Seasons and user manual.
Version: DEMO
Language: English
Copyright: 2019
---------- How to use the indicator ----------
Go through the manual and related ideas underneath or follow the tutorials list. Look through the profitable patterns and related cases, wait for or set alert for specific profitable pattern.
---------- Definition: 9 Seasons ----------
A life cycle of Price Wave is divided into 9 Seasons. Each time frame, from 5 minute to 1 month, has 9 seasons, Independent of each other:
Bull (Green)
Bull Pullback (Light Green): a pullback or retracement
Resistance / Overbought (Yellow): a resistance area, may become a Top, or be broken through.
Crazy Bought (Lime): Price is going up in a high volatility, could be a valid breakout, or a Bull Trap.
Neutral (White): a wandering season without direction, evolves into Bull or Bear
Bear (Red)
Bear Bounce (Light Red): Price bounces
Support / Oversold (Blue): a support area, may become a Bottom, or be broken through.
Crazy Sold (Fuchsia): Price is going down in a high volatility, could be a valid breakdown, or a Bear Trap.
---------- Some important evolution between seasons ----------
Resistance / Overbought (Yellow) -> Crazy Bought (Lime):
Bull is breaking through a resistance.
Crazy Bought (Lime) -> Resistance / Overbought (Yellow):
This normally indicates a failed breakout, Price goes back to the resistance.
Crazy Bought (Lime) -> Bull Pullback (Light Green):
This normally indicates Price has risen to a new level
Support / Oversold (Blue) -> Crazy Sold (Fuchsia):
Bear is breaking through a support.
Crazy Sold (Fuchsia) -> Support / Oversold (Blue):
This normally indicates a failed breakdown, Price recovers to the support.
Crazy Sold (Fuchsia) -> Bear Bounce (Light Red):
This normally indicates price has dropped to a new level
---------- Rainbow Ribbons for Multiple Time Frames ----------
Each ribbon of a rainbow represents a time frame.
The uppermost ribbon represents the shortest-term time frame - current time period of the chart, which is the time frame for trading.
The lowermost ribbon represent longest-term time frame, which work as environment, together with the other medium-term and long-term time frames.
The difference between two frames is 1.4142 fold (square root of 2), if level 1 is 15 minute, level 2 is 15 minute * (square root of 2) .
Examples of time frames in a rainbow:
For STANDARD in 15M: 15M - 21M - 30M - 42M - 60M(1H) - 85M - 120M(2H) - 170M
For PRO in 15M: 15M - 21M - 30M - 42M - 60M(1H) - 85M - 120M(2H) - 170M - 240M(4H) - 339M - 480M(8H) - 679M
---------- Trading Methods ----------
How to open a Long position?
When a profitable Long pattern appears, open small position first based on signal on shortest-term time frame; after retesting and confirming the support, open 2nd position; when it breaks through the resistance, pullbacks and confirms the breakout, open 3rd position.
How to exit a Long position?
Lift the Stop to a confirmed higher low, so that to take advantages of the bull run as possible.
How to open a Short position?
When a profitable Short pattern appears, open small position first based on signal on shortest-term time frame; after retesting and confirming the resistance, open 2nd position; when it breaks through the support, bounces and confirms the breakdown, add 3rd position.
How to exit a Short position?
Lower the Stop to a confirmed lower high, so that to take advantages of the bear run as possible.
---------- Versions Description ----------
The features may change later without advance notice.
PRO:
Invite-Only, with the following advanced features:
12 Ribbons Rainbow displays 9 Seasons of 12 time frames on a chart.
Advanced alert sets allows set alerts on short-term, medium-term, and long-term time frames.
Capability to input different trading instrument to compare with the current ticker.
Full time periods access allows apply it to broadest time periods, from 1 minute to 1 week (if history data is enough)
More new features in updates.
STANDARD:
Invite-Only, with the following advanced features:
8 Ribbons Rainbow displays 9 Seasons of 8 time frames on a chart.
Advanced alert sets allows set alerts on upper and lower frames.
Broad time periods access allows apply it to the most popular time periods, from 15 minute to 1 week (if history data is enough)
More new features in updates.
DEMO:
DEMO version is for trial purpose, having most of the features.
It is applicable to a list of trading instruments and specific time periods (1 hour to 1 day), which may change later without advance notice.
---------- Access to Indicators ----------
Please use DEMO version for Trial
Asking access to Invite-Only PRO and STANDARD versions:
9seasonsrainbowindicator.blogspot.com
Or contact the author.
---------- Install Invite Only: STANDARD & PRO Version----------
Ask access to STANDARD or PRO version
Open the chart -> Indicators (On the Top) -> Invite-Only Scripts (2nd button of the left bar)
Like/Favorite the indicator
Click to install on the chart
---------- About Loading Time ----------
It may take up to 2 minutes for your browser to load a new setting, depending on the your computer and network speed.
---------- List of the author's Indicators ----------
www.tradingview.com
---------- Disclaimer ----------
By using or requesting access to the indicator, you acknowledge that you have read and accepted that the indicator and any related content, including but not limited to: user manual, tutorials, ideas, videos, chats, emails, blog, are for the purpose of trading strategies studying and paper trading.
If a customer or user uses the indicator or related content mentioned above for live trading or investment, she/he should take all risks and be responsible for her/his own trading and investment activities.
---------- Updates ----------
The latest updates override the previous description.
To activate a update: Close the browser, Reopen the chart and apply the indicator.

Scalping Grid at Pivot Point FibonacciThis strategy sets a grid of stop orders once price touch one Fibonacci weekly pivots.
This works very well for scalping as the price touch a pivot level.
Take care when you work with grids because drawdown could be very high.
Study with alarms is available at request.
Please use comment section for any feedback.
Next improvement (only to whom is interested to this script and follows me): study with alerts on multiple tickers all at one. Leave a comment if you want to have access to study.
********************************** IMPORTANT*******************************
I have developed an expert advisor for metatrader4 (MT4) and for jforex platform: results of expert advisor form 2015-01-01 to 2018-11-25 are very good with low drawdown and good profit.
********************************************************************************

Ingenious SMA CrossoverIntroduction
A popular use for moving averages is to develop simple trading systems based on moving average crossovers. A trading system using two moving averages would give a buy signal when the shorter (faster) moving average advances above the longer (slower) moving average. A sell signal would be given when the shorter moving average crosses below the longer moving average. The speed of the systems and the number of signals generated will depend on the period of the moving averages.
What is this tool?
This tool is a crossover system of two simple moving averages. I called it "Ingenious" because it uses a decision tree-based algorithm under the hood to find and plot the most profitable SMA combination.
It analyzes the range of periods between 4 to 45 and backtests each combination across the entire history of an instrument. If the more profitable periods were detected the indicator will switch periods of the moving averages to the found ones immediately.
NOTE : It does not change what has already been plotted.
Good luck!

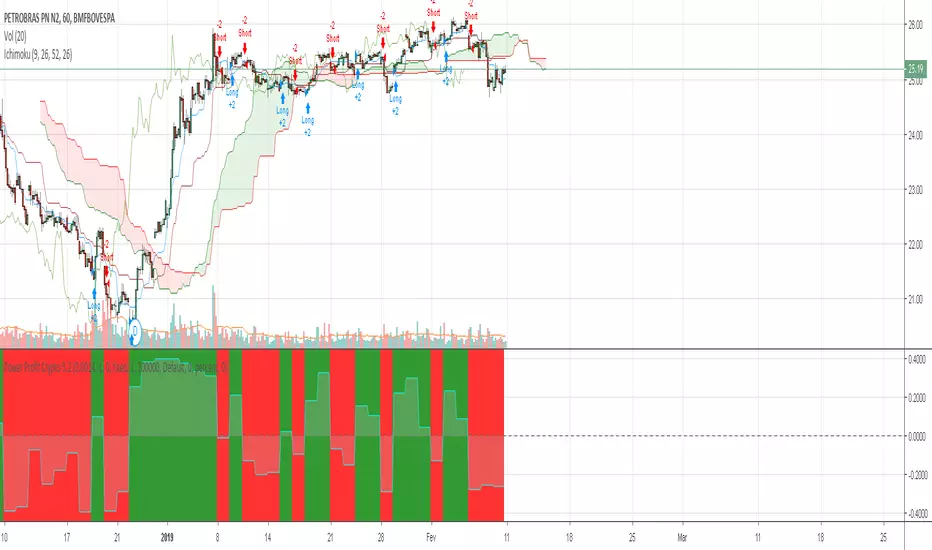
Power Profit Crypto 5.2Contact me if you wanna test and buy my indicator! 70% wins! - NOW GOOD TO USE ALSO WITH BTC! . - LTC - ETH - NEO - XMR - ZEC - ETC -
PRICE?? End of this page !!
-------------------------------------------------------------------------------------------------------------------------------ENGLISH ---------------------------------------------------------------------------------------------------------------------------------------------------------
After 2 years working on the codes, excluding weak indicators for Cryptos, and investing in programming and trade knowledge in the Crypto market .... HE is READY!
Its is possible earn money, even in down markets!!!!!!!!!!!!!!
Power Profit Crypto 2019 is a UNIQUE indicator and incomparably more profitable than the others. Do you know why? It was not designed for wallstreet, it was carefully planned for the great Crypto and Forex volatility , and of that very peculiar market. He is the FIRST INDICATOR DEDICATED ONLY FOR CRYPTOS and Forex
It is only being sold today, due to having passed all TradingView.com tests. With a minimum 70% hit, this indicator will change your life in this market, and avoid what happens with many people: Lose lots of money and give up investing in the best variable market on the planet.
Work better in 1hr charter or higher charter times. (2hr , 4hr)
Please contact me! That way you can test for-24hrs! Then you can put it on the backtest of TradingView.com to prove its effectiveness!
WHATSAPP +55 71 98644-1234
$$$$$ Price : WAS 800 usd ..... for this week just 300 usd ( Pay with BTC LTC - ETH - NEO - XMR - ZEC - ETC
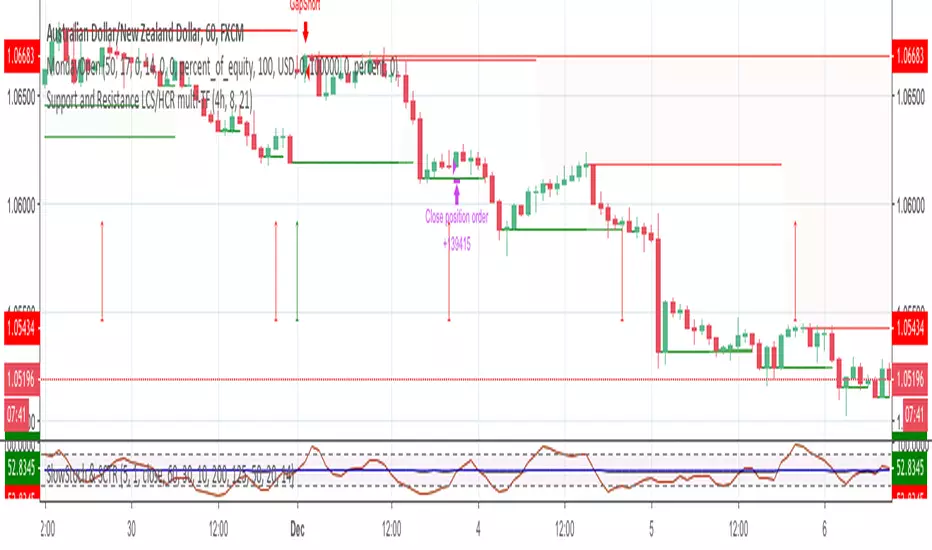
MondayOpen Gap strategyThis strategy open orders on first bar of the week if there is a gap with Friday close price.
First bar could be on Sunday or on Monday, it depends on broker time.
Adjust starting hour with broker time. Use arrows to help finding correct broker time.
Also you should adjust gap size and exit hour.
Do not place on Daily charts.
Please use comment section for any feedback.
Next improvement (only to whom is interested to this script and follows me): study with alerts on multiple tickers all at one. Leave a comment if you want to have access to study.
********************************** IMPORTANT*******************************
I have developed an expert advisor for metatrader4 (MT4) and for jforex platform: results of expert advisor form 2015-01-01 to 2018-11-25 are very good with low drawdown and good profit.
********************************************************************************
Bitcoin Trading Algo, 30,500% profit long + short. Beats HODLingREAD DISCRIPTION FIRST
Trading view have taken off the Invite Only options for scripts from free accounts and since I usually only like people I know using my scripts I have programmed my own password and Keycode system within pine script, the Keycode changes every month and is determined by a random number algorithm so you will need to know both the password and the keycode for the script to wok for you.
The objective for this strategy was to reduce the standard divination of bitcoin returns through risk management, this is done with both long and short trades. It looks to get on board when a trend is detected and adds to the position to average out all entry points. When the momentum begins to decelerate all trades are closed. 50% of these trades will usually be in profit and 50% will usually be a loss, however profits are 3x larger than losses.
To demonstrate that the deviation of retuns of the strategy is lower than hodling, I leaveraged the strategy to a similar drawdown level to hodling so that you can compare the two.
When risk adjusted, my strategy beats buy and hold returns by about 600%, although I am personally trading the strategy unleaveraged.
Most Profitable HelloEpicWorld v2.0[Eric] This is the most profitable un-repaint fully support auto trading Algo on earth.
Usage:
Buy and Sell && Stop Loss
1. When it shows buy, you can buy it immediately or wait for a small dump to buy it, stop loss at the red cross below.(Both buy and stop signal support alert autoview bots auto trading)
2. When it shows sell, you can sell it immediately or wait for a small pump to sell it, stop loss at the green cross above.(Both buy and stop signal support alert autoview bots auto trading)
Background Color:
It can be turn on and off in the settings. When it is green, you have a 78% probability to get a win trade on buying the pullback. And a 73% probability to get a win trade on selling the pullback when it's red. So, even missed the buy and sell signal, you can still open a trade in the middle, but I don't recommend this kind of trades, it's no good for Risk/Reward ratio. The best ratio is when the signal show up. Background color is more suitable using to hold your trades after entering.
Forex:
Bitcoin:
Altcoin:
MarketSpeed:
RSIC:

BTC Precognition - Mtrl_ScientistHello Everyone,
I have been interested in algorithmic trading for a while now, and have picked up coding in Python/C++ 2 years ago, which made it possible for me to understand Pine Script (Trading View's proprietary language) fairly easily. I got interested in Bitcoin in 2013, but have only started actually investing in mid 2017. Making money during a bull run is easy but it's really the bear market that teaches you a lesson. So I went about and tried to avoid losses in future bear markets by digging into the analysis of financial time series. I looked around and found useful books, examples of pine script code, technical analyses from fellow chartists and sought out to combine it all into algorithms that can help prevent losses during the next bear market.
I came up with several profitable scripts, but let this be the first one I'm actually sharing with you guys. It draws data from all major Bitcoin exchanges (Hence this script will ONLY work for BTCUSD ) and is based on CVI, Fractal Adaptive Moving Avergage ( FRAMA ), and some calculus operations to make sense of their relationship.
I tried to tidy the final version up as much as possible, so that it becomes straightforward to use. All you need to look at is when the bar becomes green/red, the bar height is just the integrated area since it's crossed the 0-line and can serve as a threshold on lower time frames to avoid noise.
I've got a degree in Chemistry, so don't take this as financial advice, but please do let me know what you think!
Note:
- This is a re-upload because the first version got pulled due to linking to Twitter
- Script works best with Hekin Ashi candles
Planned features:
- Reduce amount of signals on lower time frames
- Make it work better with normal candles
Suggestions?

Traders Profit Str.High-profitable strategy, but use at your own risk.
Strategy uses wma, macd, BB, ma, and so on.

[THE MECHANIC] : Buy small and continuously, profit trailThis script is entirely my own original work.
The script is intended for USDT crypto trades. It's hypothesis is that Alts usually go where BTC goes. So, this script considers indicators on a USDT paired ALT, and simultaneously considers BTC's USD movement to make a buy decision. The exact combination of indicators will not be disclosed.
It does not intend to seek the bottom AT ALL. It intends to buy early in upswings. Using profit trailing on a tool such as Gunbot, consistent profits of 2% to 5% is possible. Hourly charts or longer are recommended.
A stop loss is an absolute necessity, but can be set quite tightly because of the stated hypothesis.
Script access is controlled only because it is my terms of use that users provide feedback on their experience and make recommendations for improvement.

-- Simple and Profitable Cryptocurrency Trading Strategy --Script based on this strategy:
Based on 8EMA Close and Open with Weis Wave Volume by Lazybear indicator.
The script will let you know when to Long or Short the market.

{CDT} v1.0 - Opal Signal - 1D H/A TunedHighly profitable script, decent on all timeframes but designed specifically for Heiken candles on 1D timeframe.
No repaint.
7 day free trials available on request.
----------------------------------------------
*Use at your own risk & DYOR.

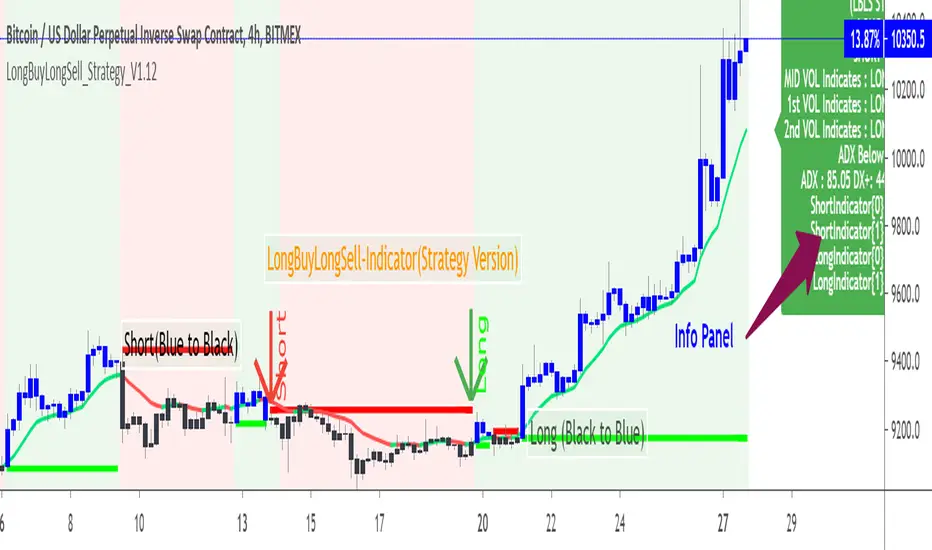
LongBuyLongSell 90% profit Excellent Win Rate Strategy indicatorI seldom prefer the strategy version ,As you have requested to share the backtest results sharing the details here for your info only. to check how the "LongBuyLongsell" indicator is working.
BTCUSD 30min time frame used ,Tested with Forex ,Equity results are >80% when right entry is predicted.
This is, published to show only the test results of the original "LongBuyLongSell" indicator that was published in tradingview initially on 27Jun.
The test scripts are only available to do testing by me and it is keycode protected,Here sharing the results of BTCUSD of 30min time frame with the improved logic in "longbuylongsell" indicator version.
This script cannot be used for generating Alerts realtime as tradingview does not support user "Alerts" in strategy scripts . So please get access for "longbuylongsell" indicator.
Information are shared to show the accuracy of this LongBuyLongsell Indicator.
No indicator will work 100% in all time ;Win rate will be 80% ; Just sharing this as a result here and as a performance report of LongBuyLongsell Indicator script available in Tradingview.
Again,This is shared only for info ,not to be used. If you wish to use the indicator check and get the access for the working "longbuylongsell" indicator version 1 and Version 2 and not to this.
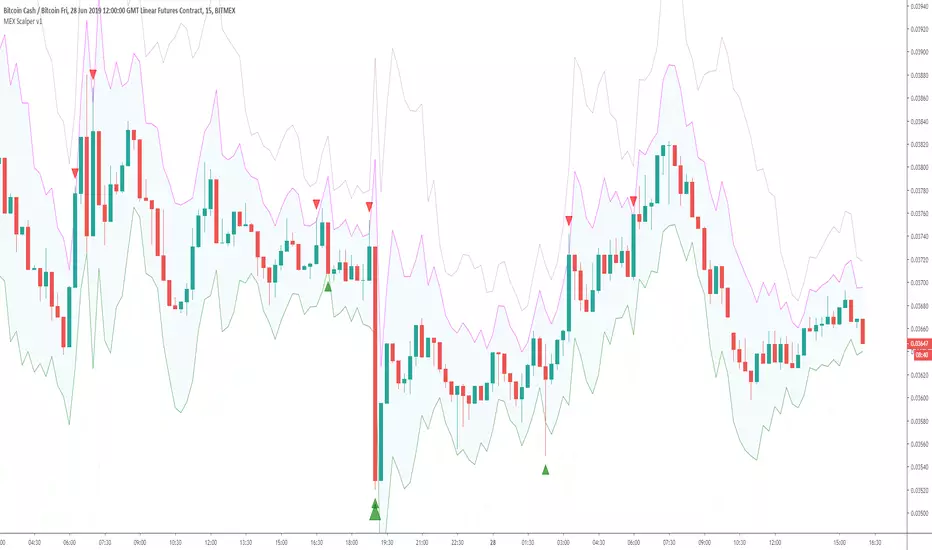
BitMEX Profit Scalper v1I keep getting asked to create a script for Scalping on BitMEX so here is the initial version!
Default settings created for XBTUSD 15m and designed for getting decent profits when using around a 10x margin.
Settings can be tweaked so you can alter this for any time frame
ACCESS For CryptoProTools.com members only!! (Visit our website if you wish to sign up)