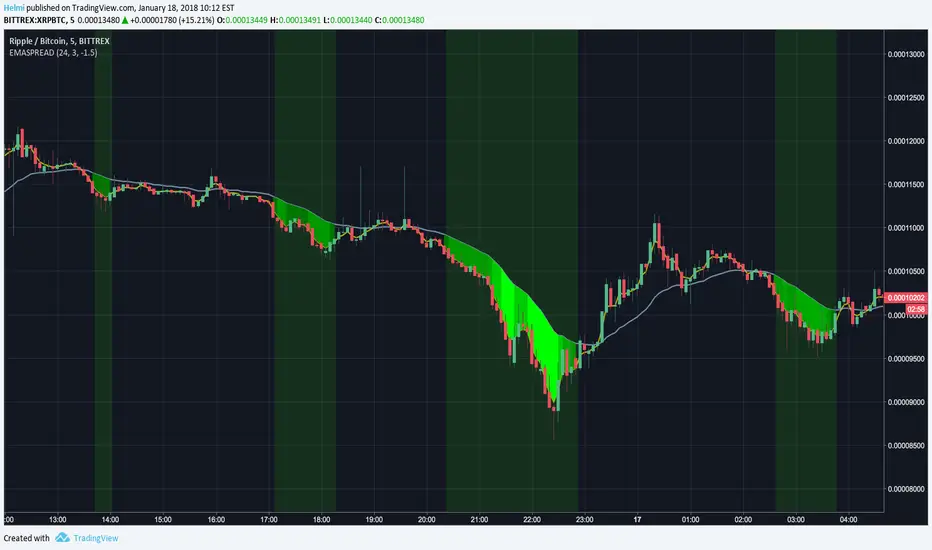
EMASPREAD (Profit Trailer)This is a flexible Visualizer for the EMASPREAD buy strategy how the Profit Trailer Trading Bot uses it.
It has configurable EMA Values and support both positive and negative EMASPREAD values. It also visualizes the level of EMASPREAD in both direction through colorized distinction.
Cerca negli script per "profit"
TrendCrypto (Profit)Segít beazonosítani a hatékony beszállási pontokat trendelő kriptopiacokon.
- Profit -

Hawkeye Grabba AutoGrab pips with Hawkeye Grabba
Grabba is a simple mechanical system that you can manage yourself, using your own risk and reward profile.
The Hawkeye Grabba is a risk management tool which provides traders with a visual representation of the risk-to-reward profile on every trade.
For example, you can apply your own profit targets (say 10 pips) and each line will show you that multiple.
As with all the Hawkeye Indicators, Grabba can be applied to any timeframe and any chart and can be custom set to be used on any market, i.e. Forex, stock indices, commodities, etc.

HMA_PPT StrategyHMA_X & Pivot Profit Taker combo
LOL!
change the settings to suit your favorite pair/TF before cry yourself to sleep.
doesnt repaint? ----> YOU TELL ME :-D

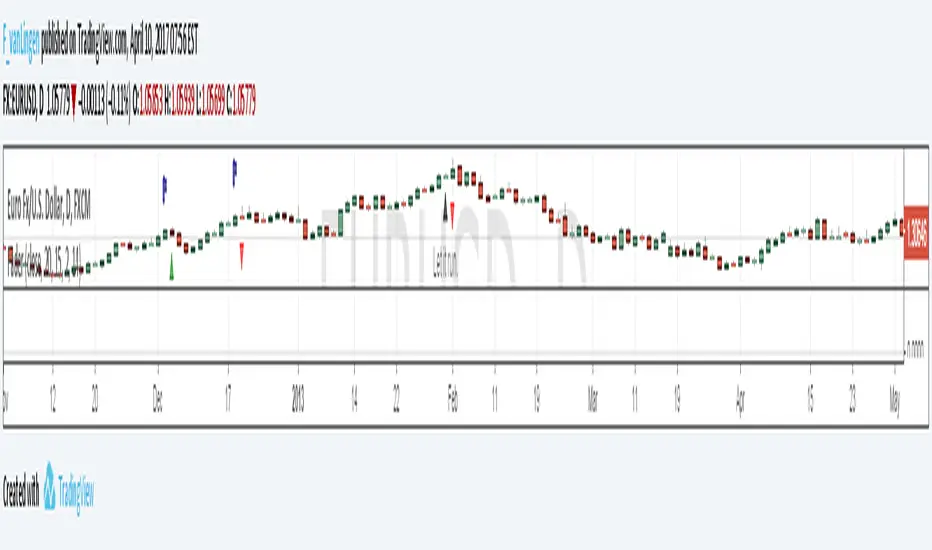
FaderThe Fader indicator finds the moment when trends begin to reverse. It locks down a quick profit which makes it very effective. It also calculates if it's better to stay or leave after a day of having opened the position.
Flags tell you when to buy or sell, red triangles indicate losses whereas green triangles indicate earnings. It has been tested with over 15 currency pairs, and has had consistent earnings.
If you are interested in this indicator please write to me at LingenTrade@gmail.com
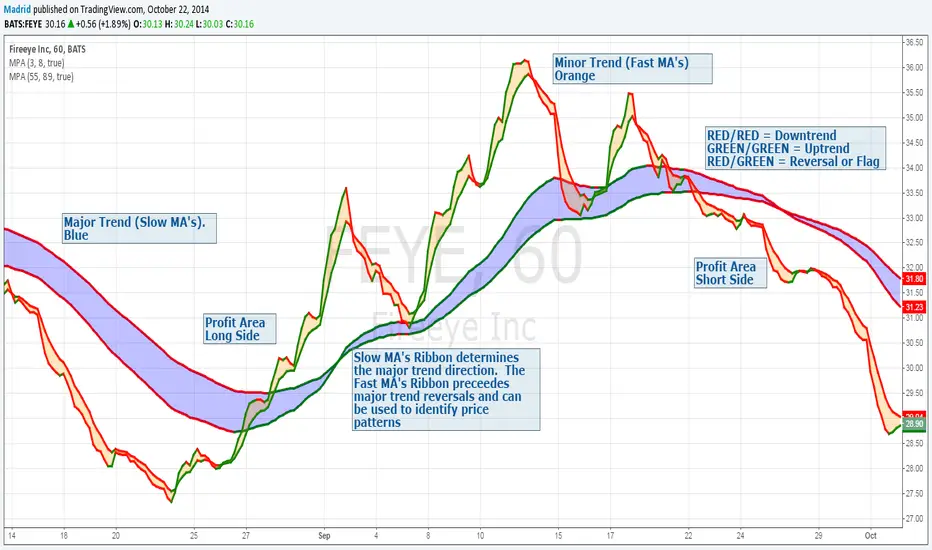
Madrid Profit AreaThis study displays a ribbon made of two moving averages identified by a filled Area. This provides visual aids to determine the trend direction and pivot points. The moving average will be Red if its value is decreasing, and green if it is increasing. When both MA's are the same color we have a trend direction. If those are different then we have a trend reversal and a pivot point.
If combined with another ribbon then it can be configured so we have a pair of slow MA's and another pair of fast MA's , this can visually determine if the price is in bull or bear territory following the basic rules:
1. Fast MA pair above the slow MA Pair = Bullish
2. Fast MA pair below the slow MA Pair = Bearish
3. If the fast MA crosses over the slow MA it is a Bullish reversal
4. If the fast MA crosses below the the slow MA, it is a Bearish reversal.
The use of the ribbons without the price bars or line reduces the noise inherent to the price
Opening Range Breakout with 2 Profit Targets.Opening Range Breakout with 2 Profit Targets.
Updated Indicator now works on all Symbols with Many Different Session Options.
***Known PineScript Issue…While the Opening Range is being Formed the lines only adjust for that individual bar. Just reset Indicator after Opening Range Completes.
***All Times are Based on New York Time
Session Options Forex U.S. Banks Open (8:00), Gold U.S. Open (8:20), Oil U.S. Open (9:00), U.S. Cash Session - Stocks (9:30), NY Forex Open (17:00) , Europe Open (02:00), or if you choose Setting 0 the Session Runs from 00:00 to 00:00 (Midnight to Midnight).
***Ability to use 60 minute Opening Range, 30 minute, 15 minute, and many other options.
***However you can manually change the times in the Inputs Tab to adjust for any session you prefer. This is useful for Day Light Savings Adjustments. Also the default times work if your charts are set to EST Time. If you use A different time zone in your settings you need to Adjust the times in the inputs tab.
Initially Opening Range High and Low plot as Yellow Lines. If Price Goes Above Opening Range then Line Turns Green. If Price Goes Below Opening Range Line Turns Red.
By default the First Profit Target is 1/2 the Width of the Opening Range and the 2nd Profit Target is 1 Times the Opening Range. However these are Adjustable in the Inputs Tab.
By Default the Opening Range Length is 1 Hour. However, you can Change the Opening Range Length to 15 min, 30 min, 2 hours etc. in the Inputs Tab.
Plots a 1 Above or Below Candle when 1st Profit Target is Achieved, and a 2 when 2nd Profit Target is Achieved.

DIP BUYING by HAZEREAL BUY THE DIP - Educational Price Movement Indicator
This technical indicator is designed for educational purposes to help traders identify potential price reversal opportunities in equity markets, particularly focusing on NASDAQ-100 index tracking instruments and technology sector ETFs.
Key Features:
Monitors price movements relative to recent highs over customizable lookback periods
Identifies two distinct price decline thresholds: standard (5%+) and extreme (12.3%+)
Visual signals with triangular markers and background color zones
Real-time data table showing current metrics and status
Customizable alert system with webhook-ready JSON formatting
Clean overlay design that doesn't obstruct price action
How It Works:
The indicator tracks the highest price within a specified lookback period and calculates the percentage decline from that high. When price drops below the minimum threshold, it generates visual buy signals. The extreme threshold triggers enhanced alerts for more significant market movements.
Best Use Cases:
Educational analysis of market volatility patterns
Identifying potential support levels during market corrections
Studying historical price behavior around significant declines
Risk management and position sizing education
Important Note: This is a technical analysis tool for educational purposes only. All trading decisions should be based on comprehensive analysis and appropriate risk management. Past performance does not guarantee future results.

X-Force Selector中文說明
X-Force 篩選者 是基於 Mark Minervini 概念設計的強勢標的篩選指標,旨在幫助交易者捕捉市場中的極端強勢標的。此指標運用多重篩選條件,使交易者能在價格達到特定關鍵位置時精準進場,專注於上漲動能強勁、突破阻力較小的標的。
指標篩選條件
100% 關鍵價位:當價格位於365根K棒的最低點的100%之上時,顯示該標的處於強勢區域,具備顯著的上漲動能。
25% 高點價位:同時,當價格位於365根K棒的高點以下25%之上時,代表該標的上方阻力較小,是一個潛在的突破信號。
滿足以上兩個條件的標的才會被視為進場機會,這符合 Minervini 所強調的「專注於強勢標的」的策略。Minervini 的概念強調當標的價格突破關鍵價位時,可能帶來更高的回報潛力,且風險相對較小。
加密貨幣與時間周期的應用
在加密貨幣交易中,1小時到4小時的小時間框架適合使用100%、66%、33%這些百分比範圍參數,以反映市場的高波動特性。對於更短周期,建議進一步縮小百分比,以提高指標對短期波動的敏感度,並增強篩選結果的準確性。
靈活的篩選與戰警風格
此指標的設計結合了 Minervini 的概念和戰警風格,旨在精準鎖定極具潛力的突破標的。X-Force 篩選者適合追隨趨勢的交易者,尤其是熱衷於 Mark Minervini 策略的投資者,使交易者能夠專注於市場中最具上漲動能的標的,實現更精確的進場決策。
English Description
X-Force Selector is a powerful trend-filtering indicator inspired by Mark Minervini’s trading concepts, designed to help traders capture assets with extreme strength in the market. By applying multiple filtering criteria, this indicator enables precise entry decisions when price reaches specific key levels, focusing on assets with strong upward momentum and minimal resistance.
Indicator Selection Criteria
100% Key Price Level: When the price is above 100% of the lowest low over the past 365 bars, it indicates the asset is in a strong zone with substantial upward momentum.
25% High Price Level: Additionally, when the price is within 25% below the 365-bar high, it signals reduced resistance above, indicating potential for a breakout.
Assets meeting both criteria are considered potential entry opportunities, aligning with Minervini's strategy of “focusing on strong assets.” Minervini’s concept emphasizes capturing high-potential assets as they break through critical levels, aiming for higher returns with relatively low risk.
Application to Cryptocurrency and Timeframes
In cryptocurrency trading, shorter timeframes such as 1H to 4H are well-suited for the 100%, 66%, and 33% thresholds, reflecting the high volatility of crypto markets. For even smaller timeframes, it is recommended to reduce these percentages to enhance the indicator’s sensitivity to short-term fluctuations, improving the accuracy of filtered results.
Flexible Filtering with a Battle-Ready Style
With a design inspired by Minervini's concepts and a battle-ready scanning approach, the X-Force Selector precisely locks onto high-potential breakout candidates. This indicator is ideal for trend-following traders, especially those applying Mark Minervini’s strategies, enabling them to concentrate on assets with the strongest upward momentum for precise entry decisions.

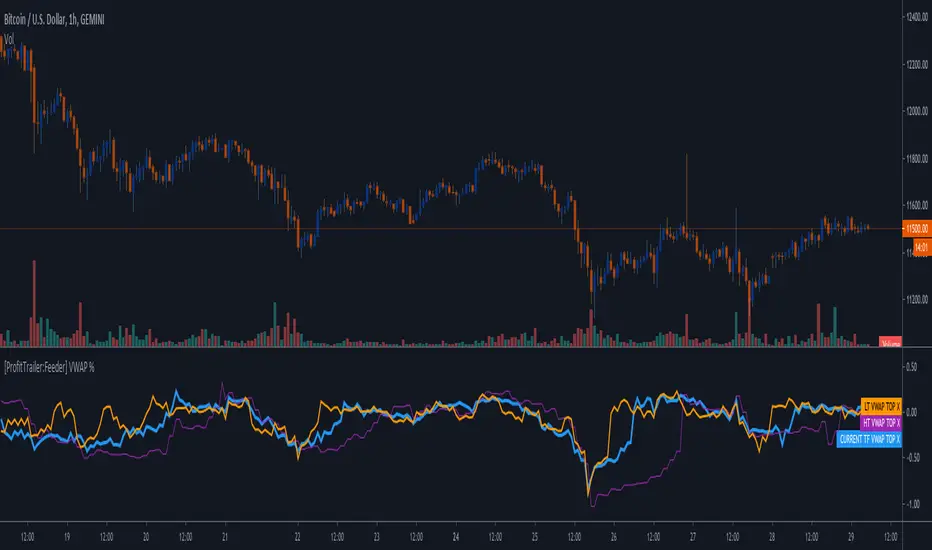
[ProfitTrailer:Feeder] VWAP %This script will help you create a strategy bases on VWAP % on BaseCoin & Top xx coin settings.
Enjoy & Like and follow if you like this kind of content.
[ProfitTrailer:Feeder] Market Trends Top X / BTCThis script will help you determine your MarketConditions Grouping for PtFeeder. You're able to input the specific top 10/20/xx pairs you want to use to fine-tune your groupings as well as specific BasePairs, there values will be automatically printed on the chart!
When measuring top coins trend, this is how many top coins to check by volume from the exchanges that you have configured PT Feeder for. For, the top 50 coins will be checked and their price change over the MeasureTimes property and the average change calculated. This average is used for the MaxTopCoinAverageChange property
If you like this kind of content, please 'like' and 'follow' and I'll continue publishing these kind of scripts!
Enjoy!

Profitable L 1800 Candle Highlight [Beta]
Certainly! Here's a user guide for the provided Pine Script code:
User Guide: 1800 Candle Highlight Indicator
Overview:
The "1800 Candle Highlight" indicator is designed to visually emphasize the 18:00 (6:00 PM) candle on the chart, providing clarity on its open and close prices, and highlighting its timeframe with a distinctive color.
Key Features:
Candle Highlighting: The indicator identifies the candle that opens at 18:00 and visually distinguishes it from other candles on the chart.
Open and Close Prices: The indicator plots the open and close prices of the 18:00 candle as step lines, making it easy to identify price movements during that timeframe.
Background Color: It colors the background within the 18:00 candle's timeframe with a transparent blue shade, providing further emphasis on that period.
Start Marker: A downward triangle shape marks the start of the 18:00 candle, aiding in identifying the beginning of the highlighted timeframe.
Usage:
Overlay: The indicator is designed to be overlaid on the price chart, allowing users to visualize the highlighted candle alongside price movements.
Interpretation: Traders can observe the open and close prices of the 18:00 candle relative to previous and subsequent candles, aiding in analysis and decision-making.
Timeframe Focus: The highlighted candle's timeframe can serve as a reference point for analyzing price action during specific hours, such as the end of a trading day.
Installation:
Access: Users can access the Pine Script editor within the TradingView platform to create a new indicator.
Copy and Paste: Copy the provided Pine Script code and paste it into the editor.
Save and Apply: Save the indicator and apply it to the desired chart, adjusting settings as needed.
Customization:
Color Scheme: Users can customize the colors used for highlighting, open/close prices, and background to suit their preferences and chart aesthetics.
Styling: Adjustments can be made to line styles, widths, and marker sizes to enhance visibility and clarity.
Compatibility:
The indicator is compatible with TradingView's Pine Script version 5 and can be applied to various financial instruments and timeframes supported by the platform.
Disclaimer:
The "1800 Candle Highlight" indicator is provided for informational purposes only and should not be considered as financial advice. Users are encouraged to conduct thorough analysis and consider multiple factors before making trading decisions.

Profitable Supertrend v0.1 - AlphaThis a script to try detect the best combination of supertrend parameters in a space of time. Sadly the script is slow. Evaluate all possibilities params is hard for a pinescript and my knowledge too. In some cases, when you want evaluate many time could be the script fails for timeout. Perhaps with time I could enhance. For this problem of speed the calculate of combinatios it's not complete: In factor use a increment of 0.2 in each param (0.1, 0.3, 0.5 ...) in period the increment for each value is 3. The range for factor it's from 3.0 to 12.0. The range of period it's from 10 to 43
My knowledge don't let me go more far. Perhaps with time I can enhance the script.

PMax on RSI with Tillson T3Profit Maximizer Indicator on RSI with Tillson T3 Moving Average:
PMax uses ATR calculation inside, for this reason users couldn't manage to use PMax on RSI because RSI indicator doesn't have High and Low values in bars, but ATR needs that values. So I personally calculate RSI in a different way to have High and Low values of RSI wrt price bars.
IMPORTANT:
Because of the sudden movements and divergences on RSI, this indicator must firstly optimized for the charts before using. Optimization can be held by users for the meaningful parameters for each chart.
3 parameters are critical when optimizing:
First: Multiplier
Second: Tillson T3 Length
Third: T3 Volume Factor
Here are some information about Profit Maximizer:
PMax Indicator:
PMax Screener and Strategy:

PMax Explorer STRATEGY & SCREENERProfit Maximizer - PMax Explorer STRATEGY & SCREENER screens the BUY and SELL signals (trend reversals) for 20 user defined different tickers in Tradingview charts.
Simply input the name of the ticker in Tradingview that you want to screen.
Terminology explanation:
Confirmed Reversal: PMax reversal that happened in the last bar and cannot be repainted.
Potential Reversal: PMax reversal that might happen in the current bar but can also not happen depending upon the timeframe closing price.
Downtrend: Tickers that are currently in the sell zone
Uptrend: Tickers that are currently in the buy zone
Screener has also got a built in PMax indicator which users can confirm the reversals on graphs.
Screener explores the 20 tickers in current graph's time frame and also in desired parameters of the SuperTrend indicator.
Also you can optimize the parameters manually with the built in STRATEGY version.
PMax indicator :
Profit Maximizer - PMax is a brand new indicator developed by me.
It's a combination of two trailing stop loss indicators;
One is Anıl Özekşi's MOST (Moving Stop Loss) Indicator
and the other one is well known ATR based SuperTrend
Profit Maximizer - PMax tries to solve this problem. PMax combines the powerful sides of MOST (Moving Average Trend Changer) and SuperTrend (ATR price detection) in one indicator.
Backtest and optimization results of PMax are far better when compared to its ancestors MOST and SuperTrend. It reduces the number of false signals in sideways and give more reliable trade signals.
PMax is easy to determine the trend and can be used in any type of markets and instruments. It does not repaint.
The first parameter in the PMax indicator set by the three parameters is the period/length of ATR.
The second Parameter is the Multiplier of ATR which would be useful to set the value of distance from the built in Moving Average.
I personally think the most important parameter is the Moving Average Length and type.
PMax will be much sensitive to trend movements if Moving Average Length is smaller. And vice versa, will be less sensitive when it is longer.
As the period increases it will become less sensitive to little trends and price actions.
In this way, your choice of period, will be closely related to which of the sort of trends you are interested in.
We are under the effect of the uptrend in cases where the Moving Average is above PMax;
conversely under the influence of a downward trend, when the Moving Average is below PMax.
Built in Moving Average type defaultly set as EMA but users can choose from 8 different Moving Average types like:
SMA : Simple Moving Average
EMA : Exponential Movin Average
WMA : Weighted Moving Average
TMA : Triangular Moving Average
VAR : Variable Index Dynamic Moving Average aka VIDYA
WWMA : Welles Wilder's Moving Average
ZLEMA : Zero Lag Exponential Moving Average
TSF : True Strength Force
Tip: In sideways VAR would be a good choice
You can use PMax default alarms and Buy Sell signals like:
1-
BUY when Moving Average crosses above PMax
SELL when Moving Average crosses under PMax
2-
BUY when prices jumps over PMax line.
SELL when prices go under PMax line.

PROFITABLE BITCOIN TRADING STRATEGYIndicators:
Weis wave volume by LazyBear (4)
Heikin Ashi candles
useful for longs and exits.
Best applied on 4h - 1D charts.

TO THE MOON (TTM) - ALERTSProfitable strategy and indicator with 3 parameters for more accurancy. Tested at Binance and Bitfinex.

McGinley Dynamic debugged🔍 McGinley Dynamic Debugged (Adaptive Moving Average)
This indicator plots the McGinley Dynamic, a mathematically adaptive moving average designed to reduce lag and better track price action during both trends and consolidations.
✅ Key Features:
Adaptive smoothing: The McGinley Dynamic adjusts itself based on the speed of price changes.
Lag reduction: Compared to traditional moving averages like EMA or SMA, McGinley provides smoother yet responsive tracking.
Stability fix: This version includes a robust fix for rare recursive calculation issues, particularly on low-priced historical assets (e.g., Wipro pre-2000).
⚙️ What’s Different in This Debugged Version?
Implements manual clamping on the source / previous value ratio to prevent mathematical spikes that could cause flattening or distortion in the plotted line.
Ensures more stable behavior across all instruments and timeframes, especially those with historically low price points or volatile early data.
💡 Use Case:
Ideal for:
Trend confirmation
Entry filtering
Adaptive support/resistance visualization
Improving signal precision in low-volatility or high-noise environments
⚠️ Notes:
Works best when combined with volume filters or other trend indicators for validation.
This version is optimized for visual use—for signal generation, consider pairing it with additional logic or thresholds.

Bot MasterSqueeze 1.1 (crypt)Countertrend strategy for correction to the average value. The strategy is designed primarily for crypto.
The principle of operation is that with a rapid price change, the strategy tends to take a reverse position to return to the average value, which statistically often happens. It is enough for you to determine the percentage of the offset about the average price and the size of the averaging position as a percentage of the deposit.
With the settings, you determine how to determine the average opening price. It can be MA at the price of opening, closing, etc., and DCMA. Soon I will add a few more options for determining the average opening price
You can also choose the average price at which the transaction will try to close.
Now there are 3 methods:
- closing when returning to the average price
- closing on the first correction candle
- opening on an abnormally large candle in the direction of correction and closing on the first one is opposite
Search for the settings by the selection method for each pair separately. It is better to trade using signals via a bot.
The strategy shows itself best on volatile coins paired with the dollar for 1 hour or more.
Soon I will add new options for opening and closing deals, as well as determining the average price.
ATTENTION: the strategy involves averaging, so be careful with levers and overestimating the percentage of the transaction from the deposit. It is best to allocate no more than 25 percent to the risk of the transaction.

Profit TraderWhat is this?
This module will helps you to implement 2 strategies: Trend Following and Swing Trading. You will have a complete strategies in any market condition. This module will reach it's maximum potential if you combine with our other module: Trend Optimizer module and momentum line module
The Indicators & strategies?
This module consist of short term and medium term resist and support (R/S). R/S is based on price fractals, modified to a simpler visualization, and Standard Deviation that shows in grey area.
1. The short R/S (the blue & red lines, we called: R/S) represent 1 week timeframe fractal. R/S is used for breakout strategy. This indicator will be perfectly works with our other module: Trend Optimizer. While the trend is positive and price breaks R, it indicate an uptrend phase. Watch the S level, as long price stays above S, trend following method will works. On the other side, while the trend is flattening and price breaks S, it indicate early bearish phase.
2. The medium R/S (the blue & red dots, we called: R/S+) represent 1 month timeframe fractal. RS+ is used for swing strategy. This indicator will also perfectly works with our other module: trend optimizer. While the trend is consolidating, trader have to change from R/S into R/S+ (dotted line) as a swing high (sell on strength) & swing low range (buy on weakness).
3. The grey area around charts. it is a statistical standard deviation +/-2 from 20 days price average which is commonly used in Bollinger Band as well. This grey area works well with RS+ (the blue & red dots). Grey area, as what we knows in standard deviation, when data (price) moves outside the deviation, it tends to have a reversal movement back into deviation area. If the price piking above its grey area, it tends to have a pullback movement. If price drop below its grey area, it tends to have a rebound.
Benefit For You
You'll have a guidance how to follow the trend while the major trend is as you expected, and how to trade in swing low - high condition while the trend is sideways.
If you combine this script with our other two module: Trend optimizer module & Momentum Line Module, You'll have a complete template to analyze both trend and swing strategies.

PROFIT INDICATORFirst let me tell you which indicators have been used in this script so that you have the confidence while taking the trade:
(a) Bollinger Band with 20 SMA Inside it - Currently it is off, you can turn it on from settings.
(b) HMA 33, I have added the option of using two HMA's simultaneously. You can use HMA, EMA, SMA as per your settings and it would be color trending.
(c) VWAP- you can turn it on from settings
(d) CPR- you can turn it on from settings
(e) EMA's 20, 50, 200. Currently off, you can turn it on from settings.
(d) SMA's 50 and 200. Currently off, yu can turn it on from settings, if you want to use 20 SMA you can use bollinger band basis that is 20 period SMA.
(f) Trend bar at bottom on the basis of 50 EMA.
(g) Half Trend
(h) Trend strength Detector
(d) EMA 50 high and low to show the pac channel. I am not using this however as per request I have added this. Currently, it is trun on and you can turn it off from settings.
(f) Auto Fib levels
Please use a stick note for few days and mention imp notes before taking trade to check if all the conditions are matching to take the trade.
Buy Condition:-
1. Bolling band should be widely open.
2. Check the support and resistance from CPR. Candle should close above support in green.
3. Check the trend bar at bottom, it should be green, if it is grey in colour dont enter in trade.
4. Candle should be closing above EMA 50 and its upto you if you need additional confirmation, you can use EMA 20, 50, 200 and SMA 50 and 200, this is optional.
5. You can use VWAP as support or resistance and you can turn it on from settings.
6. Trending HMA of 33 should be in green for buy.
7. Half trend Indicator should give buy signal.
8. Trend Strength Indicator for checking the strength of the trend, if the arrow is big upside, you can go for buy.
9. Exit from buy trade when it start showing very small arrow which means trend is about to change.
10.Exit buy trade at 61.8 Fib level
Sell Condition:-
1. Bolling band should be widely open.
2. Check the support and resistance from CPR. Candle should close below resistance in red.
3. Check the trend bar at bottom, it should be red, if it is grey in colour dont enter in trade.
4. Candle should be closing below EMA 50 and its upto you if you need additional confirmation, you can use EMA 20, 50, 200 and SMA 50 and 200, this is optional.
5. You can use VWAP as support or resistance and you can turn it on from settings.
6. Trending HMA of 33 should be in red for sell.
7. Half trend Indicator should give sell signal.
8. Trend Strength Indicator for checking the strength of the trend, if the arrow is big downside, you can go for sell.
9. Exit from sell trade when down arrows start showing very small in size which means trend is about to change.
10.Exit sell trade at 61.8 Fib level

PMax on Rsi w/T3 *Strategy*Profit Maximizer Indicator on RSI with Tillson T3 Moving Average:
PMax uses ATR calculation inside, for this reason users couldn't manage to use PMax on RSI because RSI indicator doesn't have High and Low values in bars, but ATR needs that values. So I personally calculate RSI in a different way to have High and Low values of RSI wrt price bars.
IMPORTANT:
Because of the sudden movements and divergences on RSI , this indicator must firstly optimized for the charts before using. Optimization can be held by users for the meaningful parameters for each chart.
3 parameters are critical when optimizing:
First: Multiplier
Second: Tillson T3 Length
Third: T3 Volume Factor
Says, Kıvanç Özbilgiç. Here's the strategy version for you to backtest & optimize properly.
Enjoy.

Profit/Loss Live trackerI small script to track the current active trade live.
**HOW IT WORKS**
change inputs in parameter
- Entry price
- Invested capital
- Comission fees
