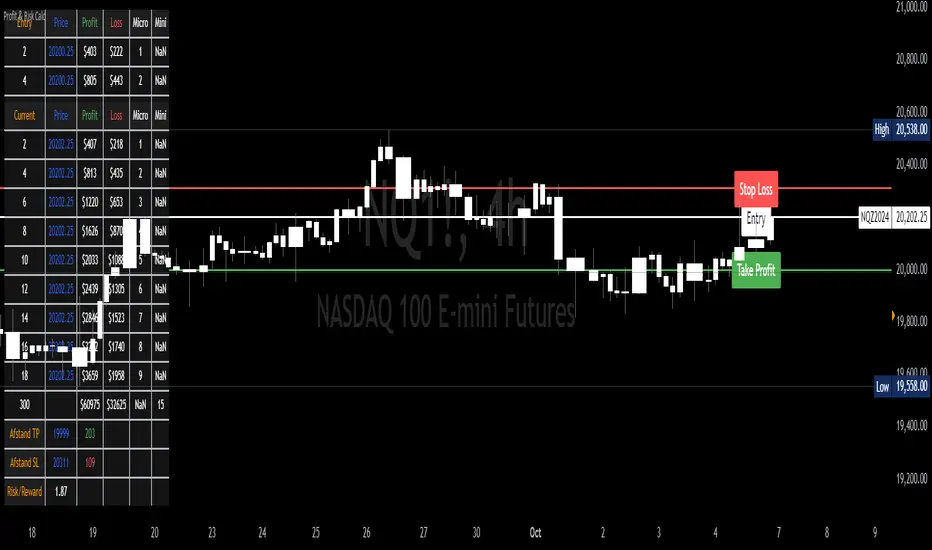
Profit & Risk CalculatorThe "Profit & Risk Calculator" script in Pine Script (TradingView) is designed to help users calculate potential profit and risk when trading, and to provide alerts when specific price levels are reached (such as entry price, take profit, or stop loss). It includes several components as described below:
1. Input Fields:
The user can manually input various prices: entry price, stop loss price, and take profit price, with steps of 0.25.
There is also an option to input a custom value (e.g., for personal lot sizing) and a total investment amount.
2. Dynamic Lines:
The script draws dynamic horizontal lines for the input prices: entry line (white), stop loss line (red), and take profit line (green).
These lines are automatically updated based on the entered price levels.
3. Labels for the Lines:
Labels are added to the lines to visually indicate the entry, stop loss, and take profit levels on the chart.
4. Long and Short Position Calculations:
The script calculates potential profit and loss for both long (profit if the price goes up) and short (profit if the price goes down) positions.
It also calculates the distance between entry and take profit, and distance between entry and stop loss, along with the risk/reward ratio (RR).
5. Alerts:
The script generates alerts when one of the following conditions is met:
Entry Condition: The price touches or exceeds the entry price (high >= entryPrice).
Stop Loss Condition: The price touches or drops below the stop loss price (low <= stopLossPrice).
Take Profit Condition: The price touches or exceeds the take profit price (high >= takeProfitPrice).
6. Lot Calculations:
The script calculates both micro and mini lot sizes based on a preset table and the custom value.
The results are displayed in a table on the chart.
7. Profit/Risk Table:
The script shows two tables:
One table calculates the profit, loss, and risk/reward ratio based on the input entry price.
A second table shows the same calculations based on the current price.
8. Chart Display:
The script places tables and other visual data on the chart, such as preset values, profit and loss calculations, and the distance from take profit and stop loss to the entry price.
English Explanation of Each Part of the Script
1. Input Fields
The script starts with several input fields where the user can specify the entry price, stop loss price, take profit price, custom value, and investment amount. These values help define the parameters for risk/reward calculations.
2. Dynamic Horizontal Lines
Three horizontal lines are drawn on the chart, representing the entry price, stop loss price, and take profit price. These lines update dynamically based on user input.
3. Dynamic Line Updates
As the user adjusts their inputs, the position of the lines is updated in real-time to match the new price levels. This keeps the chart visually accurate.
4. Labels for Lines
Labels are placed on the chart next to each price line, allowing the user to clearly see which line represents which price level.
5. Long and Short Position Calculations
The script calculates the potential profit or loss for both long (prices go up) and short (prices go down) positions, providing users with an idea of their potential gains or losses.
6. **6. Risk/Reward Ratio Calculation
This calculates the Risk/Reward Ratio (RR) by dividing the distance between the take profit and entry price by the distance between the entry and stop loss price. This gives the trader an idea of how much risk they're taking relative to the potential reward.
7. Alert Conditions
The alert conditions are defined based on the price hitting the set levels:
Entry Condition: If the price goes up and touches the entry level, the alert is triggered.
Stop Loss Condition: If the price drops and hits the stop loss level, the alert is triggered.
Take Profit Condition: If the price rises and reaches the take profit level, the alert is triggered.
8. Alert Configuration
Each condition is linked to an alert that sends a message when the specific price level is touched. The alerts notify the user when the entry, stop loss, or take profit levels are hit.
9. Lot Calculations
The script includes a function that calculates micro and mini lot sizes based on a preset table and a custom value input by the user. This is useful for adjusting lot sizes to the desired amount and determining position sizes for trades.
10. Entry Price-Based Profit & Loss Table
A table is generated on the chart that displays detailed information about the profit, loss, and risk/reward ratio based on the entry price. It helps traders see the potential outcomes for different lot sizes.
11. Current Price-Based Profit & Loss Table
This second table provides similar information as the first but calculates profit, loss, and risk/reward based on the current price. This allows the trader to see how their position performs as the market price changes in real time.
Cerca negli script per "profit"
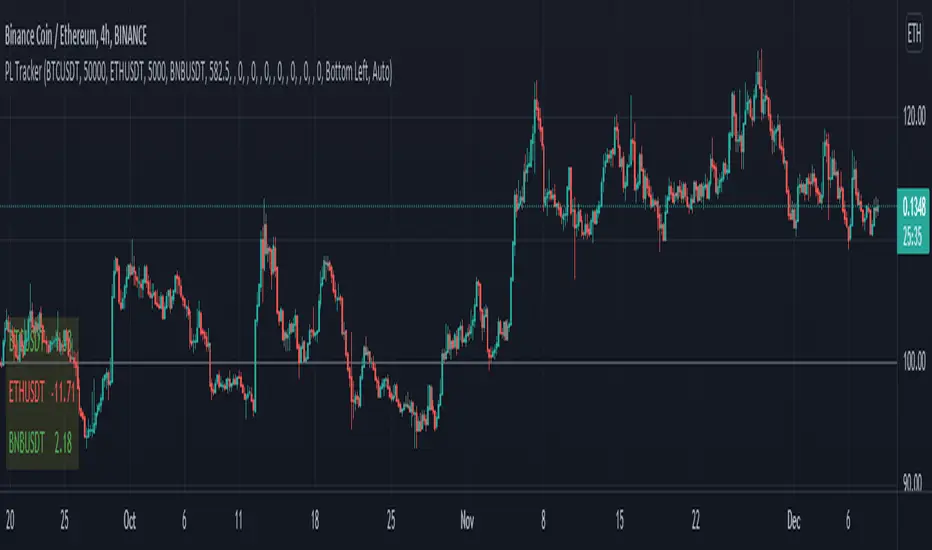
Profit Loss TrackerIt's a simple profit loss tracker for up to 10 symbols. A concise panel displays all your positions, whether if they're in profit or loss, and what percentage.
Text size and box position can be adjustable.
Profit Accumulator Bollinger Band TrendHi everyone,
I've been playing with the idea of trying to trend bollinger band movement of various currencies. What I've got here is the result of that. In its very basic form its a tool to identify the start and end of both long and short term trends.
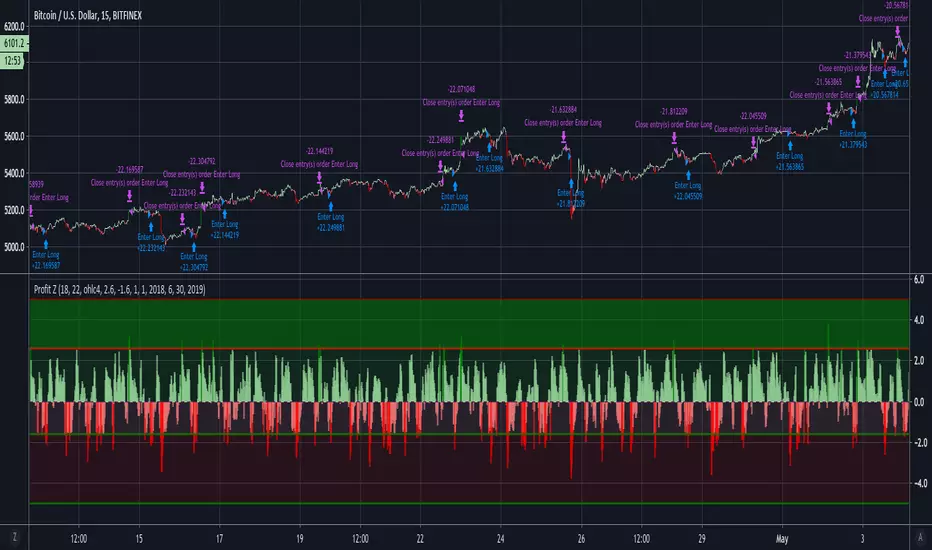
The thick line (red/green) indicates whether this is a bullish (green) or bearish (red) movement and generally governs the longer term trend. The thinner, black line indicates the movements within the market. Anything above the zero line indicates positive movement where trades could be placed (along with the main trend line). When this line moves below the zero line, it appears to highlight uncertainty and the potential trend coming to an end.
If anyone would like alerts adding to this indicator then please let me know.
Thanks
Mike

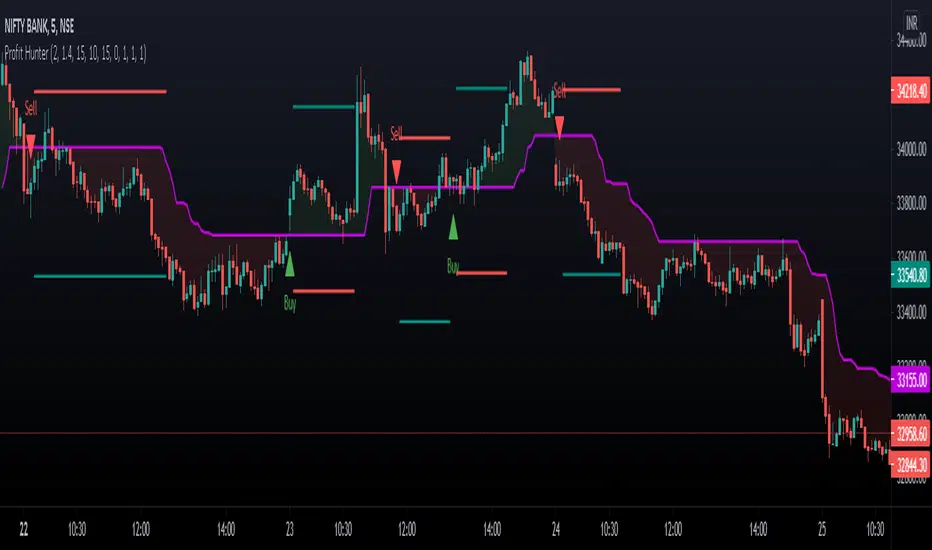
Profit HunterThis is a simple indicator working on the basis of trend optimized method, when price crosses and goes up the trendline it goes for long signal and when it crosses down the trendline it goes for short signal. The risk reward ratio plays a significant role in the succcess rate. Intraday square off timing is also given in the settings.
In indicator settings you will have access to
Entry Time Flexibility
Exit Time Flexibility
Take Profit Value
Stop Loss Value
Trailing Stop Losses
Contact us using the link given below to obtain access to this indicator.
This is for charting purpose and following an indicator bliendly involves risk. The historical results don't imply its future success.
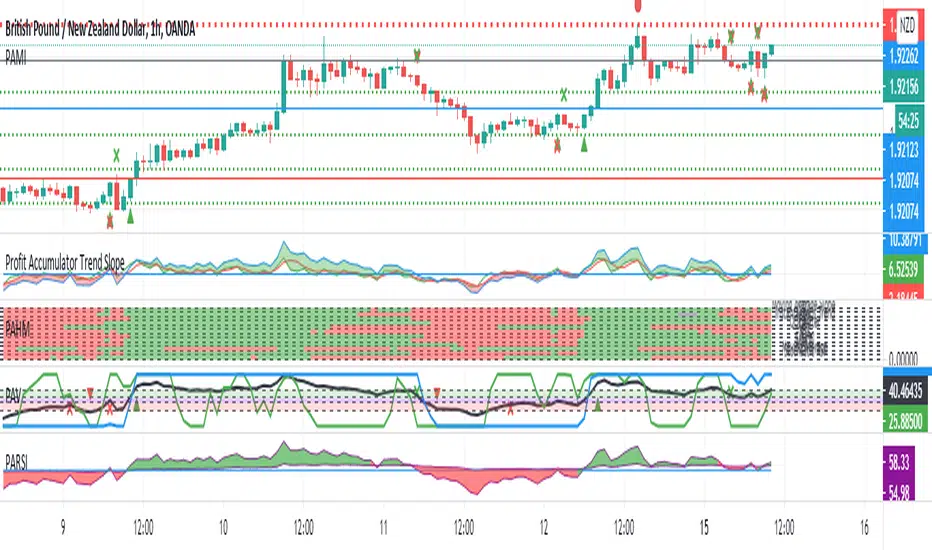
Profit Accumulator Trend SlopeI've been getting very good results with this indicator, using it in conjunction with the Profit Accumulator Main Indicator.
This indicator uses a number of methods for detecting reversals and the start of new trends.
The basis is simple in that when the trend lines cross above the zero line, it indicates a possible long entry and crossing below the zero line, indicates a possible short entry.
The strongest signal is when they all cross the zero line in one timeframe.
In terms of options/settings, I've included the following:
Multiple Timeframe
Changing the lengths.
I've also added an alert option for when the lines cross the zero line.
Profit MAX MTF HeatMapThis is a powerfull strategy which is made from combining 3 multi timeframes into one for profit max indicator
In this case we have daily, weekly and montly.
Our long conditions are the next ones :
if we have an uptrend on all 3 at the same time, we go long.
If we have a downtrend on all 3 of them at the same time we go short.
For exit, for long, as soon as one of the 3 converts into downtrend we exit the trade.
For exit, for short, as soon as one of the 3 converts into uptrend we exit the trade.
This tool can be used on all types of markets, and can also be changed the time frames.

Profit Maximizer StrategyFirst I would like to thank to @KivancOzbilgic for developing this indicator.
All the credit goes to him.
I just created a strategy, in order to try to find the perfect parameters, timeframe and currency for it.
I will provide below the same description like he has in the publish of profit maximizer
Profit Maximizer - PMax combines the powerful sides of MOST (Moving Average Trend Changer) and SuperTrend (ATR price detection) in one indicator.
Backtest and optimization results of PMax are far better when compared to its ancestors MOST and SuperTrend. It reduces the number of false signals in sideways and give more reliable trade signals.
PMax is easy to determine the trend and can be used in any type of markets and instruments. It does not repaint.
The first parameter in the PMax indicator set by the three parameters is the period/length of ATR.
The second Parameter is the Multiplier of ATR which would be useful to set the value of distance from the built in Moving Average.
I personally think the most important parameter is the Moving Average Length and type.
PMax will be much sensitive to trend movements if Moving Average Length is smaller. And vice versa, will be less sensitive when it is longer.
As the period increases it will become less sensitive to little trends and price actions.
In this way, your choice of period, will be closely related to which of the sort of trends you are interested in.
We are under the effect of the uptrend in cases where the Moving Average is above PMax;
conversely under the influence of a downward trend, when the Moving Average is below PMax.
Built in Moving Average type defaultly set as EMA but users can choose from 8 different Moving Average types like:
SMA : Simple Moving Average
EMA : Exponential Movin Average
WMA : Weighted Moving Average
TMA : Triangular Moving Average
VAR : Variable Index Dynamic Moving Average aka VIDYA
WWMA : Welles Wilder's Moving Average
ZLEMA : Zero Lag Exponential Moving Average
TSF : True Strength Force
Tip: In sideways VAR would be a good choice
You can use PMax default alarms and Buy Sell signals like:
1-
BUY when Moving Average crosses above PMax
SELL when Moving Average crosses under PMax
2-
BUY when prices jumps over PMax line.
SELL when prices go under PMax line.

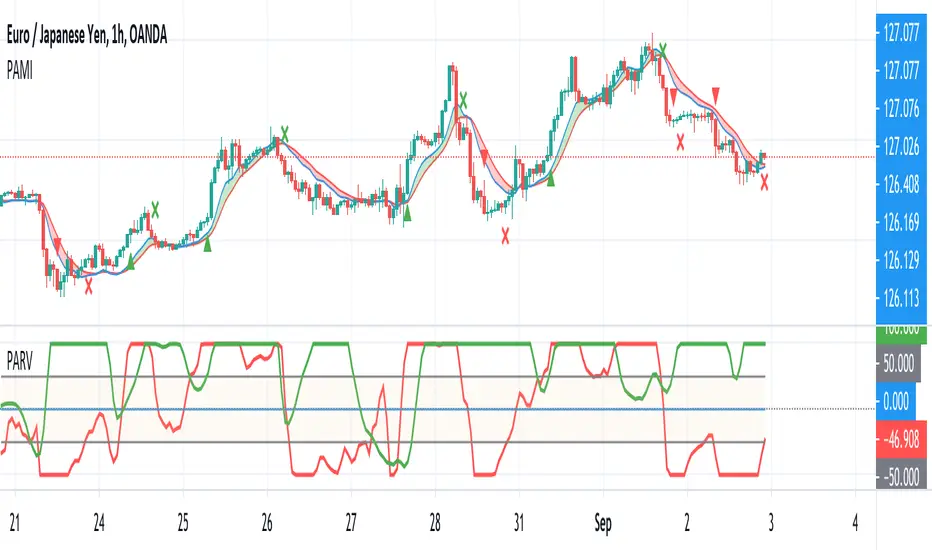
Profit Maximizer PMaxPMax is a brand new indicator developed by KivancOzbilgic in earlier 2020.
It's a combination of two trailing stop loss indicators;
One is Anıl Özekşi's MOST (Moving Stop Loss) Indicator
and the other one is well known ATR based SuperTrend.
Both MOST and SuperTrend Indicators are very good at trend following systems but conversely their performance is not bright in sideways market conditions like most of the other indicators.
Profit Maximizer - PMax tries to solve this problem. PMax combines the powerful sides of MOST (Moving Average Trend Changer) and SuperTrend (ATR price detection) in one indicator.
Backtest and optimization results of PMax are far better when compared to its ancestors MOST and SuperTrend. It reduces the number of false signals in sideways and give more reliable trade signals.
PMax is easy to determine the trend and can be used in any type of markets and instruments. It does not repaint.
The first parameter in the PMax indicator set by the three parameters is the period/length of ATR.
The second Parameter is the Multiplier of ATR which would be useful to set the value of distance from the built in Moving Average.
I personally think the most important parameter is the Moving Average Length and type.
PMax will be much sensitive to trend movements if Moving Average Length is smaller. And vice versa, will be less sensitive when it is longer.
As the period increases it will become less sensitive to little trends and price actions.
In this way, your choice of period, will be closely related to which of the sort of trends you are interested in.
We are under the effect of the uptrend in cases where the Moving Average is above PMax;
conversely under the influence of a downward trend, when the Moving Average is below PMax.
Built in Moving Average type defaultly set as EMA but users can choose from 8 different Moving Average types like:
SMA : Simple Moving Average
EMA : Exponential Movin Average
WMA : Weighted Moving Average
TMA : Triangular Moving Average
VAR : Variable Index Dynamic Moving Average aka VIDYA
WWMA : Welles Wilder's Moving Average
ZLEMA : Zero Lag Exponential Moving Average
TSF : True Strength Force
Tip: In sideways VAR would be a good choice
You can use PMax default alarms and Buy Sell signals like:
1-
BUY when Moving Average crosses above PMax
SELL when Moving Average crosses under PMax
2-
BUY when prices jumps over PMax line.
SELL when prices go under PMax line.

Profit Accumulator Relative VolatilityRelative Volatility Indicator
This is a support indicator to the Main Indicator which has also been published.
This indicator uses volatility to determine if the market is quiet, or trading sideways or if there is money in the market and the opportunity for a long or short signal. There is an adjustable bottom line (in this case 0.15) and anything near or below that would indicate that no trades should be taking place. Similarly, if the trend line is declining, this is another indication that any trades should not be taken.
The trend line as an adjustable maximum setting of 0.5 and an increasing trend line is indicative of volatility in the market and a long or short position should be considered. This indicator should be used with the other suite of indicators to provide confluence of the trade.
Whilst an actual alert function is not set for the indicator, the TradingView alert function can be used to trigger a message when the line crosses above 0.15.
I've been using this successfully on the one hour FX charts, but seems to work equally as well on higher or lower time frames (not less than 15min).
The other indicators which are part of the suite are shown on the website which is highlighted in my signature at the bottom of the page. Purchase of the main indicator gives access to the full suite of eight indicators. I use the other indicators to confirm the direction of the trade and to determine if I want to trade or not. I use it along with the 2min, 15min and 4hr timeframes to identify the best entry window and how long I'm likely to be in the trade.
Support can be provided via private message or in the comments below.
The links are provided below for access to the indicator.
Profit Accumulator Trend IndicatorTREND INDICATOR (PATC)
This is a support indicator to the Main Indicator which has also been published.
This indicator uses a number of tools to assess for trend direction and where to place Take Profit and Stop Loss points. There are no alerts with this indicator.
I've been using this successfully on the one hour FX charts, but seems to work equally as well on higher or lower time frames (not less than 15min).
This indicator has a number of tools in the settings that can be used to assist with trading. This includes
Multi-Timeframe Support and Resistance points. The thicker the line is, the greater the timeframe that youre dealing with. In the 1hr chart on this script, the S&R is set at 1hr, 4hr and 1D time periods.
Trend Direction points. Note that these have a massive tendency to repaint, however when used with something like Bollinger Bands (as in the Main Indicator) you can identify turning points (i.e. when the close of the candle is at the upper or lower boundary levels).
Risk Management provides a high level tool for managing money based on relative ATR multiplier points.
The other indicators which are part of the suite are shown on the website which is highlighted in my signature at the bottom of the page. Purchase of the main indicator gives access to the full suite of eight indicators. I use the other indicators to confirm the direction of the trade and to determine if I want to trade or not. I use it along with the 2min, 15min and 4hr timeframes to identify the best entry window and how long I'm likely to be in the trade.
Support can be provided via private message or in the comments below.
The links are provided below for access to the indicator.

PS ATR VariantProfit Sniper ATR Variant v0.1 is completely new but based off of the Profit Sniper 3.0 you know and love :
The original SNIPER operates off two timeframes in parallel, your Trend Timeframe (Higher Timeframe concerned with identifying market up & down trends), and your Trade Timeframe (Lower Timeframe to actually trade Longs & Shorts in).
Within each timeframe, you can tailor your preference for waiting for either Stochastic Ribbon cross only, or Ribbon Cross followed by Chande Confirmation for that additional market structure confidence. Flags & Alerts will then provide you with numerous trading Long & Short trading opportunities per day.
You also have the option to trade with trend so the indicator will automatically flag & alert only Shorts in a Short trend, and Longs in a Long Trend.
This version has the ATR (Average True Range) Indicator incorporated, to give trend direction (only tke longs in long trend and vice versa) and some additional safety features using ATR values.
For access please send a DM
With some extra features. such as ATR ( Average True Range ) trade entry which measures market volatility by analysing the range of asset price during a specified period.

PROFIT+ V3 ALERTThis is an alert indicator for PROFIT+ V3 strategy .
Add it to your chart with the strategy and create alerts to
receive notifications when Buy and Sell signals are generated.
To receive access for the strategy and this indicator, please pm me or contact
me at telegram from the link below.
----------------------------------------------------------------------------
Это алерт индикатор к стратегии PROFIT+ V3 .
Используйте индикатор со стратегией и создавайте алерты
для получения уведомлений когда генерируются сигналы
на покупку и продажу.
Для получения доступа к стратегии и к данному индикатору,
пожалуйста, напишите мне в лс или в телеграм через ссылку ниже.

PROFIT + ALERTS V2This is an Alert indicator for PROFIT + strategy.
Use it with the strategy to create and receive notifications when the strategy generates buy / sell signals.
To get access to the indicator and its strategy pm me.
------------------------------------------------------
Это алерт индикатор для стратегии PROFIT +
для получения уведомлений когда стратегия генерирует buy / sell сигналы.
Для получения доступа к индикатору и стратегии пишите в личные сообщения.

PROFIT + V2We are glad to introduce you our new strategy PROFIT +.
The strategy PROFIT + is based on price and volume correlation analysis.
The entries are quick with tight stop loss. Best suits fot those who like
to get quick profit in the beginning of the price move.
It was tested on BTC , Bitmex exchange on 1 hour timeframe,
but it can also be used on 30, 15 and 10 minutes tf.
There is also ALERT INDICATOR for the strategy to receive notification
when there is a buy/sell signal.
To get acces to the strategy pm me.
-------------------------------------------------------------------------
Рады представить нашу новую торговую стратегию PROFIT+.
Стратегия PROFIT + основана на анализе корреляции цены и объёма.
Входы в стратегии быстрые с коротким стопом. Больше подходит для
тех кто любит забирать быстрый профит в самом начале движения.
Стратегия была тестирована на инструменте BTC биржа BITMEX
на 1 часовом таймфрейме, но она также работает на 30, 15 и 10 минутных тф.
Для стратегии также доступен ИНДИКАТОР АЛЕРТ для получения оповещения
при появлении buy/sell сигналов.
Для получения доступа к стратегии пишите мне в личные сообщения.

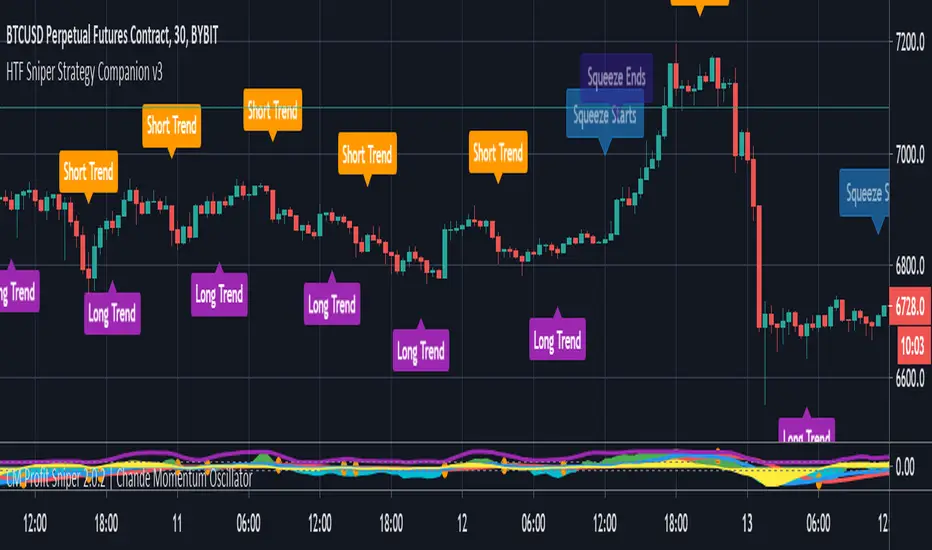
HTF Sniper Strategy CompanionProfit Sniper companion indicator to use ideally on higher timeframes (HTF) to alert on trend changes and Bollinger Band Squeeze Conditions.
To be used as a visual tool alongside "Profit Sniper 2.0" Indicator to allow you to identify market changing between trending & ranging state and trade Long or Short accordingly, example use is on the 30 minute Heiken Ashi to identify bullish or bearish trends to guide lower timeframe trading plays.
Profit and Stoploss CalculatorThis script is designed to display three stop loss areas to assist either with automation of risk management or identify and alert when price is in a range of a trade for risk to reward ratio.
In this version there are three stop losses and 1 PT. Mainly because i will most likely only be using 1 of the SL to pair with the PT.
Stoploss areas are displayed on both sides of the price for long and short calculations along with the two profit factors but the settings in the indicator it self apply to both sides in terms of percentage.

Profit/Loss HelperHi guys, just a quick little indicator based on the ATR to help you set some profit and stop targets. This is NOT financial advice, just a simple indicator that will attempt to another indicator to consult when placing those stop and profit orders.
The indicator will give you the an average stop loss target based on a 2:1 risk reward ratio based on the current timeframe . The first profit target adheres to the 2:1 ratio and should be respected in sideways markets. The following two TPs will give you an indication of what more probable targets will be if you think that the asset is poised to move further.
Further to help with your analysis, the indicator will provide you 4 metrics from different timeframes also based on the ATR and the most probable size of the moves we may see in price. Again this is purely based on the ATR and nothing fancy so take it with a grain of salt and may it help you bring another check when placing orders on the market.

Profit Z Study Study version of the Profit Z strategy. Generates signals based on price and volume Z-Scores.
We updated this version to include more alerts, volume Z-scores, and an easily-adjustable stop-loss.

Profit Runner Strategy v2.0This is the strategy version of the recently posted Profit Runner v2.0 study. We include both together so that users can use the strategy for backtesting and figuring out the optimal settings for their specific usage and then implement those settings in the study version(which includes alerts for automated trading).
Green background highlights are buy signals and red background highlights are sell signals. Red and green filled area show the user's stop loss .

Profit Runner Study v2.0Updated version of our Profit Runner indicator. All of our invite-only scripts are available through our website profitprogrammers.com. All studies come together with their strategy equivalent!