Profit EstimateLibrary "profitestimate"
Simple profit Estimatr. Engages when Position != 0
and holds until posittion is na/0...
if position changes sizes, it will update automatically and adjust.
it has an input for comission to estmate exit fees
update_avgprice(_sizewas, _delta, _pricewas, _newprice)
Get a new Average position Price
Parameters:
_sizewas : (float) the position prior
_delta : (float) the order amount
_pricewas : (float) the prior price
_newprice : (float) the price of order
Returns: New Avg Price
amount(_position, _close, _commission, _leverage, _fullqty)
Position Net Profit Net Commission, automatic on/off if position != 0
Parameters:
_position : (float) position size (total or margin size)
_close
_commission : (float) % where (0.1 = 0.1%)
_leverage : (float) optional if leveraged, default 1x
_fullqty : (bool) if position entered is tottal trade size default is margin qty (1/lev)
Returns: quote value of profit
percent(_position, _close, _commission, _leverage, _fullqty)
Position Net Profit, automatic on/off if position != 0
Parameters:
_position : (float) position size (total or margin size)
_close
_commission : (float) % where (0.1 = 0.1%)
_leverage : (float) optional if leveraged, default 1x
_fullqty : (bool) if position entered is tottal trade size, default is margin qty (1/lev)
Returns: percentage profit (1% = 1)
Cerca negli script per "profit"

[ProfitTrailer] Fibonacci Swing TraderThis script implements one of the ProfitTrailer example strategies: Fibonacci Swing Trader.
For complete info about this strategy please refer to PT wiki.

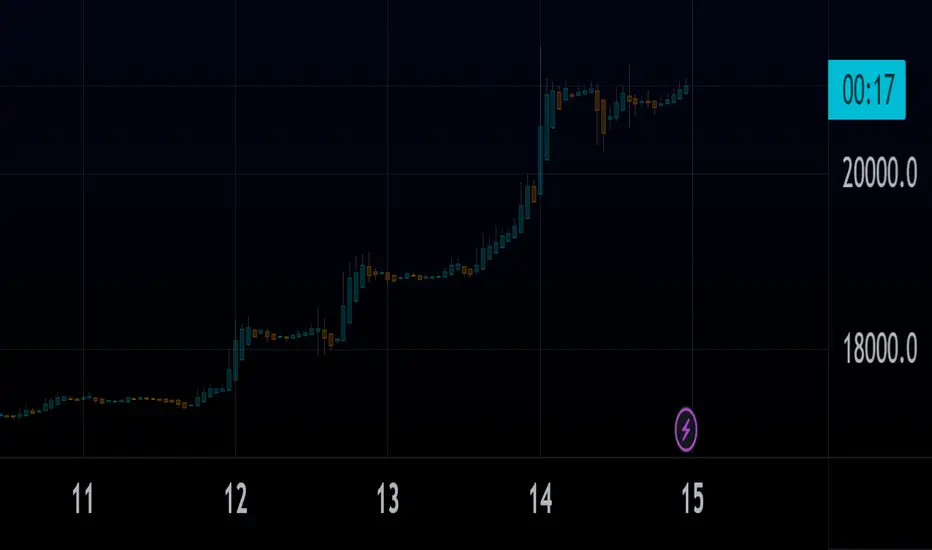
Profitable Parabolic SARIntroduction
As you know, Parabolic Stop and Reverse (SAR, PSAR) was originally developed by J. Welles Wilder and was described in his book "New Concepts in Technical Trading Systems" (1978). It derives its name from the fact that when charted, the pattern formed by the points resembles a parabola.
Mr. Wilder described it as "one of my favorite systems because it squeezes more profit out of an intermediate move than any method I know" .
Interpretation
PSAR follows price and can be considered a trend following indicator. Once a downtrend reverses and starts up, PSAR follows prices like a trailing stop. Same is true for the opposite direction.
Due to its nature, PSAR continuosly protects on long and short positions.
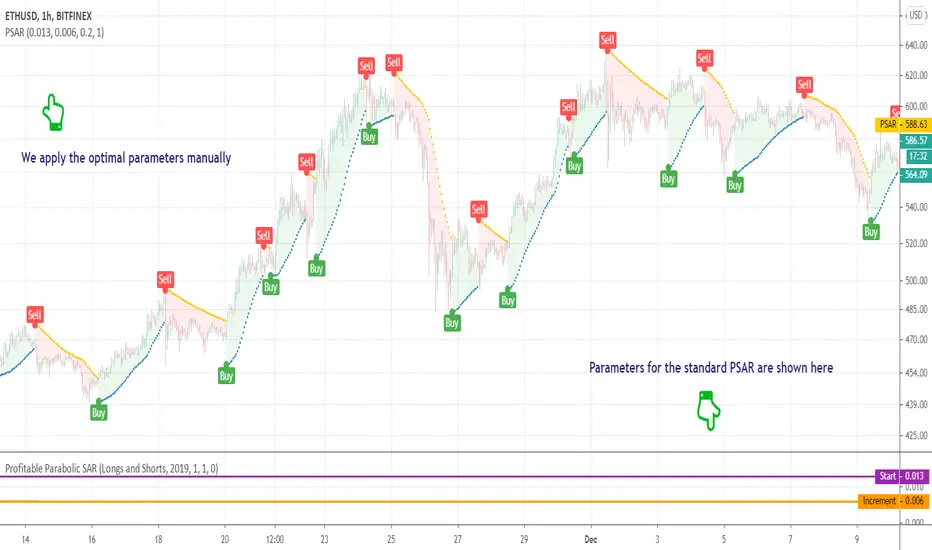
Parameters
One of the key components of PSAR is the Acceleration Factor (AF). The AF is one of a progression of numbers beginning at 0.02 and ending at 0.2 . The AF is increased by the increment of 0.02 each time that a new high is made until a value of 0.2 is reached.
Mr. Wilder used the next parameters
Start: 0.02
Increment: 0.02
Maximum: 0.2
and they are default for the built-in PSAR indicator and its strategy.
But are these params really profitable? Mr. Wilder noticed that "I have tried many different acceleration factors on this system and have found that a consistent increase of 0.02 works best overall...the range for the incremental increase is between 0.018 and 0.021 " .
That was then, in 1978. Other times have come. Is our grandpa still right in his recommendations?
I made this tool to figure it out.
What is this tool?
This tool is a performance scanner that uses a decision tree-based algorithm under the hood to find the most profitable settings for PSAR. It analyzes a bunch of different Start (between 0.001 to 0.02 ) and Increment (between 0.001 to 0.03 ) parameters and backtests each combination across the entire history of an instrument. If the more profitable parameters were found, the indicator will switch its values to the found ones immediately.
Instead of manually selecting parameters, just relax - the algorithm will do it for you.
It doesn't touch the last parameter, Maximum , for two reasons.
First, as Mr. Wilder noticed in his book, "...the number of increases it takes to reach at least 0.2 , but do not exceed 0.22 " . That is, the parameter sits in a very narrow range.
Second, I tested different maximums and I came to the conclusion that this parameter has a minimal impact on net profit, compared with the more significant parameters of start and increment.
Alerts
It has an alert that notifies when the more profitable settings were detected.
NOTE : It does not change what has already been plotted.
Good luck!
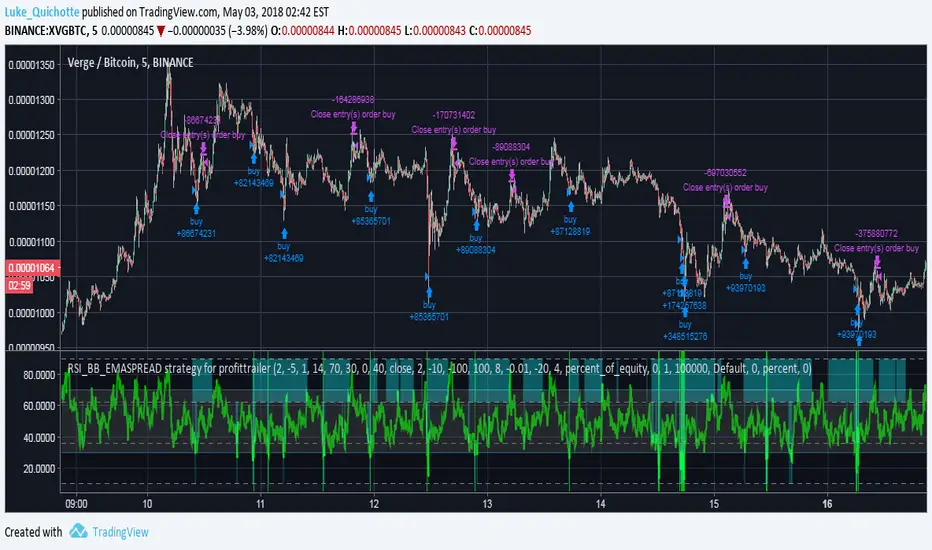
RSI_BB_EMASPREAD strategy for profittrailerProfittrailer 2 Strategy analyzer for 3 buy triggers: RSI, EMASPREAD and Bolinger Bands
features:
- 3 buy triggers: RSI, BB, EMASPREAD
- Each fully customizable
- Each can be turned off / on
- GAIN sell trigger
- Sell trailing
- DCA trigger (ANDERSON only)
- DCA levels
- Notification trigger, which u can use to set alarms in TV
Feedback or a thank you is much appreciated. Any requests to add features you think are especially useful are welcome.
If you'd like to support me through a donation, send me a message.
Profittrailer 2 Stoch RSIStoch RSI indicator for Profittrailer 2.
Currently PT2 does not do K & D. This should reflect the trigger as used

ProfitTrailer v2 LOWBB & RSI Buy SignalsThis script will display buy signals when configured LOWBB & RSI Conditions are met. I've created this script to help ProfitTrailer 2.0 subscribers understand when the bot will buy based on their selected RSI & BB values.
I will create more of these scripts so let me know in the comments if you would like to see some of the other strategies for example EMAGAIN + RSI + MACD or LOWBB + MACD etc. I will add the sell signals shortly.

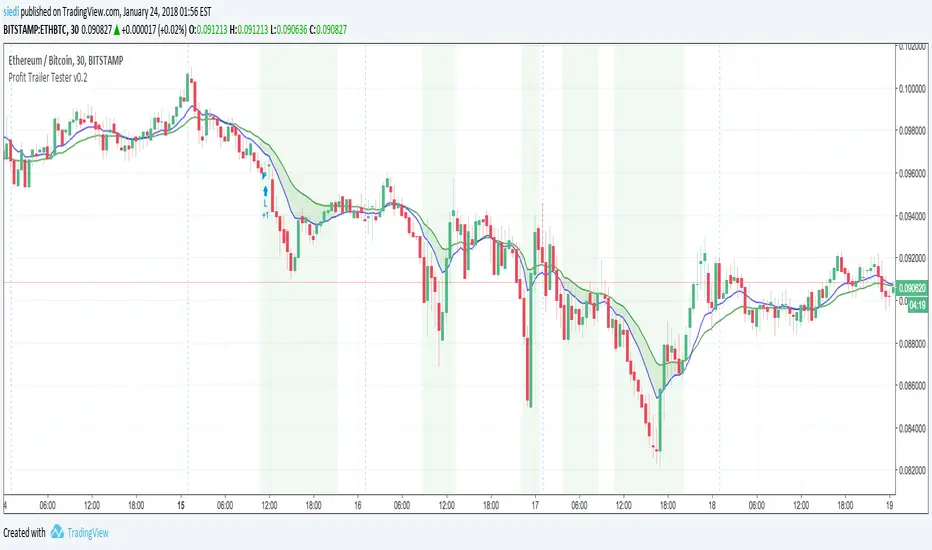
Profit Trailer Tester v0.2This script combines all buy and sell strategies of the Profit Trailer bot for research, backtesting (simulation) and teaching those strategies. Due to several reasons, the script cannot emulate the Profit Trailer strategies 100%. It is more to visualize the strategies and support you in your decisions.
It is an early version and still under heavy development and testing. Currently, 'DCA' and trailing are not implemented yet.
Please send a PM to get access to the script.
NOTICE: By requesting access to this script you acknowledge that you have read and understood that this is for research purposes only, and I am not responsible for any financial losses you may incur by using this script!
Profit Percentage TrackerThis script provides a quick and easy way to visualize profits in a chart, based on the given entry date and price.
Optionally, alerts can be sent when profits cross up the given " profit unit ".
In short:
Tracks how much profit one could take based on the input " entry date " and the input " entry price "
These inputs are interactive (www.tradingview.com)
Displays the result in a label on top of the last candle
(Optional) Sends alerts based on the given " profit unit ", that is: if ' 0.5 ' is given, then an alert is triggered every time the profit is raised by that number
(Be careful with low values, as TradingView could stop an alert if it triggers too much.)
For alerts to be displayed, a " script alert " must be created right after the script was added to the chart:
- www.tradingview.com
(Choose ' Profits ' as condition and ' Any alert() function call ')
Good to know: if you check " Notify on app ", alerts can be delivered directly to your phone:
i.imgur.com
Prerequirements :
The chart's timezone has to be set to " Exchange " (this is required in order to support the alert's logic):
- kodify.net

Profitable Vortex Indicator ScannerIntroduction
The Vortex Indicator is a technical indicator invented by Etienne Botes and Douglas Siepman (Technical Analysis of Stocks & Commodities, V.28:1 (January, 2010): "The Vortex Indicator") to identify the start of a new trend or the continuation of an existing trend within financial markets.
It is composed of two lines, +VI and -VI . +VI represents up trending momentum and -VI represents down trending momentum.
The most basic strategy is to use the crossovers as trade signals:
when +VI crosses above -VI , go Long
when -VI crosses above +VI , go Short
Exit when a crossover occurs in the opposite direction
What is this tool?
This tool is a performance scanner that uses a decision tree-based algorithm under the hood to find the most profitable period's setting for the indicator. It analyzes the range of periods between 2 to 100 and backtests the Vortex Indicator for each period using the strategy mentioned above across the entire history of an instrument.
Settings
Net Profit line is optional and can be hidden through settings.
Alerts
It has an alert that notifies when a more profitable period was detected.
NOTE : It does not change what has already been plotted.
Good luck!

Profitable MAMA & FAMA CrossoverIntroduction
The MESA Adaptive Moving Average (MAMA) was originally presented by John F. Ehlers. By design, it is a special kind of Exponential Moving Average with self-adjusting alpha. Its adaptation is based on the rate change of phase as measured by the Homodyne Discriminator and the alpha parameter is allowed to range between a maximum and minimum value (Fast Limit and Slow Limit).
Key Point: Ehlers suggested the maximum value to be 0.5 and the minimum to be 0.05 .
The variable alpha is computed as the Fast Limit divided by the phase rate of change. If the phase rate of change is large, the variable alpha is bounded at the SlowLimit. Then, this alpha is used to compute MAMA and FAMA (Following Adaptive Moving Average).
Should we rely on Ehlers' suggestions if we want to achieve the best result with MAMA & FAMA crossover system?
Well, he is a good specialist and widely recognized author, I respect him, but the answer is no and you can see results on the chart.
What is our goal?
We want to find the best configuration for MAMA & FAMA Crossover. To achieve that we need to analyze the MAMA's alpha parameter or, more specific, the bounds for this parameter, Fast and Slow Limits.
What is this tool?
This tool is a performance optimizer that uses decision tree-based algorithm under the hood to find the most profitable settings for the MAMA & FAMA Crossover. It analyzes a bunch of different Fast Limits (between 0.01 to 0.8 with step of 0.1 ) and Slow Limits (between 0.01 to 0.6 with step of 0.1 ) and backtests each combination across the entire history of an instrument. If the more profitable parameters were found, the indicator will switch its values to the found ones immediately.
So, instead of manually selecting and testing parameters just apply this indicator to your chart and
relax - the algorithm will find the best parameters for you
Alerts
It has a special alert that notifies when the more profitable settings were detected.
NOTE: It does not change what has already been plotted.
NOTE 2: This is not a strategy, but an algorithmic optimizer.
Reference: www.mesasoftware.com
MAMA & FAMA Crossover can be found here:

Profitable RSI (Relative Strength Index)Introduction
As you know the Relative Strength Index (RSI) was originally developed by J. Welles Wilder and was described in his book "New Concepts in Technical Trading Systems" (1978). It is intended to measure the strength or weakness of an instrument for the specified period.
The most basic strategy is to use the crossovers as trade signals:
when RSI crosses above 30, go Long
when RSI crosses below 70, go Short
Exit when a crossover occurs in the opposite direction
What is this tool?
This tool is a performance scanner that uses a decision tree-based algorithm under the hood to find the most profitable settings for RSI. It analyzes the range of periods between 2 to 100 and backtests the RSI for each period using the strategy mentioned above across the entire history of an instrument. If the more profitable parameter was found, the indicator will switch its value to the found one immediately.
So, instead of manually selecting parameters just apply it to your chart and relax - the algorithm will do it for you.
The algorithm can work in two modes: Basic and Advanced "Early Switch" . The Early Switch algorithm makes some assumptions and activates a set of optimizations to find the better setting DURING the trades, not after they were closed.
The difference is illustrated on the screenshot below:
Additionally you can set up a backtest window through indicator's settings (the optimizers which were published before will get this feature soon).
Alerts
It has a special alert that notifies when a more profitable period was detected.
NOTE: It does not change what has already been plotted.
NOTE 2: This is not a strategy, but an algorithmic optimizer.
Day after day. Night after night.
I've been waiting to program again.
Day after day. Night by to night.
Trading is waiting inside your heart.

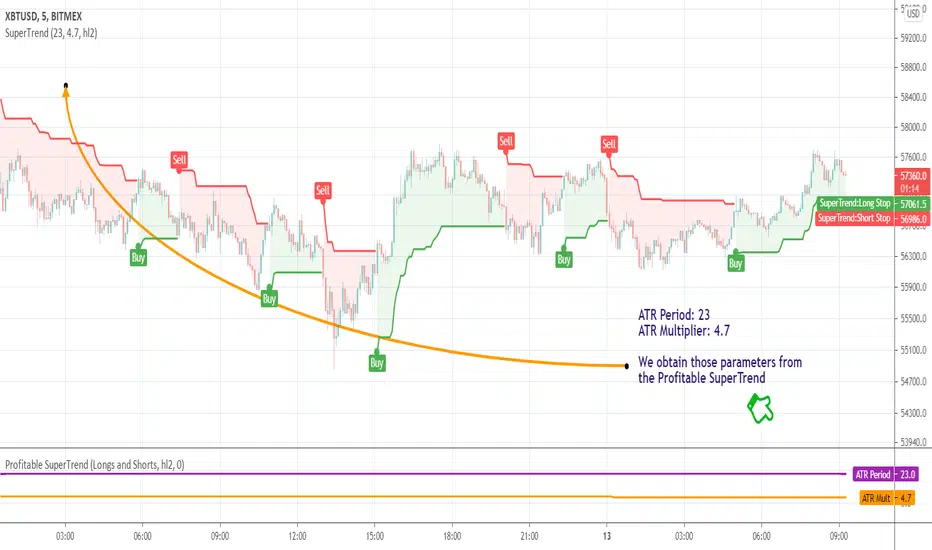
Profitable SuperTrendIntroduction
I was faced with the fact that many authors contradicted each other about the indicator settings. Each trader offers his(her) own settings, without having an evidence base. Therefore, I decided to make an algorithmic optimizer.
What is this tool?
This tool is a performance optimizer that uses a decision tree-based algorithm under the hood to find the most profitable settings for the SuperTrend indicator. It analyzes a bunch of different ATR Periods (between 3 to 45 ) and ATR Multipliers (between 1 to 8 with a decimal step of 0.1 ) and backtests each combination across the entire history of an instrument. If the more profitable parameters were found, the indicator will switch its values to the found ones immediately.
Instead of manually selecting parameters, just relax - the algorithm will do it for you.
Alerts
It has an alert that notifies when the more profitable settings were found.
NOTE: It does not change what has already been plotted before.
NOTE 2: The implementation of the SuperTrend indicator I used can be found here
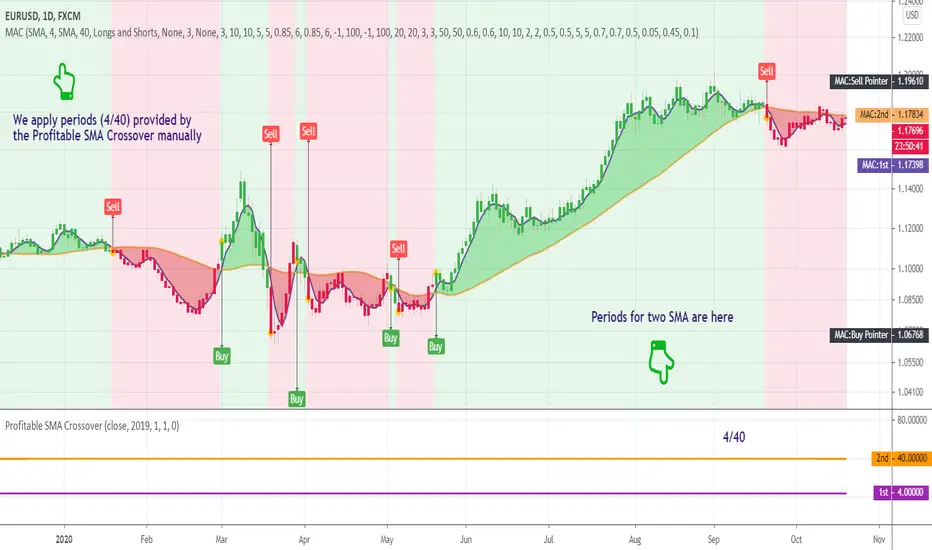
Profitable SMA CrossoverWhat is this tool?
This tool is a performance scanner of the crossover trading system that is based on the two simple moving averages (SMA). It uses a decision tree-based algorithm under the hood to find and plot the most profitable periods of the SMA combination.
It analyzes the range of periods between 4 to 45 and backtests each combination across the entire history of an instrument. If the more profitable periods were detected the indicator will switch periods of the moving averages immediately.
This is an add-on for the Ingenious SMA Crossover but can be used standalone.
Alerts
It has an alert that notifies when the more profitable periods were detected.
NOTE : It does not change what has already been plotted.
Good luck!
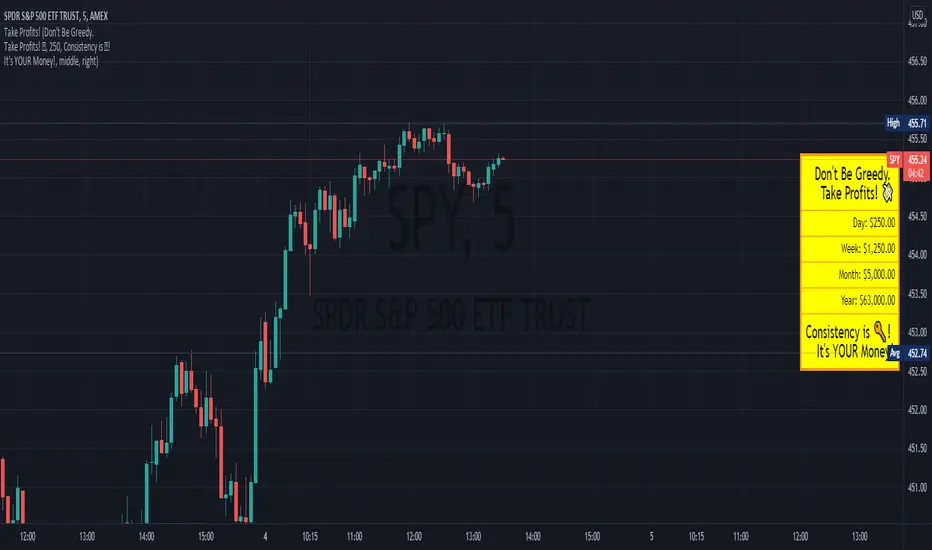
Profit ReminderThis is a Visual Indicator intended to be a reminder to those who need it!
This indicator allows you to set a profit level and displays the calculated values if you were to profit that amount each day.
The vision of this indicator is to get the user more green trades by reminding them to get out while they're ahead, because there are more days ahead!
It also allows for the user to set phrases that might help them with this.
Look forward to what's ahead and don't get caught up in over trading!
PROFIT MAKER |Crypto|ETH|BTC|YFI - SignalThis is the version with alerts of this strategy:
Description:
This is a trend-following strategy that works very well for many Crypto assets in the usd or usdt pair
It can be used for both futures and spot!
Some of the assets in which this strategy is proven are
Asset Exchange TF
BINANCE:ADAUSDT Binance 45m
BINANCE:BTCUSDT Binance 1h
BINANCE:YFIUSDT Binance 30m
BINANCE:DOTUSDT Binance 45m
BINANCE:ETHUSDT Binance 30m
BINANCE:LINKUSDT Binance 45m
BINANCE:DOGEUSDT Binance 1h
And many others..
What is this strategy based on?
It is a combination of various parameters, including
-RSI: The relative strength index ( RSI ) is a momentum indicator used in technical analysis that measures
the magnitude of recent price changes to evaluate overbought or oversold conditions in the price of a stock or other asset.
-MACD: Moving average convergence divergence ( MACD ) is a trend-following momentum indicator that shows
the relationship between two moving averages of a security’s price.
-ADX: ADX is used to quantify trend strength. ADX calculations are based on a moving average of price range expansion over a given period of time.
-DMI: DMI is a moving average of range expansion over a given period (the default is 14 days). The positive directional
movement indicator ( +DMI ) measures how strongly price moves upward; the negative directional movement indicator ( -DMI )
measures how strongly price moves downward. The two lines reflect the respective strength of the bulls versus the bears.
Included:
Different forms of Take profit, included:
Take profit on squeeze candles
Take profit based on Risk-Benefit (RR)
Take profit a pre-determined %.
Different forms of Stop Loss, including
ATR-based stop loss
Trail stop loss (with option to use a trigger)
Stop loss a pre-determined %.
For access you can send a message or consult in my social networks.
Links in my tradingview signature (below).
Examples:
The default configuration works very well for most pairs.
You just have to look for which time frame goes better with each one.
Recommended to try with 30m, 45m and 1 hour.

PROFIT MAKER |Crypto|ETH|BTC|YFIThis is a trend-following strategy that works very well for many Crypto assets in the usd or usdt pair
It can be used for both futures and spot!
Some of the assets in which this strategy is proven are
Asset Exchange TF
BINANCE:ADAUSDT Binance 45m
BINANCE:BTCUSDT Binance 1h
BINANCE:YFIUSDT Binance 30m
BINANCE:DOTUSDT Binance 45m
BINANCE:ETHUSDT Binance 30m
BINANCE:LINKUSDT Binance 45m
BINANCE:DOGEUSDT Binance 1h
And many others..
BINANCE:BTCUSDT
BINANCE:LINKUSDT
What is this strategy based on?
It is a combination of various parameters, including
-RSI: The relative strength index (RSI) is a momentum indicator used in technical analysis that measures
the magnitude of recent price changes to evaluate overbought or oversold conditions in the price of a stock or other asset.
-MACD: Moving average convergence divergence (MACD) is a trend-following momentum indicator that shows
the relationship between two moving averages of a security’s price.
-ADX: ADX is used to quantify trend strength. ADX calculations are based on a moving average of price range expansion over a given period of time.
-DMI: DMI is a moving average of range expansion over a given period (the default is 14 days). The positive directional
movement indicator (+DMI) measures how strongly price moves upward; the negative directional movement indicator (-DMI)
measures how strongly price moves downward. The two lines reflect the respective strength of the bulls versus the bears.
Included:
Different forms of Take profit, included:
Take profit on squeeze candles
Take profit based on Risk-Benefit (RR)
Take profit a pre-determined %.
Different forms of Stop Loss, including
ATR-based stop loss
Trail stop loss (with option to use a trigger)
Stop loss a pre-determined %.
**All trades include 0.1% of fees + slippage
** The statistics displayed are for the year 01-01-2020 and the period from 2021 to the date of publication (14-01-2020)
For access you can send a message or consult in my social networks.
Links in my tradingview signature (below).

Profit Hunter The Tower of Data指標用途 / Purpose of the Indicator
中文:本指標旨在綜合監測加密貨幣市場的狀況。透過分析比特幣與以太坊的市值佔比、穩定幣市場比率、歷史最高點距離(ATH)及波動性指標(ATR),交易者可以獲取市場動態、評估風險以及尋找潛在的交易機會。
English: This indicator aims to provide a comprehensive monitoring of the cryptocurrency market conditions. By analyzing the market dominance of Bitcoin and Ethereum, the stablecoin market ratio, distance to all-time high (ATH), and volatility indicator (ATR), traders can gain insights into market dynamics, assess risks, and identify potential trading opportunities.
指標依據 / Basis of the Indicator
中文:1. 市值佔比:計算比特幣和以太坊在總市場中的佔比,幫助判斷主流加密貨幣的市場情緒。 2. 穩定幣比率:評估比特幣市值與穩定幣總市值的比例,反映資金在風險資產和穩定幣之間的流動情況。 3. 歷史最高點距離(ATH):顯示當前價格距離歷史最高價的百分比,幫助識別潛在的市場頂部或底部。 4. ATR 波動性指標:使用平均真實範圍(ATR)來測量市場的波動性,為風險管理提供參考。
English: 1. Market Dominance: Calculates the market share of Bitcoin and Ethereum in the total market, helping to assess the market sentiment of major cryptocurrencies. 2. Stablecoin Ratio: Assesses the ratio of Bitcoin's market cap to the total market cap of stablecoins, reflecting the flow of funds between risk assets and stablecoins. 3. Distance to All-Time High (ATH): Displays the percentage distance from the current price to the historical peak, helping to identify potential market tops or bottoms. 4. ATR Volatility Indicator: Uses Average True Range (ATR) to measure market volatility, providing a reference for risk management.
數值大小含意及操作建議 / Value Interpretation and Trading Suggestions
中文:1. 市值佔比:> 60% 顯示市場對比特幣和以太坊的信心較高,適合進行長期持有或交易;< 60% 可能表示資金流出,需謹慎觀察市場情緒。 2. 穩定幣比率:> 700% 表明市場對比特幣的信心強,適宜進場交易;< 700% 反映市場對穩定幣的需求增加,建議觀望。 3. ATH 距離:正值顯示當前價格低於歷史最高點,可能存在回升機會;負值則表示當前價格高於歷史最高點,需謹慎進場。 4. ATR 波動性指標:1-30 分 市場波動性低,適合穩健操作;31-70 分 市場波動性中等,需注意潛在風險;71-99 分 市場波動性高,建議減少倉位或觀望。
English: 1. Market Dominance: > 60% indicates high confidence in Bitcoin and Ethereum, suitable for long-term holding or trading; < 60% may indicate capital outflow, caution is advised. 2. Stablecoin Ratio: > 700% suggests strong confidence in Bitcoin, suitable for entering trades; < 700% reflects increased demand for stablecoins, suggesting a watchful approach. 3. Distance to All-Time High (ATH): Positive values indicate the current price is below the historical peak, presenting a potential rebound opportunity; negative values indicate the current price is above the historical peak, caution is advised. 4. ATR Volatility Indicator: 1-30 Points indicates low market volatility, suitable for stable operations; 31-70 Points indicates moderate market volatility, watch for potential risks; 71-99 Points indicates high market volatility, recommend reducing positions or adopting a wait-and-see approach.

Cryptocurrency Profitability Rankings PRO Customisable ListA good cryptocurrency may multiply your earnings - with the same effort.
This indicator helps crypto traders to find the trading securities that suit their profitability and volatility preference.
This indicator calculates and generate a ranking of profitability from a user-defined list of cryptocurrencies, based on MACD cycles within user-defined time span.
Multiple time frames: This indicator is designed for day trading, so suggested time frames are: 3m, 5m, 15m, 30m, 1H. Users can try other time frames (< 1D) if they find it useful.
This is PRO version of Cryptocurrency Profitability Rankings with Popular List, developed based on Profitability Meter for Day Trading PRO
PRO Version advanced functions:
Customisable(User-Defined) Cryptocurrency List
Option to select Open or Close price as start point for calculation.
Flexible Time Span Type: Hours and Bars, besides Days
More statistics options: Display price change(%) of latest rising/falling MACD cycle
Free trial for two weeks: Please leave a comment asking for a trial, you should get access within 48 hours. In case it doesn't work, please message the author.
Format Configuration:
Profitability Threshold: a percentage of price movement within a MACD cycle that a user thinks can be used to define profitability, defval: 0.8%.
Select open or close as start point: which can affect the results greatly, as difference between open and close can be significant, especially for big time interval.
Statistics Options
timeSpan: time span for statistics
timeSpanType: time span type for statistics
User-defined cryptocurrencies list: up to 10 items
About Customisable List of Cryptocurrency:
At present, in Pine Language, there is no method to plot a string input variable. Therefore, fixed handles are used to represent each symbol name, eg. "Sym_10". User need to remember the order of the list or refer to "Format".
Make sure to input correct tiers, eg. "BITFINEX:ETHUSD"
Related Indicators:
Profitability Meter for Day Trading PRO - Calculating and evaluating individual trading security's profitability.
About Loading Time: It may take up to 2 minutes for your browser to load a new format setting, depending on the your computer and network speed.
List of the author's Indicators
www.tradingview.com
Disclaim: By using or requesting access to this indicator, you acknowledge that you have read and accepted that this indicator is for study purposes only and it does NOT guarantee you will make money.
I am not financial adviser and I am NOT responsible for any profits or losses you may incur by using this indicator!
Users should make their own decisions, carefully assess risks and be responsible for investment and trading activities.
The latest updates override the previous description. Please check the updates.
加密货币赢利潜力排行指标 PRO 自定义列表
优质的交易币种可能倍增你的收益-在付出同样的努力的情况下。
该指标基于Profitability Meter for Day Trading PRO开发,帮助加密货币交易员找到适合其赢利性和波动率偏好的币种。
该指标根据用户定义的时间跨度内的MACD周期,计算和比对用户自定义的一组虚拟货币,生成一个赢利潜力排名。
多时间维度:本指标为日内交易设计,因此建议使用时间维度:3m,5m,15m,30m,1H; 如果用户需要,也可以用于其他小于1D的维度。
免费试用两周:跟帖评论要求试用,您应该在48小时内获得访问权限。 如果没有获得,请私信开发者。
这是Cryptocurrency Profitability Rankings with Popular List的PRO版本
可自定义加密货币列表,上至10个
可选择开盘价或收盘价作为计算起点。
灵活的时间跨度类型:小时,蜡烛数,天数
更多统计选项:显示最近上涨/下跌的MACD周期的价格变动(%)
格式配置:
盈利能力阈值:用户自定义的MACD单次波动的可赢利的百分比,默认为0.8%
选择开盘或者收盘作为起点:这会对结果产生很大影响,因为开盘价和收盘价之间的差异可能很大,特别是在较大的时间维度。
统计选项
timeSpan:统计功能的时间跨度
timeSpanType:统计功能的时间跨度单位
用户自定义的加密货币列表输入栏
关于自定义的加密货币列表:
目前,在Pine Language中,不能打印字符串输入变量。 因此,使用顺序数字字符代表币种名称,例如。“Sym_10”。 用户需要记住其输入币种的顺序或随时参考“格式设置”中的顺序。
确保输入正确的交易所和币种名称,例如。 “BITFINEX:ETHUSD”。
相关指标:
日内交易盈利潜力指示仪PRO (Profitability Meter for Day Trading PRO):用于计算和评估单个交易品种的盈利能力
关于载入新设置:每次载入新的设置可能需要0-2分钟,取决于用户的电脑配置和网络速度。
试用开发者的其他指标
www.tradingview.com
免责声明:在要求获得本指标使用权之前以及在使用本指标之前,用户认可已经完全了解和接受:本指标仅供教育和研究目的, 它不提供任何赢利的可能性。
本指标的开发者并非专业投资顾问,因此不对用户的任何赢亏负责。
用户应独立判断,审慎评估并自负投资和交易风险!
最新更新会覆盖之前的说明。 请检查更新。

Cryptocurrency Profitability Rankings with Popular ListA good cryptocurrency may multiply your earnings - with the same effort.
This indicator helps crypto traders to find the trading securities that suit their profitability and volatility preference.
This indicator calculates and generate a ranking of profitability from a popular list of crypto currencies, based on MACD cycles within user-defined time span.
Multiple time frames: This indicator is designed for day trading, so suggested time frames are: 3m, 5m, 15m, 30m, 1H. Users can try other time frames (< 1D) if they find it useful.
Developed based on Profitability Meter for Day Trading PRO
About popular list of Cryptocurrency:
The author has the right to change the list from time to time without notice.
PRO Version of this Indicator: (invite-only)
Advanced functions:
Customisable(User-Defined) Cryptocurrency List
Option to select Open or Close price as start point for calculation.
Flexible Time Span Type: Hours and Bars, besides Days
More statistics options: Display price change(%) of latest rising/falling MACD cycle
Format Configuration:
Profitability Threshold: a percentage of price movement within a MACD cycle that a user thinks can be used to define profitability, defval: 0.8%.
Statistics Options
timeSpan: time span for statistics
timeSpanType: time span type for statistics
Related Indicators:
Profitability Meter for Day Trading PRO - Calculating and evaluating individual trading securitie's profitability.
About Loading Time: It may take up to 2 minutes for your browser to load a new format setting, depending on the your computer and network speed.
List of the author's Indicators
www.tradingview.com
Disclaim: By using or requesting access to this indicator, you acknowledge that you have read and accepted that this indicator is for study purposes only and it does NOT guarantee you will make money.
I am not financial adviser and I am NOT responsible for any profits or losses you may incur by using this indicator!
Users should make their own decisions, carefully assess risks and be responsible for investment and trading activities.
The latest updates override the previous description. Please check the updates.
加密货币赢利潜力排行指标 热门列表
优质的交易币种可能倍增你的收益-在付出同样的努力的情况下。
该指标基于Profitability Meter for Day Trading PRO开发,帮助加密货币玩家找到适合其赢利性和波动率偏好的币种。
该指标根据用户定义的时间跨度内的MACD周期,计算和比对一组虚拟货币,生成一个赢利潜力排名。
多时间维度:本指标为日内交易设计,因此建议使用时间维度:3m,5m,15m,30m,1H; 如果用户需要,也可以用于其他小于1D的维度。
关于加密货币的热门列表:
作者有权随时更改列表,恕不另行通知。
该指标的PRO版本:Cryptocurrency Profitability Rankings PRO with Customisable List (Invite-Only)
可自定义加密货币列表,上至10个
可选择开盘价或收盘价作为计算起点。
灵活的时间跨度类型:小时,蜡烛数,天数
更多统计选项:显示最近上涨/下跌的MACD周期的价格变动(%)
格式配置:
盈利能力阈值:用户自定义的MACD单次波动的可赢利的百分比,默认为0.8%
统计选项
timeSpan:统计功能的时间跨度
timeSpanType:统计功能的时间跨度单位
相关指标:
日内交易盈利潜力指示仪PRO (Profitability Meter for Day Trading PRO):用于计算和评估单个交易品种的盈利能力
关于载入新设置:每次载入新的设置可能需要0-2分钟,取决于用户的电脑配置和网络速度。
试用开发者的其他指标
www.tradingview.com
免责声明:在要求获得本指标使用权之前以及在使用本指标之前,用户认可已经完全了解和接受:本指标仅供教育和研究目的, 它不提供任何赢利的可能性。
本指标的开发者并非专业投资顾问,因此不对用户的任何赢亏负责。
用户应独立判断,审慎评估并自负投资和交易风险!
最新更新会覆盖之前的说明。 请检查更新。

Net Unrealized Profit Loss | JeffreyTimmermansNet Unrealized Profit Loss (NUPL)
The "Net Unrealized Profit Loss" (NUPL) indicator is a highly regarded tool for assessing Bitcoin investor sentiment by analyzing the relationship between Market Value and Realized Value. This Pine Script implementation, developed by Jeffrey Timmermans, includes additional features such as dynamic labels, alerts, and thresholds with color-coded bands, enhancing its usability for traders and analysts.
Core Concepts Behind NUPL
Market Value (MV):
Defined as the current Bitcoin price multiplied by the number of coins in circulation.
Equivalent to market capitalization in traditional finance.
Realized Value (RV):
Calculated by considering the price at which each Bitcoin last moved (e.g., transferred between wallets).
The average price of all these transactions is multiplied by the total coins in circulation.
Net Unrealized Profit Loss (NUPL):
Formula: NUPL = (Market Value − Realized Value) : Market Value × 100
Measures the proportion of paper profits or losses held by investors relative to the market cap.
Significance of NUPL:
Tracks investor sentiment over time.
A high NUPL value indicates that most investors are in profit, often signaling potential market overheating.
A low or negative NUPL suggests pessimism and undervaluation, which may precede market recovery.
How to View the Chart
The NUPL chart uses distinct percentage bands to delineate various market phases. These bands provide context for understanding investor sentiment and market stages:
Extreme Low Values (< 0%): Indicates widespread losses; the market may be near capitulation.
Neutral Value (0%): A balance between profit and loss; often signifies a transition phase.
Slightly High to High Values (> 0% to 50%): Increasing profits suggest growing optimism; early stages of bullish trends.
Extreme High Values (> 75%): Signals overheating; often corresponds to excessive greed, which may precede corrections.
The colored bands visually represent these stages, enabling traders to identify key turning points.
Features of the Script
Querying Data
The indicator uses data from two key sources:
Bitcoin Market Cap (MC1): GLASSNODE:BTC_MARKETCAP
Bitcoin Realized Cap (MCR): COINMETRICS:BTC_MARKETCAPREAL
These values are fetched using the request.security function to ensure daily accuracy, regardless of the chart's timeframe.
Threshold Calculation
The script computes NUPL values dynamically and compares them against historical lows:
Calculated using the ta.lowest function over a 1,000-bar lookback period.
The average of the historical low and the current NUPL value, providing a dynamic baseline.
Value Classification
NUPL is categorized into sentiment levels with corresponding weights:
< Low Threshold: 1 (Extreme Bearish)
Low to 0: 0.75 (Moderate Bearish)
0 to 25: 0.25 (Neutral to Slightly Bullish)
25 to 50: -0.25 (Moderate Bullish)
50 to 75 : -0.75 (Strong Bullish)
> 75: -1 (Extreme Bullish)
Visual Elements
NUPL Line Plot:
The NUPL line is plotted in orange for clear visibility.
Threshold Bands:
Horizontal thresholds ranging from -160 to 160 and are plotted, representing key sentiment levels. Bands are categorized as:
Extreme High/Low Values
Significant High/Low Values
Neutral Values
Fill Colors:
Red Shades (Bearish Sentiment): Above neutral levels.
Green Shades (Bullish Sentiment): Below neutral levels.
The opacity of fills decreases as sentiment moves from extreme to neutral values.
Dynamic Label:
A real-time label displays the current NUPL value and sentiment classification.
Positioned directly on the NUPL line for immediate insight.
Alerts:
The indicator includes two alerts for crossing key thresholds:
NUPL Above 0% Alert: Triggers when NUPL crosses above the neutral value, signaling a shift to positive sentiment.
NUPL Below 0% Alert: Triggers when NUPL crosses below the neutral value, indicating a shift to negative sentiment.
Alerts are configured with alert.freq_once_per_bar to avoid redundancy during intra-bar fluctuations.
Use Cases
Identifying Market Extremes:
Use NUPL levels to pinpoint moments of extreme greed or fear, which often precede market reversals.
Long-Term Strategy:
NUPL trends can assist strategic investors in deciding when to accumulate during pessimistic phases or take profits during euphoria.
Market Sentiment Analysis:
Provides a macro perspective on the prevailing investor sentiment, offering valuable context for trading decisions.
Conclusion
The Net Unrealized Profit Loss (NUPL) indicator combines advanced data processing with intuitive visualization to deliver actionable insights into Bitcoin market sentiment. With its real-time alerts, dynamic labels, and comprehensive banding system, this tool is indispensable for traders and investors seeking to understand and anticipate market movements based on sentiment analysis.
-Jeffrey

Realized Profit & Loss [BigBeluga]The Realized Loss & Profit indicator aims to find potential dips and tops in price by utilizing the security function syminfo.basecurrency + "_LOSSESADDRESSES".
The primary objective of this indicator is to present an average, favorable buying/selling opportunity based on the number of people currently in profit or loss.
The script takes into consideration the syminfo.basecurrency, so it should automatically adapt to the current coin.
🔶 USAGE
Users have the option to enable the display of either Loss or Profit, depending on their preferred visualization.
Examples of displaying Losses:
Example of displaying Profits:
🔶 CONCEPTS
The concept aims to assign a score to the data in the ticker representing the realized losses. This score will provide users with an average of buying/selling points that are better to the typical investor.
🔶 SETTINGS
Users have complete control over the script settings.
🔹 Calculation
• Profit: Display people in profit on an average of the selected length.
• Loss: Display people in loss on an average of the selected length.
🔹 Candle coloring
• True: Color the candle when data is above the threshold.
• False: Do not color the candle.
🔹 Levels
- Set the level of a specific threshold.
• Low: Low losses (green).
• Normal: Low normal (yellow).
• Medium: Low medium (orange).
• High: Low high (red).
🔹 Z-score Length: Length of the z-score moving window.
🔹 Threshold: Filter out non-significant values.
🔹 Histogram width: Width of the histogram.
🔹 Colors: Modify the colors of the displayed data.
🔶 LIMITATIONS
• Since the ticker from which we obtain data works only on the daily timeframe, we are
restricted to displaying data solely from the 1D timeframe.
• If the coin does not have any realized loss data, we can't use this script.
