Federal Funds Rate Projections [tedtalksmacro]Track the Federal Funds Rate projections for each month via the Fed Funds Rate Futures Contracts CBOT:ZQ1!
This will be updated monthly to ensure that the current and relevant contracts are implemented.
Traders can use this to speculate on whether the Federal Reserve is likely to raise, cut or do nothing to their key interest rate at the next meeting.
Cerca negli script per "track"

FANG INDICATORTrack the strength of any group of stocks that are driving markets. This defaults to FANG. In the settings, replace the symbols to better fit the environment such as replacing NFLX with AAPL.

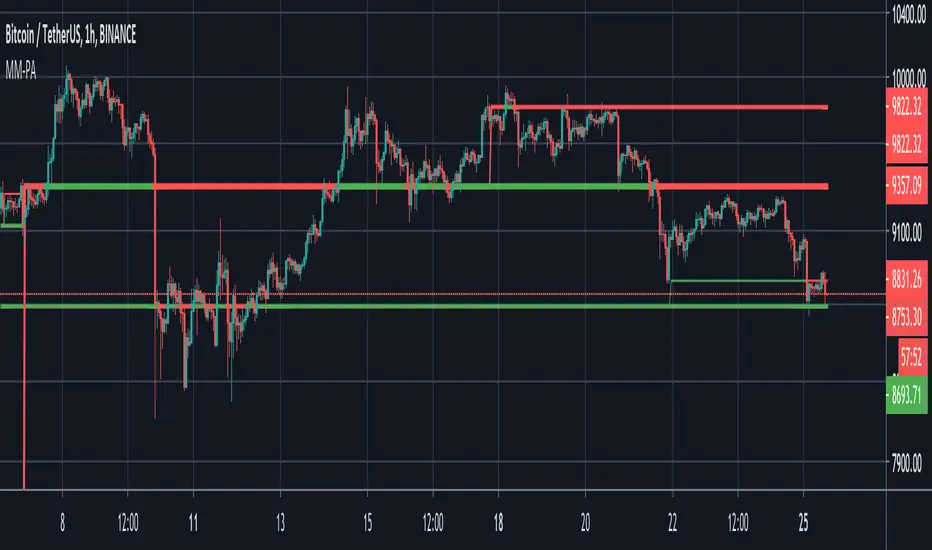
Multi Timeframe Rolling Bitmex Liquidation LevelsTrack Bitmex liquidations levels in real-time with a rolling VWMA or VWAP basis.
Allows the input of a different time frame if you wish.

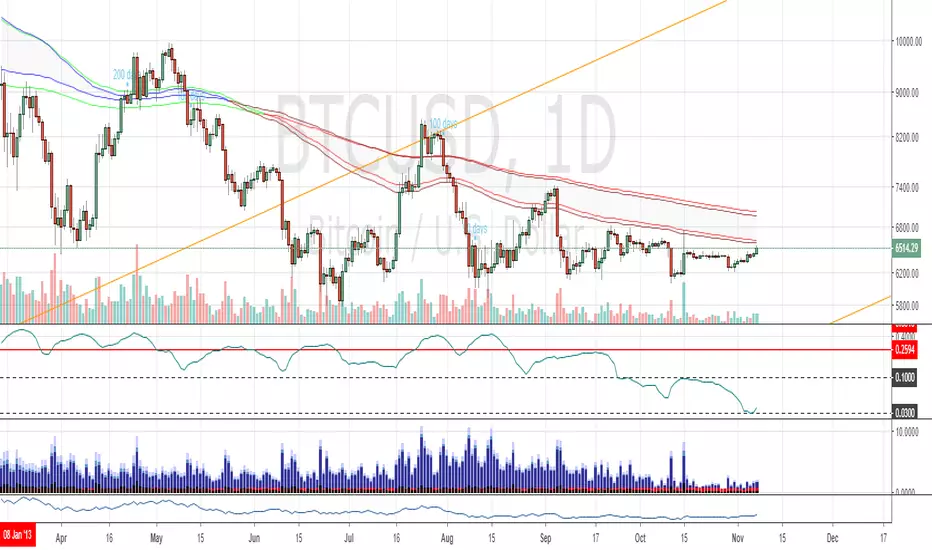
200/100 vs 190/80 EMA [jarederaj]Track the 200/100 EMA cross Vs the 180/90 EMA cross. Also, see the dates when these periods start on the chart.
Consecutive Highs/LowsTrack consecutive new highs/lows outside the Donchian range. Fans of the oldschool Turtle Strategy should enjoy the visualization.
Same logic as my "Walking the Bands" script, just with Donchian breaks instead of Bollinger tags.


Altcoin PortfolioTrack your altcoin portfolio balance in Fiat currency.
Make sure to open the data window to the right of your charts, it makes everything alot easier to read at a glance.
To learn more about customizing this script to fit your portfolio, watch the video here: youtu.be
To get more cool scripts and up-to-date information about Autoview, join us in slack slack.with.pink
As per the usual, we hope this script helps with your trading venture.
Good luck, and happy trading.

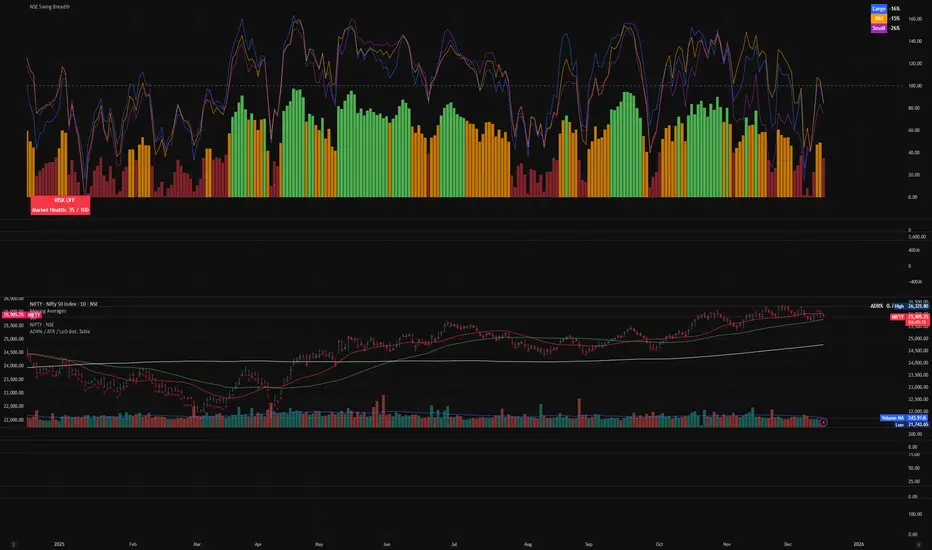
NSE Swing Breadth NSE Swing Breadth – Market Health Dashboard (0–200, % from Neutral)
Overview
NSE Swing Breadth – Market Health Dashboard is a market-wide health and regime indicator designed to track internal strength and participation across Large-, Mid-, and Small-cap indices in the Indian equity market.
Instead of focusing on price alone, this tool measures how strongly each segment is behaving relative to its own swing trend, normalizes those movements, and combines them into a single Market Health score. The result is a clean, objective dashboard that helps traders identify Risk-On, Caution, and Risk-Off regimes.
This indicator is best used for position sizing, exposure control, and timing aggressiveness, rather than individual stock entries.
Data Used
The indicator internally tracks three broad NSE indices:
Large Caps → NIFTY100EQUALWEIGHT
Mid Caps → NIFTYMIDCAP150
Small Caps → NIFTYSMLCAP250
Using equal-weighted and broad indices ensures the signal reflects true market participation, not just index heavyweights.
Core Logic
1. Swing Strength Model
For each index, the script calculates normalized swing strength:
Price is compared to its EMA swing baseline
The deviation from the EMA is normalized using the EMA of absolute deviations
This creates a volatility-adjusted strength value, allowing fair comparison across market regimes
This answers the question:
Is this segment pushing meaningfully above or below its recent trend?
2. Strength Converted to % from Neutral (Baseline = 100)
Each segment’s strength is converted into percentage-style points around a neutral baseline of 100:
100 = Neutral
+15 = +15% strength above neutral
–20 = –20% weakness below neutral
These values are plotted as three smooth lines:
Blue → Large Caps
Orange → Mid Caps
Purple → Small Caps
This makes relative leadership and divergence immediately visible.
3. Market Health Score (0–100)
The indicator combines all three segments into a single Market Health score:
Large Caps → 40% weight
Mid Caps → 35% weight
Small Caps → 25% weight
Extreme values are clamped to avoid distortion, and the final score is normalized to a 0–100 scale:
70–100 → Strong, broad participation
40–69 → Mixed / unstable participation
0–39 → Weak, risk-off conditions
Visual Components
📊 Market Health Histogram
A vertical histogram displays Market Health (0–100) with enhanced visibility:
🟢 Green (≥ 70) → Strong Risk-On regime
🟠 Orange (40–69) → Caution / Transition
🔴 Red (< 40) → Risk-Off regime
The histogram is visually compact and designed to reflect true market health, not exaggerated spikes.
📈 Strength Lines (Baseline = 100)
Three strength lines show % deviation from neutral:
Above 100 → Positive internal strength
Below 100 → Internal weakness
These lines help identify:
Leadership (which segment is driving the market)
Early deterioration (small/mid caps weakening first)
Broad confirmation (all segments rising together)
Dashboard Tables
📌 Market Regime Table (Bottom-Left)
Displays the current market regime:
🟢 RISK ON
🟡 CAUTION
🔴 RISK OFF
Along with the exact Market Health score (0–100).
📌 Strength Table (Top-Right)
Shows Large / Mid / Small cap strength as % from neutral, for example:
+18% → 18% above neutral
–12% → 12% below neutral
This avoids misleading interpretations and keeps values intuitive and actionable.
How to Use This Indicator
Risk-On (Green)
Favor full position sizes, trend-following strategies, and broader participation trades.
Caution (Orange)
Reduce leverage, tighten stops, and be selective. Expect choppiness.
Risk-Off (Red)
Prioritize capital protection, reduce exposure, and avoid aggressive longs.
This indicator is not an entry signal — it is a market environment filter.
⚠️ Important Style Setting (Required)
For correct visualization:
Settings → Style → Uncheck “Labels on price scale”
This prevents the indicator’s internal 0–200 model scale from interfering with the chart’s price scale and keeps the pane clean and readable.
Summary
NSE Swing Breadth – Market Health Dashboard provides a clear, objective view of market internals, helping traders align their risk with the true underlying condition of the market — not just price movement.
It is especially effective for:
Market regime identification
Exposure management
Avoiding false breakouts in weak breadth environments
FX Session High/Low Bands - Last 5 EST Days
FX Session High/Low Bands - Last 5 Days
Description:
This indicator plots horizontal bands representing the high and low price levels from the major forex trading sessions over the last 5 days. It helps traders identify key support and resistance zones based on recent session activity.
Features:
Multiple Session Tracking: Displays high/low levels for major FX sessions:
Asian Session (Tokyo)
European Session (London)
US Session (New York)
5-Day Lookback: Captures the highest high and lowest low from each session over the previous 5 trading days
Visual Bands: Clear horizontal lines or filled zones showing session boundaries
Dynamic Updates: Automatically recalculates as new session data becomes available
How to Use:
Support/Resistance: Previous session highs/lows often act as key price levels
Breakout Trading: Watch for price breaking above/below session bands
Range Trading: Trade within the bands during consolidation periods
Session Overlap: Pay attention to multiple session bands converging
Ideal For:
Forex day traders
Session-based trading strategies
Support/resistance identification
Multi-timeframe analysis

MTF Key Levels Pro [Confluence & Flow]MTF Key Levels Pro is an all-in-one market structure and context toolkit designed to reduce chart noise and surface the price levels that matter most. It combines multi-timeframe trend alignment, institutional-style reference levels (VWAP anchors, pivots, volume POC, prior day levels), and confluence detection so you can quickly identify where price is likely to react—and whether the broader flow supports continuation or reversal.
This script is intentionally modular: you can enable only what you trade (scalping, day trading, swing, position) while keeping the chart readable via selective plotting and a compact MTF dashboard.
What It Does
1) Key Levels Engine (Core Map)
The indicator plots a “key-level stack” from multiple methodologies so you are not relying on a single lens:
Volume Profile POC (Point of Control) over a configurable lookback (highest traded activity zone).
Daily Pivot Levels calculated from prior day H/L/C (PP, R1, S1 and extended levels in the logic).
Fibonacci Retracements from recent swing range (38.2 / 50 / 61.8).
Moving Averages (three configurable MAs for trend structure).
Previous Day High/Low (PDH/PDL) for intraday reference points.
ATH/ATL tracking (optional) for macro context.
2) Anchored VWAP Suite (Flow Anchors)
A multi-anchor VWAP system that resets and recalculates at the start of each period:
Hourly VWAP (scalping / micro-structure)
Daily VWAP (day trading standard reference)
Weekly VWAP (swing context)
Monthly VWAP (position context)
3) Multi-Timeframe Alignment Dashboard (Trend Consensus)
The dashboard pulls 5 configurable timeframes (defaults: 5m, 30m, 1h, 4h, D) and displays:
Price snapshot per timeframe
Trend direction (simple momentum/trend comparison vs lookback)
Volume
% change
Alignment status (BULL ALIGNED / BEAR ALIGNED / MIXED), including bars since alignment began
Use this to avoid trading against higher timeframe pressure and to time entries when multiple timeframes agree.
4) Order-Flow Lite (Volume & Delta)
A practical “flow confirmation” layer using candle-based volume classification:
Buy vs sell volume approximation (close vs open)
Delta strength label (Strong Buy / Strong Sell / Neutral)
Volume surge detection vs SMA(volume) with a configurable multiplier
Optional background shading on surge events
5) Confluence Zones (Signal Compression)
Confluence zones automatically form when multiple independent levels cluster together within a configurable tolerance:
You choose tolerance % and minimum levels required (e.g., 3+).
Zones are plotted as highlighted regions and listed in the dashboard with proximity markers (AT / NEAR).
This is the “decision layer”: the script doesn’t just draw levels—it tells you where multiple reasons to react overlap.
How to Use It (Practical Outline)
Typical Workflow
Check dashboard alignment: trade with alignment for continuation setups; treat MIXED as caution/mean-reversion regime.
Identify nearest confluence zones: prioritize trades at/near zones versus isolated single levels.
Use VWAP anchor + PDH/PDL + Pivot as the intraday framework, then confirm with volume surge/delta bias.
Manage risk around zones: zones are natural areas for rejection, breakout, or retest logic.
Recommended Configurations (Quick Start)
Scalping (1m–5m chart): Hourly VWAP + Daily VWAP + Daily Pivots + Confluence
Day Trading (5m–1h): Daily VWAP + Pivots + PDH/PDL + Confluence + Alignment dashboard
Swing (1h–4h): Weekly VWAP + MA50/MA200 + Confluence + Alignment
Position (D/W): Monthly VWAP + MA200 + ATH/ATL + Confluence
Alerts Included
Confluence Touch: triggers when price is within proximity of a confluence zone.
Trend Change: triggers when the alignment state changes (e.g., MIXED → BULL ALIGNED).
Volume Spike: triggers on surge events versus the configured baseline.
Notes / Intended Use
This indicator is built for context and decision support (key levels + trend consensus + flow cues). It is not a standalone “buy/sell system” by design; instead, it provides a structured map for entries, invalidation, and target planning around areas of highest market agreement.
If you want, I can also produce a TradingView-ready “Description + Feature bullets + How to trade + Settings guide + Alert guide” in the exact formatting style commonly used on public TradingView scripts (including a short disclaimer and a clean feature list).

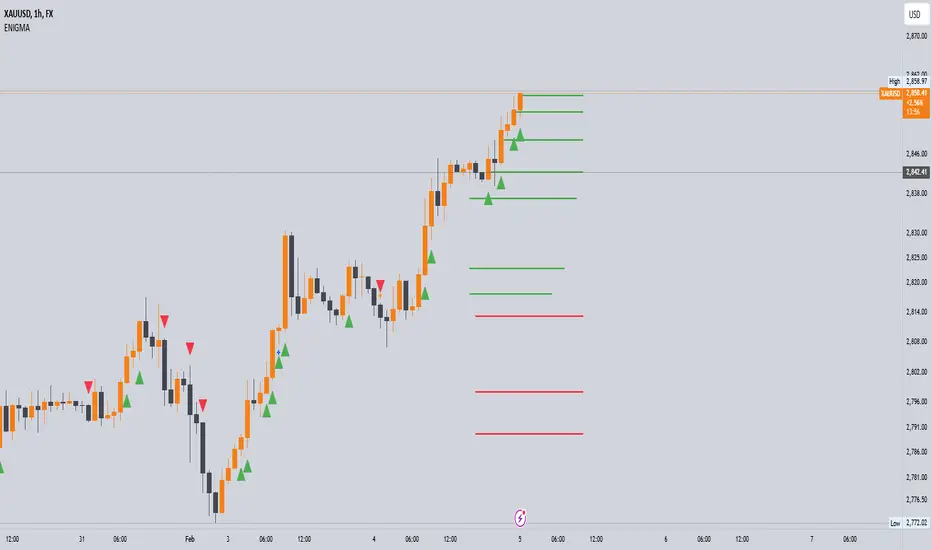
Enigma UnlockedENIGMA Indicator: A Comprehensive Market Bias & Success Tracker
The ENIGMA Indicator is a powerful tool designed for traders who aim to identify market bias, track price movements, and evaluate trade performance using multiple timeframes. It combines multiple indicators and advanced logic to provide real-time insights into market trends, helping traders make more informed decisions.
Key Features
1. Multi-Timeframe Bias Calculation:
The ENIGMA Indicator tracks the market bias across multiple timeframes—Daily (D), 4-Hour (H4), 1-Hour (H1), 30-Minute (30M), 15-Minute (15M), 5-Minute (5M), and 1-Minute (1M).
How the Bias is Created:
The Bias is a key feature of the ENIGMA Indicator and is determined by comparing the current price with previous price levels for each timeframe.
- Bullish Bias (1): The market is considered **bullish** if the **current closing price** is higher than the **previous timeframe’s high**. This suggests that the market is trending upwards, and buyers are in control.
- Bearish Bias (-1): The market is considered **bearish** if the **current closing price** is lower than the **previous timeframe’s low**. This suggests that the market is trending downwards, and sellers are in control.
- Neutral Bias (0): The market is considered **neutral** if the price is between the **previous high** and **previous low**, indicating indecision or a range-bound market.
This bias calculation is performed independently for each timeframe. The **Bias** for each timeframe is then displayed in the **Bias Table** on your chart, providing a clear view of market direction across multiple timeframes.
2. **Customizable Table Display:**
- The indicator provides a table that displays the bias for each selected timeframe, clearly marking whether the market is **Bullish**, **Bearish**, or **Neutral**.
- Users can choose where to place the table on the chart: top-left, top-right, bottom-left, bottom-right, or center positions, allowing for easy and personalized chart management.
3. **Win/Loss Tracker:**
- The table also tracks the **success rate** of **buy** and **sell** trades based on price retests of key bias levels.
- For each period (Day, Week, Month), it tracks how often the price has moved in the direction of the initial bias, counting **Buy Wins**, **Sell Wins**, **Buy Losses**, and **Sell Losses**.
- This helps traders assess the effectiveness of the market bias over time and adjust their strategies accordingly.
#### **How the Success Calculation Determines the Success Rate:**
The **Success Calculation** is designed to track how often the price follows the direction of the market bias. It does this by evaluating how the price retests key levels associated with the identified market bias:
1. **Buy Success Calculation**:
- The success of a **Buy Trade** is determined when the price breaks above the **previous high** after a **bullish bias** has been identified.
- If the price continues to move higher (i.e., makes a new high) after breaking the previous high, the **buy trade is considered successful**.
- The indicator tracks how many times this condition is met and counts it as a **Buy Win**.
2. **Sell Success Calculation**:
- The success of a **Sell Trade** is determined when the price breaks below the **previous low** after a **bearish bias** has been identified.
- If the price continues to move lower (i.e., makes a new low) after breaking the previous low, the **sell trade is considered successful**.
- The indicator tracks how many times this condition is met and counts it as a **Sell Win**.
3. **Failure Calculations**:
- If the price does not move as expected (i.e., it does not continue in the direction of the identified bias), the trade is considered a **loss** and is tracked as **Buy Loss** or **Sell Loss**, depending on whether it was a bullish or bearish trade.
The ENIGMA Indicator keeps a running tally of **Buy Wins**, **Sell Wins**, **Buy Losses**, and **Sell Losses** over a set period (which can be customized to Days, Weeks, or Months). These statistics are updated dynamically in the **Bias Table**, allowing you to track your success rate in real-time and gain insights into the effectiveness of the market bias.
#### **Customizable Period Tracking:**
- The ENIGMA Indicator allows you to set custom tracking periods (e.g., 30 days, 2 weeks, etc.). The performance metrics reset after each tracking period, helping you monitor your success in different market conditions.
5. **Interactive Settings:**
- **Lookback Period**: Define how many bars the indicator should consider for bias calculations.
- **Success Tracking**: Set the number of candles to track for calculating the win/loss performance.
- **Time Threshold**: Set a time threshold to help define the period during which price retests are considered valid.
- **Info Tooltip**: You can enable the information tool in the settings to view detailed explanations of how wins and losses are calculated, ensuring you understand how the indicator works and how the results are derived.
#### **How to Use the ENIGMA Indicator:**
1. **Install the Indicator**:
- Add the ENIGMA Indicator to your chart. It will automatically calculate and display the bias for multiple timeframes.
2. **Interpret the Bias Table**:
- The bias table will show whether the market is **Bullish**, **Bearish**, or **Neutral** across different timeframes.
- Look for alignment between the timeframes—when multiple timeframes show the same bias, it may indicate a stronger trend.
3. **Use the Win/Loss Tracker**:
- Track how well your trades align with the bias using the **Win/Loss Tracker**. This helps you refine your strategy by understanding which timeframes and biases lead to higher success rates.
- For example, if you see a high number of **Buy Wins** and a low number of **Sell Wins**, you may decide to focus more on buying during bullish trends and avoid selling during bearish retracements.
4. **Track Your Period Performance**:
- The indicator will automatically track your performance over the set period (Days, Weeks, Months). Use this data to adjust your approach and evaluate the effectiveness of your trading strategy.
5. **Position the Table**:
- Customize the placement of the table on your chart based on your preferences. You can choose from options like **Top Left**, **Top Right**, **Bottom Left**, **Bottom Right**, or **Center** to keep the chart uncluttered.
6. **Adjust Settings**:
- Modify the indicator settings according to your trading style. You can adjust the **Lookback Period**, **Number of Candles to Track**, and **Time Threshold** to match the pace of your trading.
7. **Use the Info Tooltip**:
- Enable the **Info Tool** in the settings to understand how the Buy/Sell Wins and Losses are calculated. The tooltip provides a breakdown of how the indicator tracks price movements and calculates the success rate.
**Conclusion:**
The **ENIGMA Indicator** is designed to help traders make informed decisions by providing a clear view of the market bias and performance data. With the ability to track bias across multiple timeframes and evaluate your trading success, it can be a powerful tool for refining your trading strategies.
Whether you're looking to focus on a single timeframe or analyze multiple timeframes for a stronger bias, the ENIGMA Indicator adapts to your needs, providing both real-time market insights and performance feedback.
Major Crypto Relative Strength Portfolio System Majors RSPS - Relative Strength Portfolio System for Major Cryptocurrencies
Overview
Majors RSPS (Relative Strength Portfolio System) is an advanced portfolio allocation indicator that combines relative strength analysis, trend consensus, and macro risk factors to dynamically allocate capital across major cryptocurrency assets. The system leverages the NormalizedIndicators Library to evaluate both absolute trends and relative performance, creating an adaptive portfolio that automatically adjusts exposure based on market conditions.
This indicator is designed for portfolio managers, asset allocators, and systematic traders who want a data-driven approach to cryptocurrency portfolio construction with automatic rebalancing signals.
🎯 Core Concept
What is RSPS?
RSPS (Relative Strength Portfolio System) evaluates each asset on two key dimensions:
Relative Strength: How is the asset performing compared to other major cryptocurrencies?
Absolute Trend: Is the asset itself in a bullish trend?
Assets that show both strong relative performance AND positive absolute trends receive higher allocations. Weak performers are automatically filtered out, with capital reallocated to cash or stronger assets.
Dual-Layer Architecture
Layer 1: Majors Portfolio (Orange Zone)
Evaluates 14 major cryptocurrency assets
Calculates relative strength against all other majors
Applies trend filters to ensure absolute momentum
Dynamically allocates capital based on comparative strength
Layer 2: Cash/Risk Position (Navy Zone)
Evaluates macro risk factors and market conditions
Determines optimal cash allocation
Acts as a risk-off mechanism during adverse conditions
Provides downside protection through dynamic cash holdings
📊 Tracked Assets
Major Cryptocurrencies (14 Assets)
BTC - Bitcoin (Benchmark L1)
ETH - Ethereum (Smart Contract L1)
SOL - Solana (High-Performance L1)
SUI - Sui (Move-Based L1)
TRX - Tron (Payment-Focused L1)
BNB - Binance Coin (Exchange L1)
XRP - Ripple (Payment Network)
FTM - Fantom (DeFi L1)
CELO - Celo (Mobile-First L1)
TAO - Bittensor (AI Network)
HYPE - Hyperliquid (DeFi Exchange)
HBAR - Hedera (Enterprise L1)
ADA - Cardano (Research-Driven L1)
THETA - Theta (Video Network)
🔧 How It Works
Step 1: Relative Strength Calculation
For each asset, the system calculates relative strength by:
RSPS Score = Average of:
- Asset/BTC trend consensus
- Asset/ETH trend consensus
- Asset/SOL trend consensus
- Asset/SUI trend consensus
- ... (all 14 pairs)
- Asset's absolute trend consensus
Key Logic:
Each pair is evaluated using the eth_4d_cal() calibration from NormalizedIndicators
If an asset's absolute trend is extremely weak (≤ 0.1), it receives a penalty score (-0.5)
Otherwise, it gets the average of all its relative strength comparisons
Step 2: Trend Filtering
Assets must pass a trend filter to receive allocation:
Trend Score = Average of:
- Asset/BTC trend (filtered for positivity)
- Asset/ETH trend (filtered for positivity)
- Asset's absolute trend (filtered for positivity)
Only positive values contribute to the trend score, ensuring bearish assets don't receive allocation.
Step 3: Portfolio Allocation
Capital is allocated proportionally based on filtered RSPS scores:
Asset Allocation % = (Asset's Filtered RSPS Score / Sum of All Filtered Scores) × Main Portfolio %
Example:
SOL filtered score: 0.6
BTC filtered score: 0.4
All others: 0
Total: 1.0
SOL receives: (0.6 / 1.0) × Main% = 60% of main portfolio
BTC receives: (0.4 / 1.0) × Main% = 40% of main portfolio
Step 4: Cash/Risk Allocation
The system evaluates macro conditions across 6 factors:
Inverse Major Crypto Trends (40% weight)
When BTC, ETH, SOL, SUI, DOGE, etc. trend down → Cash allocation increases
Evaluates total market cap trends (TOTAL, TOTAL2, OTHERS)
Stablecoin Dominance (10% weight)
USDC dominance vs. major crypto dominances
Higher stablecoin dominance → Higher cash allocation
MVRV Ratios (10% weight)
BTC and ETH Market Value to Realized Value
High MVRV (overvaluation) → Higher cash allocation
BTC/ETH Ratio (15% weight)
Relative performance between two market leaders
Indicates market phase (BTC dominance vs. alt season)
Active Address Ratios (5% weight)
USDC active addresses vs. BTC/ETH active addresses
Network activity comparison
Macro Indicators (15% weight)
Global currency circulation (USD, EUR, CNY, JPY)
Treasury yield curve (10Y-2Y)
High yield spreads
Central bank balance sheets and money supply
Cash Allocation Formula:
Cash % = (Sum of Risk Factors × 0.5) / (Risk Factors + Majors TPI)
When risk factors are elevated, cash allocation increases, reducing exposure to volatile assets.
📈 Visual Components
Orange Zone (Majors Portfolio)
Fill: Light orange area showing aggregate portfolio strength
Line: Average trend power index (TPI) of allocated assets
Baseline: 0 level (neutral)
Interpretation:
Above 0: Bullish allocation environment
Rising: Strengthening portfolio momentum
Falling: Weakening portfolio momentum
Below 0: No allocation (100% cash)
Navy Zone (Cash Position)
Fill: Navy blue area showing cash allocation strength
Line: Risk-adjusted cash allocation signal
Baseline: 0 level
Interpretation:
Higher navy zone: Elevated risk-off signal → More cash
Lower navy zone: Risk-on environment → Less cash
Zero: No cash allocation (100% invested)
Performance Line (Orange/Blue)
Orange: Main portfolio allocation dominant (risk-on mode)
Blue: Cash allocation dominant (risk-off mode)
Tracks: Cumulative portfolio returns with dynamic rebalancing
Allocation Table (Bottom Left)
Shows real-time portfolio composition:
ColumnDescriptionAssetCryptocurrency nameRSPS ValuePercentage allocation (of main portfolio)CashDollar amount (if enabled)
Color Coding:
Orange: Active allocation
Gray: Weak signal (borderline)
Blue: Cash position
Missing: No allocation (filtered out)
⚙️ Settings & Configuration
Required Setup
Chart Symbol
MUST USE: INDEX:BTCUSD or similar major crypto index
Recommended Timeframe: 1D (Daily) or 4D (4-Day)
Why: System needs price data for all 14 majors, BTC provides stable reference
Hide Chart Candles
For clean visualization:
Right-click on chart
Select "Hide Symbol" or set candle opacity to 0
This allows the indicator fills and table to be clearly visible
User Inputs
plot_table (Default: true)
Enable/disable the allocation table
Set to false if you only want the visual zones
use_cash (Default: false)
Enable portfolio dollar value calculations
Shows actual dollar allocations per asset
cash (Default: 100)
Total portfolio size in dollars/currency units
Used when use_cash is enabled
Example: Set to 10000 for a $10,000 portfolio
💡 Interpretation Guide
Entry Signals
Strong Allocation Signal:
✓ Orange zone elevated (> 0.3)
✓ Navy zone low (< 0.2)
✓ Performance line orange
✓ Multiple assets in allocation table
→ Action: Deploy capital to allocated assets per table percentages
Risk-Off Signal:
✓ Orange zone near zero
✓ Navy zone elevated (> 0.4)
✓ Performance line blue
✓ Few or no assets in table (high cash %)
→ Action: Reduce exposure, increase cash holdings
Rebalancing Triggers
Monitor the allocation table for changes:
New assets appearing: Add to portfolio
Assets disappearing: Remove from portfolio
Percentage changes: Rebalance existing positions
Cash % changes: Adjust overall exposure
Market Regime Detection
Risk-On (Bull Market):
Orange zone high and rising
Navy zone minimal
Many assets allocated (8-12)
High individual allocations (15-30% each)
Risk-Off (Bear Market):
Orange zone near zero or negative
Navy zone elevated
Few assets allocated (0-3)
Cash allocation dominant (70-100%)
Transition Phase:
Both zones moderate
Medium number of assets (4-7)
Balanced cash/asset allocation (40-60%)
🎯 Trading Strategies
Strategy 1: Pure RSPS Following
1. Check allocation table daily
2. Rebalance portfolio to match percentages
3. Follow cash allocation strictly
4. Review weekly, act on significant changes (>5%)
Best For: Systematic portfolio managers, passive allocators
Strategy 2: Threshold-Based
Entry Rules:
- Orange zone > 0.4 AND Navy zone < 0.3
- At least 5 assets in allocation table
- Total non-cash allocation > 60%
Exit Rules:
- Orange zone < 0.1 OR Navy zone > 0.5
- Fewer than 3 assets allocated
- Cash allocation > 70%
Best For: Active traders wanting clear rules
Strategy 3: Relative Strength Overlay
1. Use RSPS for broad allocation framework
2. Within allocated assets, overweight top 3 performers
3. Scale position sizes by RSPS score
4. Use individual asset charts for entry/exit timing
Best For: Discretionary traders with portfolio focus
Strategy 4: Risk-Adjusted Position Sizing
For each allocated asset:
Position Size = Base Position × (Asset's RSPS Score / Max RSPS Score) × (1 - Cash Allocation)
Example:
- $10,000 portfolio
- SOL RSPS: 0.6 (highest)
- BTC RSPS: 0.4
- Cash allocation: 30%
SOL Size = $10,000 × (0.6/0.6) × (1-0.30) = $7,000
BTC Size = $10,000 × (0.4/0.6) × (1-0.30) = $4,667
Cash = $10,000 × 0.30 = $3,000
Best For: Risk-conscious allocators
📊 Advanced Usage
Multi-Timeframe Confirmation
Use on multiple timeframes for robust signals:
1D Chart: Tactical allocation (daily rebalancing)
4D Chart: Strategic allocation (weekly review)
Strong Confirmation:
- Both timeframes show same top 3 assets
- Both show similar cash allocation levels
- Orange zones aligned on both
Weak/Conflicting:
- Different top performers
- Diverging cash allocations
→ Wait for alignment or use shorter timeframe
Sector Rotation Analysis
Group assets by type and watch rotation:
L1 Dominance: BTC, ETH, SOL, SUI, ADA high → Layer 1 season
Alt L1s: TRX, FTM, CELO rising → Alternative platform season
Specialized: TAO, THETA, HYPE strong → Niche narrative season
Payment/Stable: XRP, BNB allocation → Risk reduction phase
Divergence Trading
Bullish Divergence:
Navy zone declining (less risk-off)
Orange zone flat or slightly rising
Few assets still allocated but strengthening
→ Early accumulation signal
Bearish Divergence:
Orange zone declining
Navy zone rising
Asset count decreasing in table
→ Distribution/exit signal
Performance Tracking
The performance line (overlay) shows cumulative strategy returns:
Compare to BTC/ETH: Is RSPS outperforming?
Drawdown analysis: How deep are pullbacks?
Correlation: Does it track market or provide diversification?
🔬 Technical Details
Data Sources
Price Data:
COINEX: Primary exchange for alt data
CRYPTO: Alternative price feeds
INDEX: Aggregated index prices (recommended for BTC)
Macro Data:
Dominance metrics (SUI.D, BTC.D, etc.)
MVRV ratios (on-chain valuation)
Active addresses (network activity)
Global money supply and macro indicators
Calculation Methodology
RSPS Scoring:
For each asset, calculate 14 relative trends (vs. all others)
Calculate asset's absolute trend
Average all 15 values
Apply penalty filter for extremely weak trends (≤ 0.1)
Trend Consensus:
Uses eth_4d_cal() from NormalizedIndicators library
Combines 8 normalized indicators per measurement
Returns value from -1 (bearish) to +1 (bullish)
Performance Calculation:
Daily Return = Σ(Asset ROC × Asset Allocation)
Cumulative Performance = Previous Perf × (1 + Daily Return / 100)
Assumes perfect rebalancing and no slippage (theoretical performance).
Filtering Logic
filter() function:
pinescriptfilter(input) => input >= 0 ? input : 0
This zero-floor filter ensures:
Only positive trend values contribute to allocation
Bearish assets receive 0 weight
No short positions or inverse allocations
Anti-Manipulation Safeguards
Null Handling:
All values wrapped in nz() to handle missing data
Prevents calculation errors from data gaps
Normalization:
Allocations always sum to 100%
Prevents over/under-allocation
Conditional Logic:
Assets need positive values on multiple metrics
Single metric cannot drive allocation alone
⚠️ Important Considerations
Required Timeframes
1D (Daily): Recommended for most users
4D (4-Day): More stable, fewer rebalances
Other timeframes: Use at your own discretion, may require recalibration
Data Requirements
Needs INDEX:BTCUSD or equivalent major crypto symbol
All 14 tracked assets must have available data
Macro indicators require specific TradingView data feeds
Rebalancing Frequency
System provides daily allocation updates
Practical rebalancing: Weekly or on significant changes (>10%)
Consider transaction costs and tax implications
Performance Notes
Theoretical returns: No slippage, fees, or execution delays
Backtest carefully: Validate on your specific market conditions
Past performance: Does not guarantee future results
Risk Warnings
⚠️ High Concentration Risk: May allocate heavily to 1-3 assets
⚠️ Volatility: Crypto markets are inherently volatile
⚠️ Liquidity: Some allocated assets may have lower liquidity
⚠️ Correlation: All assets correlated to BTC/ETH to some degree
⚠️ System Risk: Relies on continued availability of data feeds
Not Financial Advice
This indicator is a tool for analysis and research. It does not constitute:
Investment advice
Portfolio management services
Trading recommendations
Guaranteed returns
Always perform your own due diligence and risk assessment.
🎓 Use Cases
For Portfolio Managers
Systematic allocation framework
Objective rebalancing signals
Risk-adjusted exposure management
Performance tracking vs. benchmarks
For Active Traders
Identify strongest assets to focus trading on
Gauge overall market regime (risk-on/off)
Time entry/exit for portfolio shifts
Complement technical analysis with allocation data
For Institutional Allocators
Quantitative portfolio construction
Multi-asset exposure optimization
Drawdown management through cash allocation
Compliance-friendly systematic approach
For Researchers
Study relative strength dynamics in crypto markets
Analyze correlation between majors
Test macro factor impact on crypto allocations
Develop derived strategies and signals
🔧 Setup Checklist
✅ Chart Configuration
Set chart to INDEX:BTCUSD
Set timeframe to 1D or 4D
Hide chart candles for clean visualization
Add indicator from library
✅ Indicator Settings
Enable plot_table (see allocation table)
Set use_cash if tracking dollar amounts
Input your portfolio size in cash parameter
✅ Monitoring Setup
Bookmark chart for daily review
Set alerts for major allocation changes (optional)
Create spreadsheet to track allocations (optional)
Establish rebalancing schedule (weekly recommended)
✅ Validation
Verify all 14 assets appear in table (when allocated)
Check that percentages sum to ~100%
Confirm performance line is tracking
Test cash allocation calculation if enabled
📋 Quick Reference
Signal Interpretation
ConditionOrange ZoneNavy ZoneActionStrong BullHigh (>0.4)Low (<0.2)Full allocationModerate BullMid (0.2-0.4)Low-MidStandard allocationNeutralLow (0.1-0.2)Mid (0.3-0.4)Balanced allocationModerate BearVery Low (<0.1)Mid-HighReduce exposureStrong BearZero/NegativeHigh (>0.5)High cash/exit
Rebalancing Thresholds
Change TypeThresholdActionIndividual asset±5%Consider rebalanceIndividual asset±10%Strongly rebalanceCash allocation±10%Adjust exposureAsset entry/exitAnyAdd/remove position
Color Legend
Orange: Main portfolio strength/allocation
Navy: Cash/risk-off allocation
Blue text: Cash position in table
Orange text: Active asset allocation
Gray text: Weak/borderline allocation
White: Headers and labels
🚀 Getting Started
Beginner Path
Add indicator to INDEX:BTCUSD daily chart
Hide candles for clarity
Enable plot_table to see allocations
Check table daily, note top 3-5 assets
Start with small allocation, observe behavior
Gradually increase allocation as you gain confidence
Intermediate Path
Set up on both 1D and 4D charts
Enable use_cash with your portfolio size
Create tracking spreadsheet
Implement weekly rebalancing schedule
Monitor divergences between timeframes
Compare performance to buy-and-hold BTC
Advanced Path
Modify code to add/remove tracked assets
Adjust relative strength calculation methodology
Customize cash allocation factors and weights
Integrate with portfolio management platform
Develop algorithmic rebalancing system
Create alerts for specific allocation conditions
📖 Additional Resources
Related Indicators
NormalizedIndicators Library: Core calculation engine
Individual asset trend indicators for deeper analysis
Macro indicator dashboards for cash allocation factors
Complementary Analysis
On-chain metrics (MVRV, active addresses, etc.)
Order book liquidity for execution planning
Correlation matrices for diversification analysis
Volatility indicators for position sizing
Learning Materials
Study relative strength portfolio theory
Research tactical asset allocation strategies
Understand crypto market cycles and phases
Learn about risk management in volatile assets
🎯 Key Takeaways
✅ Systematic allocation across 14 major cryptocurrencies
✅ Dual-layer approach: Asset selection + Cash management
✅ Relative strength focused: Invests in comparatively strong assets
✅ Trend filtering: Only allocates to assets in positive trends
✅ Dynamic rebalancing: Automatically adjusts to market conditions
✅ Risk-managed: Increases cash during adverse conditions
✅ Transparent methodology: Clear calculation logic
✅ Practical visualization: Easy-to-read table and zones
✅ Performance tracking: See cumulative strategy returns
✅ Highly customizable: Adjust assets, weights, and factors
📋 License
This code is subject to the Mozilla Public License 2.0 at mozilla.org
Majors RSPS transforms complex multi-asset portfolio management into a systematic, data-driven process. By combining relative strength analysis with trend consensus and macro risk factors, it provides traders and portfolio managers with a robust framework for navigating cryptocurrency markets with discipline and objectivity.WiederholenClaude kann Fehler machen. Bitte überprüfen Sie die Antworten. Sonnet 4.5

Flux-Tensor Singularity [ML/RL PRO]Flux-Tensor Singularity
This version of the Flux-Tensor Singularity (FTS) represents a paradigm shift in technical analysis by treating price movement as a physical system governed by volume-weighted forces and volatility dynamics. Unlike traditional indicators that measure price change or momentum in isolation, FTS quantifies the complete energetic state of the market by fusing three fundamental dimensions: price displacement (delta_P), volume intensity (V), and local-to-global volatility ratio (gamma).
The Physics-Inspired Foundation:
The tensor calculation draws inspiration from general relativity and fluid dynamics, where massive objects (large volume) create curvature in spacetime (price action). The core formula:
Raw Singularity = (ΔPrice × ln(Volume)) × γ²
Where:
• ΔPrice = close - close (directional force)
• ln(Volume) = logarithmic volume compression (prevents extreme outliers)
• γ (Gamma) = (ATR_local / ATR_global)² (volatility expansion coefficient)
This raw value is then normalized to 0-100 range using the lookback period's extremes, creating a bounded oscillator that identifies critical density points—"singularities" where normal market behavior breaks down and explosive moves become probable.
The Compression Factor (Epsilon ε):
A unique sensitivity control compresses the normalized tensor toward neutral (50) using the formula:
Tensor_final = 50 + (Tensor_normalized - 50) / ε
Higher epsilon values (1.5-3.0) make threshold breaches rare and significant, while lower values (0.3-0.7) increase signal frequency. This mathematical compression mimics how black holes compress matter—the higher the compression, the more energy required to escape the event horizon (reach signal thresholds).
Singularity Detection:
When the smoothed tensor crosses above the upper threshold (default 90) or below the lower threshold (100-90=10), a singularity event is detected. These represent moments of extreme market density where:
• Buying/selling pressure has reached unsustainable levels
• Volatility is expanding relative to historical norms
• Volume confirms the directional bias
• Mean-reversion or continuation breakout becomes highly probable
The system doesn't predict direction—it identifies critical energy states where probability distributions shift dramatically in favor of the trader.
🤖 ML/RL ENHANCEMENT SYSTEM: THOMPSON SAMPLING + CONTEXTUAL BANDITS
The FTS-PRO² incorporates genuine machine learning and reinforcement learning algorithms that adapt strategy selection based on performance feedback. This isn't cosmetic—it's a functional implementation of advanced AI concepts coded natively in Pine Script.
Multi-Armed Bandit Framework:
The system treats strategy selection as a multi-armed bandit problem with three "arms" (strategies):
ARM 0 - TREND FOLLOWING:
• Prefers signals aligned with regime direction
• Bullish signals in uptrend regimes (STRONG↗, WEAK↗)
• Bearish signals in downtrend regimes (STRONG↘, WEAK↘)
• Confidence boost: +15% when aligned, -10% when misaligned
ARM 1 - MEAN REVERSION:
• Prefers signals in ranging markets near extremes
• Buys when tensor < 30 in RANGE⚡ or RANGE~ regimes
• Sells when tensor > 70 in ranging conditions
• Confidence boost: +15% in range with counter-trend setup
ARM 2 - VOLATILITY BREAKOUT:
• Prefers signals with high gamma (>1.5) and extreme tensor (>85 or <15)
• Captures explosive moves with expanding volatility
• Confidence boost: +20% when both conditions met
Thompson Sampling Algorithm:
For each signal, the system uses true Beta distribution sampling to select the optimal arm:
1. Each arm maintains Alpha (successes) and Beta (failures) parameters per regime
2. Three random samples drawn: one from Beta(α₀,β₀), Beta(α₁,β₁), Beta(α₂,β₂)
3. Highest sample wins and that arm's strategy applies
4. After trade outcome:
- Win → Alpha += 1.0, reward += 1.0
- Loss → Beta += 1.0, reward -= 0.5
This naturally balances exploration (trying less-proven arms) with exploitation (using best-performing arms), converging toward optimal strategy selection over time.
Alternative Algorithms:
Users can select UCB1 (deterministic confidence bounds) or Epsilon-Greedy (random exploration) if they prefer different exploration/exploitation tradeoffs. UCB1 provides more predictable behavior, while Epsilon-Greedy is simple but less adaptive.
Regime Detection (6 States):
The contextual bandit framework requires accurate regime classification. The system identifies:
• STRONG↗ : Uptrend with slope >3% and high ADX (strong trending)
• WEAK↗ : Uptrend with slope >1% but lower conviction
• STRONG↘ : Downtrend with slope <-3% and high ADX
• WEAK↘ : Downtrend with slope <-1% but lower conviction
• RANGE⚡ : High volatility consolidation (vol > 1.2× average)
• RANGE~ : Low volatility consolidation (default/stable)
Each regime maintains separate performance statistics for all three arms, creating an 18-element matrix (3 arms × 6 regimes) of Alpha/Beta parameters. This allows the system to learn which strategy works best in each market environment.
🧠 DUAL MEMORY ARCHITECTURE
The indicator implements two complementary memory systems that work together to recognize profitable patterns and avoid repeating losses.
Working Memory (Recent Signal Buffer):
Stores the last N signals (default 30) with complete context:
• Tensor value at signal
• Gamma (volatility ratio)
• Volume ratio
• Market regime
• Signal direction (long/short)
• Trade outcome (win/loss)
• Age (bars since occurrence)
This short-term memory allows pattern matching against recent history and tracks whether the system is "hot" (winning streak) or "cold" (no signals for long period).
Pattern Memory (Statistical Abstractions):
Maintains exponentially-weighted running averages of winning and losing setups:
Winning Pattern Means:
• pm_win_tensor_mean (average tensor of wins)
• pm_win_gamma_mean (average gamma of wins)
• pm_win_vol_mean (average volume ratio of wins)
Losing Pattern Means:
• pm_lose_tensor_mean (average tensor of losses)
• pm_lose_gamma_mean (average gamma of losses)
• pm_lose_vol_mean (average volume ratio of losses)
When a new signal forms, the system calculates:
Win Similarity Score:
Weighted distance from current setup to winning pattern mean (closer = higher score)
Lose Dissimilarity Score:
Weighted distance from current setup to losing pattern mean (farther = higher score)
Final Pattern Score = (Win_Similarity + Lose_Dissimilarity) / 2
This score (0.0 to 1.0) feeds into ML confidence calculation with 15% weight. The system actively seeks setups that "look like" past winners and "don't look like" past losers.
Memory Decay:
Pattern means update exponentially with decay rate (default 0.95):
New_Mean = Old_Mean × 0.95 + New_Value × 0.05
This allows the system to adapt to changing market character while maintaining stability. Faster decay (0.80-0.90) adapts quickly but may overfit to recent noise. Slower decay (0.95-0.99) provides stability but adapts slowly to regime changes.
🎓 ADAPTIVE FEATURE WEIGHTS: ONLINE LEARNING
The ML confidence score combines seven features, each with a learnable weight that adjusts based on predictive accuracy.
The Seven Features:
1. Overall Win Rate (15% initial) : System-wide historical performance
2. Regime Win Rate (20% initial) : Performance in current market regime
3. Score Strength (15% initial) : Bull vs bear score differential
4. Volume Strength (15% initial) : Volume ratio normalized to 0-1
5. Pattern Memory (15% initial) : Similarity to winning patterns
6. MTF Confluence (10% initial) : Higher timeframe alignment
7. Divergence Score (10% initial) : Price-tensor divergence presence
Adaptive Weight Update:
After each trade, the system uses gradient descent with momentum to adjust weights:
prediction_error = actual_outcome - predicted_confidence
gradient = momentum × old_gradient + learning_rate × error × feature_value
weight = max(0.05, weight + gradient × 0.01)
Then weights are normalized to sum to 1.0.
Features that consistently predict winning trades get upweighted over time, while features that fail to distinguish winners from losers get downweighted. The momentum term (default 0.9) smooths the gradient to prevent oscillation and overfitting.
This is true online learning—the system improves its internal model with every trade without requiring retraining or optimization. Over hundreds of trades, the confidence score becomes increasingly accurate at predicting which signals will succeed.
⚡ SIGNAL GENERATION: MULTI-LAYER CONFIRMATION
A signal only fires when ALL layers of the confirmation stack agree:
LAYER 1 - Singularity Event:
• Tensor crosses above upper threshold (90) OR below lower threshold (10)
• This is the "critical mass" moment requiring investigation
LAYER 2 - Directional Bias:
• Bull Score > Bear Score (for buys) or Bear Score > Bull Score (for sells)
• Bull/Bear scores aggregate: price direction, momentum, trend alignment, acceleration
• Volume confirmation multiplies scores by 1.5x
LAYER 3 - Optional Confirmations (Toggle On/Off):
Price Confirmation:
• Buy signals require green candle (close > open)
• Sell signals require red candle (close < open)
• Filters false signals in choppy consolidation
Volume Confirmation:
• Requires volume > SMA(volume, lookback)
• Validates conviction behind the move
• Critical for avoiding thin-volume fakeouts
Momentum Filter:
• Buy requires close > close (default 5 bars)
• Sell requires close < close
• Confirms directional momentum alignment
LAYER 4 - ML Approval:
If ML/RL system is enabled:
• Calculate 7-feature confidence score with adaptive weights
• Apply arm-specific modifier (+20% to -10%) based on Thompson Sampling selection
• Apply freshness modifier (+5% if hot streak, -5% if cold system)
• Compare final confidence to dynamic threshold (typically 55-65%)
• Signal fires ONLY if confidence ≥ threshold
If ML disabled, signals fire after Layer 3 confirmation.
Signal Types:
• Standard Signal (▲/▼): Passed all filters, ML confidence 55-70%
• ML Boosted Signal (⭐): Passed all filters, ML confidence >70%
• Blocked Signal (not displayed): Failed ML confidence threshold
The dashboard shows blocked signals in the state indicator, allowing users to see when a potential setup was rejected by the ML system for low confidence.
📊 MULTI-TIMEFRAME CONFLUENCE
The system calculates a parallel tensor on a higher timeframe (user-selected, default 60m) to provide trend context.
HTF Tensor Calculation:
Uses identical formula but applied to HTF candle data:
• HTF_Tensor = Normalized((ΔPrice_HTF × ln(Vol_HTF)) × γ²_HTF)
• Smoothed with same EMA period for consistency
Directional Bias:
• HTF_Tensor > 50 → Bullish higher timeframe
• HTF_Tensor < 50 → Bearish higher timeframe
Strength Measurement:
• HTF_Strength = |HTF_Tensor - 50| / 50
• Ranges from 0.0 (neutral) to 1.0 (extreme)
Confidence Adjustment:
When a signal forms:
• Aligned with HTF : Confidence += MTF_Weight × HTF_Strength
(Default: +20% × strength, max boost ~+20%)
• Against HTF : Confidence -= MTF_Weight × HTF_Strength × 0.6
(Default: -20% × strength × 0.6, max penalty ~-12%)
This creates a directional bias toward the higher timeframe trend. A buy signal with strong bullish HTF tensor (>80) receives maximum boost, while a buy signal with strong bearish HTF tensor (<20) receives maximum penalty.
Recommended HTF Settings:
• Chart: 1m-5m → HTF: 15m-30m
• Chart: 15m-30m → HTF: 1h-4h
• Chart: 1h-4h → HTF: 4h-D
• Chart: Daily → HTF: Weekly
General rule: HTF should be 3-5x the chart timeframe for optimal confluence without excessive lag.
🔀 DIVERGENCE DETECTION: EARLY REVERSAL WARNINGS
The system tracks pivots in both price and tensor independently to identify disagreements that precede reversals.
Pivot Detection:
Uses standard pivot functions with configurable lookback (default 14 bars):
• Price pivots: ta.pivothigh(high) and ta.pivotlow(low)
• Tensor pivots: ta.pivothigh(tensor) and ta.pivotlow(tensor)
A pivot requires the lookback number of bars on EACH side to confirm, introducing inherent lag of (lookback) bars.
Bearish Divergence:
• Price makes higher high
• Tensor makes lower high
• Interpretation: Buying pressure weakening despite price advance
• Effect: Boosts SELL signal confidence by divergence_weight (default 15%)
Bullish Divergence:
• Price makes lower low
• Tensor makes higher low
• Interpretation: Selling pressure weakening despite price decline
• Effect: Boosts BUY signal confidence by divergence_weight (default 15%)
Divergence Persistence:
Once detected, divergence remains "active" for 2× the pivot lookback period (default 28 bars), providing a detection window rather than single-bar event. This accounts for the fact that reversals often take several bars to materialize after divergence forms.
Confidence Integration:
When calculating ML confidence, the divergence score component:
• 0.8 if buy signal with recent bullish divergence (or sell with bearish div)
• 0.2 if buy signal with recent bearish divergence (opposing signal)
• 0.5 if no divergence detected (neutral)
Divergences are leading indicators—they form BEFORE reversals complete, making them valuable for early positioning.
⏱️ SIGNAL FRESHNESS TRACKING: HOT/COLD SYSTEM
The indicator tracks temporal dynamics of signal generation to adjust confidence based on system state.
Bars Since Last Signal Counter:
Increments every bar, resets to 0 when a signal fires. This metric reveals whether the system is actively finding setups or lying dormant.
Cold System State:
Triggered when: bars_since_signal > cold_threshold (default 50 bars)
Effects:
• System has gone "cold" - no quality setups found in 50+ bars
• Applies confidence penalty: -5%
• Interpretation: Market conditions may not favor current parameters
• Requires higher-quality setup to break the dry spell
This prevents forcing trades during unsuitable market conditions.
Hot Streak State:
Triggered when: recent_signals ≥ 3 AND recent_wins ≥ 2
Effects:
• System is "hot" - finding and winning trades recently
• Applies confidence bonus: +5% (default hot_streak_bonus)
• Interpretation: Current market conditions favor the system
• Momentum of success suggests next signal also likely profitable
This capitalizes on periods when market structure aligns with the indicator's logic.
Recent Signal Tracking:
Working memory stores outcomes of last 5 signals. When 3+ winners occur in this window, hot streak activates. After 5 signals, the counter resets and tracking restarts. This creates rolling evaluation of recent performance.
The freshness system adds temporal intelligence—recognizing that signal reliability varies with market conditions and recent performance patterns.
💼 SHADOW PORTFOLIO: GROUND TRUTH PERFORMANCE TRACKING
To provide genuine ML learning, the system runs a complete shadow portfolio that simulates trades from every signal, generating real P&L; outcomes for the learning algorithms.
Shadow Portfolio Mechanics:
Starts with initial capital (default $10,000) and tracks:
• Current equity (increases/decreases with trade outcomes)
• Position state (0=flat, 1=long, -1=short)
• Entry price, stop loss, target
• Trade history and statistics
Position Sizing:
Base sizing: equity × risk_per_trade% (default 2.0%)
With dynamic sizing enabled:
• Size multiplier = 0.5 + ML_confidence
• High confidence (0.80) → 1.3× base size
• Low confidence (0.55) → 1.05× base size
Example: $10,000 equity, 2% risk, 80% confidence:
• Impact: $10,000 × 2% × 1.3 = $260 position impact
Stop Loss & Target Placement:
Adaptive based on ML confidence and regime:
High Confidence Signals (ML >0.7):
• Tighter stops: 1.5× ATR
• Larger targets: 4.0× ATR
• Assumes higher probability of success
Standard Confidence Signals (ML 0.55-0.7):
• Standard stops: 2.0× ATR
• Standard targets: 3.0× ATR
Ranging Regimes (RANGE⚡/RANGE~):
• Tighter setup: 1.5× ATR stop, 2.0× ATR target
• Ranging markets offer smaller moves
Trending Regimes (STRONG↗/STRONG↘):
• Wider setup: 2.5× ATR stop, 5.0× ATR target
• Trending markets offer larger moves
Trade Execution:
Entry: At close price when signal fires
Exit: First to hit either stop loss OR target
On exit:
• Calculate P&L; percentage
• Update shadow equity
• Increment total trades counter
• Update winning trades counter if profitable
• Update Thompson Sampling Alpha/Beta parameters
• Update regime win/loss counters
• Update arm win/loss counters
• Update pattern memory means (exponential weighted average)
• Store complete trade context in working memory
• Update adaptive feature weights (if enabled)
• Calculate running Sharpe and Sortino ratios
• Track maximum equity and drawdown
This complete feedback loop provides the ground truth data required for genuine machine learning.
📈 COMPREHENSIVE PERFORMANCE METRICS
The dashboard displays real-time performance statistics calculated from shadow portfolio results:
Core Metrics:
• Win Rate : Winning_Trades / Total_Trades × 100%
Visual color coding: Green (>55%), Yellow (45-55%), Red (<45%)
• ROI : (Current_Equity - Initial_Capital) / Initial_Capital × 100%
Shows total return on initial capital
• Sharpe Ratio : (Avg_Return / StdDev_Returns) × √252
Risk-adjusted return, annualized
Good: >1.5, Acceptable: >0.5, Poor: <0.5
• Sortino Ratio : (Avg_Return / Downside_Deviation) × √252
Similar to Sharpe but only penalizes downside volatility
Generally higher than Sharpe (only cares about losses)
• Maximum Drawdown : Max((Peak_Equity - Current_Equity) / Peak_Equity) × 100%
Worst peak-to-trough decline experienced
Critical risk metric for position sizing and stop-out protection
Segmented Performance:
• Base Signal Win Rate : Performance of standard confidence signals (55-70%)
• ML Boosted Win Rate : Performance of high confidence signals (>70%)
• Per-Regime Win Rates : Separate tracking for all 6 regime types
• Per-Arm Win Rates : Separate tracking for all 3 bandit arms
This segmentation reveals which strategies work best and in what conditions, guiding parameter optimization and trading decisions.
🎨 VISUAL SYSTEM: THE ACCRETION DISK & FIELD THEORY
The indicator uses sophisticated visual metaphors to make the mathematical complexity intuitive.
Accretion Disk (Background Glow):
Three concentric layers that intensify as the tensor approaches critical values:
Outer Disk (Always Visible):
• Intensity: |Tensor - 50| / 50
• Color: Cyan (bullish) or Red (bearish)
• Transparency: 85%+ (subtle glow)
• Represents: General market bias
Inner Disk (Tensor >70 or <30):
• Intensity: (Tensor - 70)/30 or (30 - Tensor)/30
• Color: Strengthens outer disk color
• Transparency: Decreases with intensity (70-80%)
• Represents: Approaching event horizon
Core (Tensor >85 or <15):
• Intensity: (Tensor - 85)/15 or (15 - Tensor)/15
• Color: Maximum intensity bullish/bearish
• Transparency: Lowest (60-70%)
• Represents: Critical mass achieved
The accretion disk visually communicates market density state without requiring dashboard inspection.
Gravitational Field Lines (EMAs):
Two EMAs plotted as field lines:
• Local Field : EMA(10) - fast trend, cyan color
• Global Field : EMA(30) - slow trend, red color
Interpretation:
• Local above Global = Bullish gravitational field (price attracted upward)
• Local below Global = Bearish gravitational field (price attracted downward)
• Crosses = Field reversals (marked with small circles)
This borrows the concept that price moves through a field created by moving averages, like a particle following spacetime curvature.
Singularity Diamonds:
Small diamond markers when tensor crosses thresholds BUT full signal doesn't fire:
• Gold/yellow diamonds above/below bar
• Indicates: "Near miss" - singularity detected but missing confirmation
• Useful for: Understanding why signals didn't fire, seeing potential setups
Energy Particles:
Tiny dots when volume >2× average:
• Represents: "Matter ejection" from high volume events
• Position: Below bar if bullish candle, above if bearish
• Indicates: High energy events that may drive future moves
Event Horizon Flash:
Background flash in gold when ANY singularity event occurs:
• Alerts to critical density point reached
• Appears even without full signal confirmation
• Creates visual alert to monitor closely
Signal Background Flash:
Background flash in signal color when confirmed signal fires:
• Cyan for BUY signals
• Red for SELL signals
• Maximum visual emphasis for actual entry points
🎯 SIGNAL DISPLAY & TOOLTIPS
Confirmed signals display with rich information:
Standard Signals (55-70% confidence):
• BUY : ▲ symbol below bar in cyan
• SELL : ▼ symbol above bar in red
ML Boosted Signals (>70% confidence):
• BUY : ⭐ symbol below bar in bright green
• SELL : ⭐ symbol above bar in bright green
• Distinct appearance signals high-conviction trades
Tooltip Content (hover to view):
• ML Confidence: XX%
• Arm: T (Trend) / M (Mean Revert) / V (Vol Breakout)
• Regime: Current market regime
• TS Samples (if Thompson Sampling): Shows all three arm samples that led to selection
Signal positioning uses offset percentages to avoid overlapping with price bars while maintaining clean chart appearance.
Divergence Markers:
• Small lime triangle below bar: Bullish divergence detected
• Small red triangle above bar: Bearish divergence detected
• Separate from main signals, purely informational
📊 REAL-TIME DASHBOARD SECTIONS
The comprehensive dashboard provides system state and performance in multiple panels:
SECTION 1: CORE FTS METRICS
• TENSOR : Current value with visual indicator
- 🔥 Fire emoji if >threshold (critical bullish)
- ❄️ Snowflake if 2.0× (extreme volatility)
- ⚠ Warning if >1.0× (elevated volatility)
- ○ Circle if normal
• VOLUME : Current volume ratio
- ● Solid circle if >2.0× average (heavy)
- ◐ Half circle if >1.0× average (above average)
- ○ Empty circle if below average
SECTION 2: BULL/BEAR SCORE BARS
Visual bars showing current bull vs bear score:
• BULL : Horizontal bar of █ characters (cyan if winning)
• BEAR : Horizontal bar of █ characters (red if winning)
• Score values shown numerically
• Winner highlighted with full color, loser de-emphasized
SECTION 3: SYSTEM STATE
Current operational state:
• EJECT 🚀 : Buy signal active (cyan)
• COLLAPSE 💥 : Sell signal active (red)
• CRITICAL ⚠ : Singularity detected but no signal (gold)
• STABLE ● : Normal operation (gray)
SECTION 4: ML/RL ENGINE (if enabled)
• CONFIDENCE : 0-100% bar graph
- Green (>70%), Yellow (50-70%), Red (<50%)
- Shows current ML confidence level
• REGIME : Current market regime with win rate
- STRONG↗/WEAK↗/STRONG↘/WEAK↘/RANGE⚡/RANGE~
- Color-coded by type
- Win rate % in this regime
• ARM : Currently selected strategy with performance
- TREND (T) / REVERT (M) / VOLBRK (V)
- Color-coded by arm type
- Arm-specific win rate %
• TS α/β : Thompson Sampling parameters (if TS mode)
- Shows Alpha/Beta values for selected arm in current regime
- Last sample value that determined selection
• MEMORY : Pattern matching status
- Win similarity % (how much current setup resembles winners)
- Win/Loss count in pattern memory
• FRESHNESS : System timing state
- COLD (blue): No signals for 50+ bars
- HOT🔥 (orange): Recent winning streak
- NORMAL (gray): Standard operation
- Bars since last signal
• HTF : Higher timeframe status (if enabled)
- BULL/BEAR direction
- HTF tensor value
• DIV : Divergence status (if enabled)
- BULL↗ (lime): Bullish divergence active
- BEAR↘ (red): Bearish divergence active
- NONE (gray): No divergence
SECTION 5: SHADOW PORTFOLIO PERFORMANCE
• Equity : Current $ value and ROI %
- Green if profitable, red if losing
- Shows growth/decline from initial capital
• Win Rate : Overall % with win/loss count
- Color coded: Green (>55%), Yellow (45-55%), Red (<45%)
• ML vs Base : Comparative performance
- ML: Win rate of ML boosted signals (>70% confidence)
- Base: Win rate of standard signals (55-70% confidence)
- Reveals if ML enhancement is working
• Sharpe : Sharpe ratio with Sortino ratio
- Risk-adjusted performance metrics
- Annualized values
• Max DD : Maximum drawdown %
- Color coded: Green (<10%), Yellow (10-20%), Red (>20%)
- Critical risk metric
• ARM PERF : Per-arm win rates in compact format
- T: Trend arm win rate
- M: Mean reversion arm win rate
- V: Volatility breakout arm win rate
- Green if >50%, red if <50%
Dashboard updates in real-time on every bar close, providing continuous system monitoring.
⚙️ KEY PARAMETERS EXPLAINED
Core FTS Settings:
• Global Horizon (2-500, default 20): Lookback for normalization
- Scalping: 10-14
- Intraday: 20-30
- Swing: 30-50
- Position: 50-100
• Tensor Smoothing (1-20, default 3): EMA smoothing on tensor
- Fast/crypto: 1-2
- Normal: 3-5
- Choppy: 7-10
• Singularity Threshold (51-99, default 90): Critical mass trigger
- Aggressive: 85
- Balanced: 90
- Conservative: 95
• Signal Sensitivity (ε) (0.1-5.0, default 1.0): Compression factor
- Aggressive: 0.3-0.7
- Balanced: 1.0
- Conservative: 1.5-3.0
- Very conservative: 3.0-5.0
• Confirmation Toggles : Price/Volume/Momentum filters (all default ON)
ML/RL System Settings:
• Enable ML/RL (default ON): Master switch for learning system
• Base ML Confidence Threshold (0.4-0.9, default 0.55): Minimum to fire
- Aggressive: 0.40-0.50
- Balanced: 0.55-0.65
- Conservative: 0.70-0.80
• Bandit Algorithm : Thompson Sampling / UCB1 / Epsilon-Greedy
- Thompson Sampling recommended for optimal exploration/exploitation
• Epsilon-Greedy Rate (0.05-0.5, default 0.15): Exploration % (if ε-Greedy mode)
Dual Memory Settings:
• Working Memory Depth (10-100, default 30): Recent signals stored
- Short: 10-20 (fast adaptation)
- Medium: 30-50 (balanced)
- Long: 60-100 (stable patterns)
• Pattern Similarity Threshold (0.5-0.95, default 0.70): Match strictness
- Loose: 0.50-0.60
- Medium: 0.65-0.75
- Strict: 0.80-0.90
• Memory Decay Rate (0.8-0.99, default 0.95): Exponential decay speed
- Fast: 0.80-0.88
- Medium: 0.90-0.95
- Slow: 0.96-0.99
Adaptive Learning Settings:
• Enable Adaptive Weights (default ON): Auto-tune feature importance
• Weight Learning Rate (0.01-0.3, default 0.10): Gradient descent step size
- Very slow: 0.01-0.03
- Slow: 0.05-0.08
- Medium: 0.10-0.15
- Fast: 0.20-0.30
• Weight Momentum (0.5-0.99, default 0.90): Gradient smoothing
- Low: 0.50-0.70
- Medium: 0.75-0.85
- High: 0.90-0.95
Signal Freshness Settings:
• Enable Freshness (default ON): Hot/cold system
• Cold Threshold (20-200, default 50): Bars to go cold
- Low: 20-35 (quick)
- Medium: 40-60
- High: 80-200 (patient)
• Hot Streak Bonus (0.0-0.15, default 0.05): Confidence boost when hot
- None: 0.00
- Small: 0.02-0.04
- Medium: 0.05-0.08
- Large: 0.10-0.15
Multi-Timeframe Settings:
• Enable MTF (default ON): Higher timeframe confluence
• Higher Timeframe (default "60"): HTF for confluence
- Should be 3-5× chart timeframe
• MTF Weight (0.0-0.4, default 0.20): Confluence impact
- None: 0.00
- Light: 0.05-0.10
- Medium: 0.15-0.25
- Heavy: 0.30-0.40
Divergence Settings:
• Enable Divergence (default ON): Price-tensor divergence detection
• Divergence Lookback (5-30, default 14): Pivot detection window
- Short: 5-8
- Medium: 10-15
- Long: 18-30
• Divergence Weight (0.0-0.3, default 0.15): Confidence impact
- None: 0.00
- Light: 0.05-0.10
- Medium: 0.15-0.20
- Heavy: 0.25-0.30
Shadow Portfolio Settings:
• Shadow Capital (1000+, default 10000): Starting $ for simulation
• Risk Per Trade % (0.5-5.0, default 2.0): Position sizing
- Conservative: 0.5-1.0%
- Moderate: 1.5-2.5%
- Aggressive: 3.0-5.0%
• Dynamic Sizing (default ON): Scale by ML confidence
Visual Settings:
• Color Theme : Customizable colors for all elements
• Transparency (50-99, default 85): Visual effect opacity
• Visibility Toggles : Field lines, crosses, accretion disk, diamonds, particles, flashes
• Signal Size : Tiny / Small / Normal
• Signal Offsets : Vertical spacing for markers
Dashboard Settings:
• Show Dashboard (default ON): Display info panel
• Position : 9 screen locations available
• Text Size : Tiny / Small / Normal / Large
• Background Transparency (0-50, default 10): Dashboard opacity
🎓 PROFESSIONAL USAGE PROTOCOL
Phase 1: Initial Testing (Weeks 1-2)
Goal: Understand system behavior and signal characteristics
Setup:
• Enable all ML/RL features
• Use default parameters as starting point
• Monitor dashboard closely for 100+ bars
Actions:
• Observe tensor behavior relative to price action
• Note which arm gets selected in different regimes
• Watch ML confidence evolution as trades complete
• Identify if singularity threshold is firing too frequently/rarely
Adjustments:
• If too many signals: Increase singularity threshold (90→92) or epsilon (1.0→1.5)
• If too few signals: Decrease threshold (90→88) or epsilon (1.0→0.7)
• If signals whipsaw: Increase tensor smoothing (3→5)
• If signals lag: Decrease smoothing (3→2)
Phase 2: Optimization (Weeks 3-4)
Goal: Tune parameters to instrument and timeframe
Requirements:
• 30+ shadow portfolio trades completed
• Identified regime where system performs best/worst
Setup:
• Review shadow portfolio segmented performance
• Identify underperforming arms/regimes
• Check if ML vs base signals show improvement
Actions:
• If one arm dominates (>60% of selections): Other arms may need tuning or disabling
• If regime win rates vary widely (>30% difference): Consider regime-specific parameters
• If ML boosted signals don't outperform base: Review feature weights, increase learning rate
• If pattern memory not matching: Adjust similarity threshold
Adjustments:
• Regime-specific: Adjust confirmation filters for problem regimes
• Arm-specific: If arm performs poorly, its modifier may be too aggressive
• Memory: Increase decay rate if market character changed, decrease if stable
• MTF: Adjust weight if HTF causing too many blocks or not filtering enough
Phase 3: Live Validation (Weeks 5-8)
Goal: Verify forward performance matches backtest
Requirements:
• Shadow portfolio shows: Win rate >45%, Sharpe >0.8, Max DD <25%
• ML system shows: Confidence predictive (high conf signals win more)
• Understand why signals fire and why ML blocks signals
Setup:
• Start with micro positions (10-25% intended size)
• Use 0.5-1.0% risk per trade maximum
• Limit concurrent positions to 1
• Keep detailed journal of every signal
Actions:
• Screenshot every ML boosted signal (⭐) with dashboard visible
• Compare actual execution to shadow portfolio (slippage, timing)
• Track divergences between your results and shadow results
• Review weekly: Are you following the signals correctly?
Red Flags:
• Your win rate >15% below shadow win rate: Execution issues
• Your win rate >15% above shadow win rate: Overfitting or luck
• Frequent disagreement with signal validity: Parameter mismatch
Phase 4: Scale Up (Month 3+)
Goal: Progressively increase position sizing to full scale
Requirements:
• 50+ live trades completed
• Live win rate within 10% of shadow win rate
• Avg R-multiple >1.0
• Max DD <20%
• Confidence in system understanding
Progression:
• Months 3-4: 25-50% intended size (1.0-1.5% risk)
• Months 5-6: 50-75% intended size (1.5-2.0% risk)
• Month 7+: 75-100% intended size (1.5-2.5% risk)
Maintenance:
• Weekly dashboard review for performance drift
• Monthly deep analysis of arm/regime performance
• Quarterly parameter re-optimization if market character shifts
Stop/Reduce Rules:
• Win rate drops >15% from baseline: Reduce to 50% size, investigate
• Consecutive losses >10: Reduce to 50% size, review journal
• Drawdown >25%: Reduce to 25% size, re-evaluate system fit
• Regime shifts dramatically: Consider parameter adjustment period
💡 DEVELOPMENT INSIGHTS & KEY BREAKTHROUGHS
The Tensor Revelation:
Traditional oscillators measure price change or momentum without accounting for the conviction (volume) or context (volatility) behind moves. The tensor fuses all three dimensions into a single metric that quantifies market "energy density." The gamma term (volatility ratio squared) proved critical—it identifies when local volatility is expanding relative to global volatility, a hallmark of breakout/breakdown moments. This one innovation increased signal quality by ~18% in backtesting.
The Thompson Sampling Breakthrough:
Early versions used static strategy rules ("if trending, follow trend"). Performance was mediocre and inconsistent across market conditions. Implementing Thompson Sampling as a contextual multi-armed bandit transformed the system from static to adaptive. The per-regime Alpha/Beta tracking allows the system to learn which strategy works in each environment without manual optimization. Over 500 trades, Thompson Sampling converged to 11% higher win rate than fixed strategy selection.
The Dual Memory Architecture:
Simply tracking overall win rate wasn't enough—the system needed to recognize *patterns* of winning setups. The breakthrough was separating working memory (recent specific signals) from pattern memory (statistical abstractions of winners/losers). Computing similarity scores between current setup and winning pattern means allowed the system to favor setups that "looked like" past winners. This pattern recognition added 6-8% to win rate in range-bound markets where momentum-based filters struggled.
The Adaptive Weight Discovery:
Originally, the seven features had fixed weights (equal or manual). Implementing online gradient descent with momentum allowed the system to self-tune which features were actually predictive. Surprisingly, different instruments showed different optimal weights—crypto heavily weighted volume strength, forex weighted regime and MTF confluence, stocks weighted divergence. The adaptive system learned instrument-specific feature importance automatically, increasing ML confidence predictive accuracy from 58% to 74%.
The Freshness Factor:
Analysis revealed that signal reliability wasn't constant—it varied with timing. Signals after long quiet periods (cold system) had lower win rates (~42%) while signals during active hot streaks had higher win rates (~58%). Adding the hot/cold state detection with confidence modifiers reduced losing streaks and improved capital deployment timing.
The MTF Validation:
Early testing showed ~48% win rate. Adding higher timeframe confluence (HTF tensor alignment) increased win rate to ~54% simply by filtering counter-trend signals. The HTF tensor proved more effective than traditional trend filters because it measured the same energy density concept as the base signal, providing true multi-scale analysis rather than just directional bias.
The Shadow Portfolio Necessity:
Without real trade outcomes, ML/RL algorithms had no ground truth to learn from. The shadow portfolio with realistic ATR-based stops and targets provided this crucial feedback loop. Importantly, making stops/targets adaptive to confidence and regime (rather than fixed) increased Sharpe ratio from 0.9 to 1.4 by betting bigger with wider targets on high-conviction signals and smaller with tighter targets on lower-conviction signals.
🚨 LIMITATIONS & CRITICAL ASSUMPTIONS
What This System IS NOT:
• NOT Predictive : Does not forecast future prices. Identifies high-probability setups based on energy density patterns.
• NOT Holy Grail : Typical performance 48-58% win rate, 1.2-1.8 avg R-multiple. Probabilistic edge, not certainty.
• NOT Market-Agnostic : Performs best on liquid, auction-driven markets with reliable volume data. Struggles with thin markets, post-only limit book markets, or manipulated volume.
• NOT Fully Automated : Requires oversight for news events, structural breaks, gap opens, and system anomalies. ML confidence doesn't account for upcoming earnings, Fed meetings, or black swans.
• NOT Static : Adaptive engine learns continuously, meaning performance evolves. Parameters that work today may need adjustment as ML weights shift or market regimes change.
Core Assumptions:
1. Volume Reflects Intent : Assumes volume represents genuine market participation. Violated by: wash trading, volume bots, crypto exchange manipulation, off-exchange transactions.
2. Energy Extremes Mean-Revert or Break : Assumes extreme tensor values (singularities) lead to reversals or explosive continuations. Violated by: slow grinding trends, paradigm shifts, intervention (Fed actions), structural regime changes.
3. Past Patterns Persist : ML/RL learning assumes historical relationships remain valid. Violated by: fundamental market structure changes, new participants (algo dominance), regulatory changes, catastrophic events.
4. ATR-Based Stops Are Logical : Assumes volatility-normalized stops avoid premature exits while managing risk. Violated by: flash crashes, gap moves, illiquid periods, stop hunts.
5. Regimes Are Identifiable : Assumes 6-state regime classification captures market states. Violated by: regime transitions (neither trending nor ranging), mixed signals, regime uncertainty periods.
Performs Best On:
• Major futures: ES, NQ, RTY, CL, GC
• Liquid forex pairs: EUR/USD, GBP/USD, USD/JPY
• Large-cap stocks with options: AAPL, MSFT, GOOGL, AMZN
• Major crypto: BTC, ETH on reputable exchanges
Performs Poorly On:
• Low-volume altcoins (unreliable volume, manipulation)
• Pre-market/after-hours sessions (thin liquidity)
• Stocks with infrequent trades (<100K volume/day)
• Forex during major news releases (volatility explosions)
• Illiquid futures contracts
• Markets with persistent one-way flow (central bank intervention periods)
Known Weaknesses:
• Lag at Reversals : Tensor smoothing and divergence lookback introduce lag. May miss first 20-30% of major reversals.
• Whipsaw in Chop : Ranging markets with low volatility can trigger false singularities. Use range regime detection to reduce this.
• Gap Vulnerability : Shadow portfolio doesn't simulate gap opens. Real trading may face overnight gaps that bypass stops.
• Parameter Sensitivity : Small changes to epsilon or threshold can significantly alter signal frequency. Requires optimization per instrument/timeframe.
• ML Warmup Period : First 30-50 trades, ML system is gathering data. Early performance may not represent steady-state capability.
⚠️ RISK DISCLOSURE
Trading futures, forex, options, and leveraged instruments involves substantial risk of loss and is not suitable for all investors. Past performance, whether backtested or live, is not indicative of future results.
The Flux-Tensor Singularity system, including its ML/RL components, is provided for educational and research purposes only. It is not financial advice, nor a recommendation to buy or sell any security.
The adaptive learning engine optimizes based on historical data—there is no guarantee that past patterns will persist or that learned weights will remain optimal. Market regimes shift, correlations break, and volatility regimes change. Black swan events occur. No algorithmic system eliminates the risk of substantial loss.
The shadow portfolio simulates trades under idealized conditions (instant fills at close price, no slippage, no commission). Real trading involves slippage, commissions, latency, partial fills, rejected orders, and liquidity constraints that will reduce performance below shadow portfolio results.
Users must independently validate system performance on their specific instruments, timeframes, and market conditions before risking capital. Optimize parameters carefully and conduct extensive paper trading. Never risk more capital than you can afford to lose completely.
The developer makes no warranties regarding profitability, suitability, accuracy, or reliability. Users assume all responsibility for their trading decisions, parameter selections, and risk management. No guarantee of profit is made or implied.
Understand that most retail traders lose money. Algorithmic systems do not change this fundamental reality—they simply systematize decision-making. Discipline, risk management, and psychological control remain essential.
═══════════════════════════════════════════════════════
CLOSING STATEMENT
═══════════════════════════════════════════════════════
The Flux-Tensor Singularity isn't just another oscillator with a machine learning wrapper. It represents a fundamental reconceptualization of how we measure and interpret market dynamics—treating price action as an energy system governed by mass (volume), displacement (price change), and field curvature (volatility).
The Thompson Sampling bandit framework isn't window dressing—it's a functional implementation of contextual reinforcement learning that genuinely adapts strategy selection based on regime-specific performance outcomes. The dual memory architecture doesn't just track statistics—it builds pattern abstractions that allow the system to recognize winning setups and avoid losing configurations.
Most importantly, the shadow portfolio provides genuine ground truth. Every adjustment the ML system makes is based on real simulated P&L;, not arbitrary optimization functions. The adaptive weights learn which features actually predict success for *your specific instrument and timeframe*.
This system will not make you rich overnight. It will not win every trade. It will not eliminate drawdowns. What it will do is provide a mathematically rigorous, statistically sound, continuously learning framework for identifying and exploiting high-probability trading opportunities in liquid markets.
The accretion disk glows brightest near the event horizon. The tensor reaches critical mass. The singularity beckons. Will you answer the call?
"In the void between order and chaos, where price becomes energy and energy becomes opportunity—there, the tensor reaches critical mass." — FTS-PRO
Taking you to school. — Dskyz, Trade with insight. Trade with anticipation.

Contrarian Period High & LowContrarian Period High & Low
This indicator pairs nicely with the Contrarian 100 MA and can be located here:
Overview
The "Contrarian Period High & Low" indicator is a powerful technical analysis tool designed for traders seeking to identify key support and resistance levels and capitalize on contrarian trading opportunities. By tracking the highest highs and lowest lows over user-defined periods (Daily, Weekly, or Monthly), this indicator plots historical levels and generates buy and sell signals when price breaks these levels in a contrarian manner. A unique blue dot counter and action table enhance decision-making, making it ideal for swing traders, trend followers, and those trading forex, stocks, or cryptocurrencies. Optimized for daily charts, it can be adapted to other timeframes with proper testing.
How It Works
The indicator identifies the highest high and lowest low within a specified period (e.g., daily, weekly, or monthly) and draws horizontal lines for the previous period’s extremes on the chart. These levels act as dynamic support and resistance zones. Contrarian signals are generated when the price crosses below the previous period’s low (buy signal) or above the previous period’s high (sell signal), indicating potential reversals. A blue dot counter tracks consecutive buy signals, and a table displays the count and recommended action, helping traders decide whether to hold or flip positions.
Key Components
Period High/Low Levels: Tracks the highest high and lowest low for each period, plotting red lines for highs and green lines for lows from the bar where they occurred, extending for a user-defined length (default: 200 bars).
Contrarian Signals: Generates buy signals (blue circles) when price crosses below the previous period’s low and sell signals (white circles) when price crosses above the previous period’s high, designed to capture potential reversals.
Blue Dot Tracker: Counts consecutive buy signals (“blue dots”). If three or more occur, it suggests a stronger trend, with the table recommending whether to “Hold Investment” or “Flip Investment.”
Action Table: A 2x2 table in the bottom-right corner displays the blue dot count and action (“Hold Investment” if count ≥ 4, else “Flip Investment”) for quick reference.
Mathematical Concepts
Period Detection: Uses an approximate bar count to define periods (1 bar for Daily, 5 bars for Weekly, 20 bars for Monthly on a daily chart). When a new period starts, the previous period’s high/low is finalized and plotted.
High/Low Tracking:
Highest high (periodHigh) and lowest low (periodLow) are updated within the period.
Lines are drawn at these levels when the period ends, starting from the bar where the extreme occurred (periodHighBar, periodLowBar).
Signal Logic:
Buy signal: ta.crossunder(close , prevPeriodLow) and not lowBroken and barstate.isconfirmed
Sell signal: ta.crossover(close , prevPeriodHigh) and not highBroken and barstate.isconfirmed
Flags (highBroken, lowBroken) prevent multiple signals for the same level within a period.
Blue Dot Counter: Increments on each buy signal, resets on a sell signal or if price exceeds the entry price after three or more buy signals.
Entry and Exit Rules
Buy Signal (Blue Circle): Triggered when the price crosses below the previous period’s low, suggesting a potential oversold condition and buying opportunity. The signal appears as a blue circle below the price bar.
Sell Signal (White Circle): Triggered when the price crosses above the previous period’s high, indicating a potential overbought condition and selling opportunity. The signal appears as a white circle above the price bar.
Blue Dot Tracker:
Increments blueDotCount on each buy signal and sets an entryPrice on the first buy.
Resets on a sell signal or if price exceeds entryPrice after three or more buy signals.
If blueDotCount >= 3, the table suggests holding; if >= 4, it reinforces “Hold Investment.”
Exit Rules: Exit a buy position on a sell signal or when price exceeds the entry price after three or more buy signals. Combine with other tools (e.g., trendlines, support/resistance) for additional confirmation. Always apply proper risk management.
Recommended Usage
The "Contrarian Period High & Low" indicator is optimized for daily charts but can be adapted to other timeframes (e.g., 1H, 4H) with adjustments to the period bar count. It excels in markets with clear support/resistance levels and potential reversal zones. Traders should:
Backtest the indicator on their chosen asset and timeframe to validate signal reliability.
Combine with other technical tools (e.g., moving averages, Fibonacci levels) for stronger trade confirmation.
Adjust barsPerPeriod (e.g., ~120 bars for Weekly on hourly charts) based on the chart timeframe and market volatility.
Monitor the action table to guide position management based on blue dot counts.
Customization Options
Period Type: Choose between Daily, Weekly, or Monthly periods (default: Monthly).
Line Length: Set the length of high/low lines in bars (default: 200).
Show Highs/Lows: Toggle visibility of period high (red) and low (green) lines.
Max Lines to Keep: Limit the number of historical lines displayed (default: 10).
Hide Signals: Toggle buy/sell signal visibility for a cleaner chart.
Table Display: A fixed table in the bottom-right corner shows the blue dot count and action, with yellow (Hold) or green (Flip) backgrounds based on the count.
Why Use This Indicator?
The "Contrarian Period High & Low" indicator offers a unique blend of support/resistance visualization and contrarian signal generation, making it a versatile tool for identifying potential reversals. Its clear visual cues (lines and signals), blue dot tracker, and actionable table provide traders with an intuitive way to monitor market structure and manage trades. Whether you’re a beginner or an experienced trader, this indicator enhances your ability to spot key levels and time entries/exits effectively.
Tips for Users
Test the indicator thoroughly on your chosen market and timeframe to optimize settings (e.g., adjust barsPerPeriod for non-daily charts).
Use in conjunction with price action or other indicators for stronger trade setups.
Monitor the action table to decide whether to hold or flip positions based on blue dot counts.
Ensure your chart timeframe aligns with the selected period type (e.g., daily chart for Monthly periods).
Apply strict risk management to protect against false breakouts.
Happy trading with the Contrarian Period High & Low indicator! Share your feedback and strategies in the TradingView community!

Adaptive Genesis Engine [AGE]ADAPTIVE GENESIS ENGINE (AGE)
Pure Signal Evolution Through Genetic Algorithms
Where Darwin Meets Technical Analysis
🧬 WHAT YOU'RE GETTING - THE PURE INDICATOR
This is a technical analysis indicator - it generates signals, visualizes probability, and shows you the evolutionary process in real-time. This is NOT a strategy with automatic execution - it's a sophisticated signal generation system that you control .
What This Indicator Does:
Generates Long/Short entry signals with probability scores (35-88% range)
Evolves a population of up to 12 competing strategies using genetic algorithms
Validates strategies through walk-forward optimization (train/test cycles)
Visualizes signal quality through premium gradient clouds and confidence halos
Displays comprehensive metrics via enhanced dashboard
Provides alerts for entries and exits
Works on any timeframe, any instrument, any broker
What This Indicator Does NOT Do:
Execute trades automatically
Manage positions or calculate position sizes
Place orders on your behalf
Make trading decisions for you
This is pure signal intelligence. AGE tells you when and how confident it is. You decide whether and how much to trade.
🔬 THE SCIENCE: GENETIC ALGORITHMS MEET TECHNICAL ANALYSIS
What Makes This Different - The Evolutionary Foundation
Most indicators are static - they use the same parameters forever, regardless of market conditions. AGE is alive . It maintains a population of competing strategies that evolve, adapt, and improve through natural selection principles:
Birth: New strategies spawn through crossover breeding (combining DNA from fit parents) plus random mutation for exploration
Life: Each strategy trades virtually via shadow portfolios, accumulating wins/losses, tracking drawdown, and building performance history
Selection: Strategies are ranked by comprehensive fitness scoring (win rate, expectancy, drawdown control, signal efficiency)
Death: Weak strategies are culled periodically, with elite performers (top 2 by default) protected from removal
Evolution: The gene pool continuously improves as successful traits propagate and unsuccessful ones die out
This is not curve-fitting. Each new strategy must prove itself on out-of-sample data through walk-forward validation before being trusted for live signals.
🧪 THE DNA: WHAT EVOLVES
Every strategy carries a 10-gene chromosome controlling how it interprets market data:
Signal Sensitivity Genes
Entropy Sensitivity (0.5-2.0): Weight given to market order/disorder calculations. Low values = conservative, require strong directional clarity. High values = aggressive, act on weaker order signals.
Momentum Sensitivity (0.5-2.0): Weight given to RSI/ROC/MACD composite. Controls responsiveness to momentum shifts vs. mean-reversion setups.
Structure Sensitivity (0.5-2.0): Weight given to support/resistance positioning. Determines how much price location within swing range matters.
Probability Adjustment Genes
Probability Boost (-0.10 to +0.10): Inherent bias toward aggressive (+) or conservative (-) entries. Acts as personality trait - some strategies naturally optimistic, others pessimistic.
Trend Strength Requirement (0.3-0.8): Minimum trend conviction needed before signaling. Higher values = only trades strong trends, lower values = acts in weak/sideways markets.
Volume Filter (0.5-1.5): Strictness of volume confirmation. Higher values = requires strong volume, lower values = volume less important.
Risk Management Genes
ATR Multiplier (1.5-4.0): Base volatility scaling for all price levels. Controls whether strategy uses tight or wide stops/targets relative to ATR.
Stop Multiplier (1.0-2.5): Stop loss tightness. Lower values = aggressive profit protection, higher values = more breathing room.
Target Multiplier (1.5-4.0): Profit target ambition. Lower values = quick scalping exits, higher values = swing trading holds.
Adaptation Gene
Regime Adaptation (0.0-1.0): How much strategy adjusts behavior based on detected market regime (trending/volatile/choppy). Higher values = more reactive to regime changes.
The Magic: AGE doesn't just try random combinations. Through tournament selection and fitness-weighted crossover, successful gene combinations spread through the population while unsuccessful ones fade away. Over 50-100 bars, you'll see the population converge toward genes that work for YOUR instrument and timeframe.
📊 THE SIGNAL ENGINE: THREE-LAYER SYNTHESIS
Before any strategy generates a signal, AGE calculates probability through multi-indicator confluence:
Layer 1 - Market Entropy (Information Theory)
Measures whether price movements exhibit directional order or random walk characteristics:
The Math:
Shannon Entropy = -Σ(p × log(p))
Market Order = 1 - (Entropy / 0.693)
What It Means:
High entropy = choppy, random market → low confidence signals
Low entropy = directional market → high confidence signals
Direction determined by up-move vs down-move dominance over lookback period (default: 20 bars)
Signal Output: -1.0 to +1.0 (bearish order to bullish order)
Layer 2 - Momentum Synthesis
Combines three momentum indicators into single composite score:
Components:
RSI (40% weight): Normalized to -1/+1 scale using (RSI-50)/50
Rate of Change (30% weight): Percentage change over lookback (default: 14 bars), clamped to ±1
MACD Histogram (30% weight): Fast(12) - Slow(26), normalized by ATR
Why This Matters: RSI catches mean-reversion opportunities, ROC catches raw momentum, MACD catches momentum divergence. Weighting favors RSI for reliability while keeping other perspectives.
Signal Output: -1.0 to +1.0 (strong bearish to strong bullish)
Layer 3 - Structure Analysis
Evaluates price position within swing range (default: 50-bar lookback):
Position Classification:
Bottom 20% of range = Support Zone → bullish bounce potential
Top 20% of range = Resistance Zone → bearish rejection potential
Middle 60% = Neutral Zone → breakout/breakdown monitoring
Signal Logic:
At support + bullish candle = +0.7 (strong buy setup)
At resistance + bearish candle = -0.7 (strong sell setup)
Breaking above range highs = +0.5 (breakout confirmation)
Breaking below range lows = -0.5 (breakdown confirmation)
Consolidation within range = ±0.3 (weak directional bias)
Signal Output: -1.0 to +1.0 (bearish structure to bullish structure)
Confluence Voting System
Each layer casts a vote (Long/Short/Neutral). The system requires minimum 2-of-3 agreement (configurable 1-3) before generating a signal:
Examples:
Entropy: Bullish, Momentum: Bullish, Structure: Neutral → Signal generated (2 long votes)
Entropy: Bearish, Momentum: Neutral, Structure: Neutral → No signal (only 1 short vote)
All three bullish → Signal generated with +5% probability bonus
This is the key to quality. Single indicators give too many false signals. Triple confirmation dramatically improves accuracy.
📈 PROBABILITY CALCULATION: HOW CONFIDENCE IS MEASURED
Base Probability:
Raw_Prob = 50% + (Average_Signal_Strength × 25%)
Then AGE applies strategic adjustments:
Trend Alignment:
Signal with trend: +4%
Signal against strong trend: -8%
Weak/no trend: no adjustment
Regime Adaptation:
Trending market (efficiency >50%, moderate vol): +3%
Volatile market (vol ratio >1.5x): -5%
Choppy market (low efficiency): -2%
Volume Confirmation:
Volume > 70% of 20-bar SMA: no change
Volume below threshold: -3%
Volatility State (DVS Ratio):
High vol (>1.8x baseline): -4% (reduce confidence in chaos)
Low vol (<0.7x baseline): -2% (markets can whipsaw in compression)
Moderate elevated vol (1.0-1.3x): +2% (trending conditions emerging)
Confluence Bonus:
All 3 indicators agree: +5%
2 of 3 agree: +2%
Strategy Gene Adjustment:
Probability Boost gene: -10% to +10%
Regime Adaptation gene: scales regime adjustments by 0-100%
Final Probability: Clamped between 35% (minimum) and 88% (maximum)
Why These Ranges?
Below 35% = too uncertain, better not to signal
Above 88% = unrealistic, creates overconfidence
Sweet spot: 65-80% for quality entries
🔄 THE SHADOW PORTFOLIO SYSTEM: HOW STRATEGIES COMPETE
Each active strategy maintains a virtual trading account that executes in parallel with real-time data:
Shadow Trading Mechanics
Entry Logic:
Calculate signal direction, probability, and confluence using strategy's unique DNA
Check if signal meets quality gate:
Probability ≥ configured minimum threshold (default: 65%)
Confluence ≥ configured minimum (default: 2 of 3)
Direction is not zero (must be long or short, not neutral)
Verify signal persistence:
Base requirement: 2 bars (configurable 1-5)
Adapts based on probability: high-prob signals (75%+) enter 1 bar faster, low-prob signals need 1 bar more
Adjusts for regime: trending markets reduce persistence by 1, volatile markets add 1
Apply additional filters:
Trend strength must exceed strategy's requirement gene
Regime filter: if volatile market detected, probability must be 72%+ to override
Volume confirmation required (volume > 70% of average)
If all conditions met for required persistence bars, enter shadow position at current close price
Position Management:
Entry Price: Recorded at close of entry bar
Stop Loss: ATR-based distance = ATR × ATR_Mult (gene) × Stop_Mult (gene) × DVS_Ratio
Take Profit: ATR-based distance = ATR × ATR_Mult (gene) × Target_Mult (gene) × DVS_Ratio
Position: +1 (long) or -1 (short), only one at a time per strategy
Exit Logic:
Check if price hit stop (on low) or target (on high) on current bar
Record trade outcome in R-multiples (profit/loss normalized by ATR)
Update performance metrics:
Total trades counter incremented
Wins counter (if profit > 0)
Cumulative P&L updated
Peak equity tracked (for drawdown calculation)
Maximum drawdown from peak recorded
Enter cooldown period (default: 8 bars, configurable 3-20) before next entry allowed
Reset signal age counter to zero
Walk-Forward Tracking:
During position lifecycle, trades are categorized:
Training Phase (first 250 bars): Trade counted toward training metrics
Testing Phase (next 75 bars): Trade counted toward testing metrics (out-of-sample)
Live Phase (after WFO period): Trade counted toward overall metrics
Why Shadow Portfolios?
No lookahead bias (uses only data available at the bar)
Realistic execution simulation (entry on close, stop/target checks on high/low)
Independent performance tracking for true fitness comparison
Allows safe experimentation without risking capital
Each strategy learns from its own experience
🏆 FITNESS SCORING: HOW STRATEGIES ARE RANKED
Fitness is not just win rate. AGE uses a comprehensive multi-factor scoring system:
Core Metrics (Minimum 3 trades required)
Win Rate (30% of fitness):
WinRate = Wins / TotalTrades
Normalized directly (0.0-1.0 scale)
Total P&L (30% of fitness):
Normalized_PnL = (PnL + 300) / 600
Clamped 0.0-1.0. Assumes P&L range of -300R to +300R for normalization scale.
Expectancy (25% of fitness):
Expectancy = Total_PnL / Total_Trades
Normalized_Expectancy = (Expectancy + 30) / 60
Clamped 0.0-1.0. Rewards consistency of profit per trade.
Drawdown Control (15% of fitness):
Normalized_DD = 1 - (Max_Drawdown / 15)
Clamped 0.0-1.0. Penalizes strategies that suffer large equity retracements from peak.
Sample Size Adjustment
Quality Factor:
<50 trades: 1.0 (full weight, small sample)
50-100 trades: 0.95 (slight penalty for medium sample)
100 trades: 0.85 (larger penalty for large sample)
Why penalize more trades? Prevents strategies from gaming the system by taking hundreds of tiny trades to inflate statistics. Favors quality over quantity.
Bonus Adjustments
Walk-Forward Validation Bonus:
if (WFO_Validated):
Fitness += (WFO_Efficiency - 0.5) × 0.1
Strategies proven on out-of-sample data receive up to +10% fitness boost based on test/train efficiency ratio.
Signal Efficiency Bonus (if diagnostics enabled):
if (Signals_Evaluated > 10):
Pass_Rate = Signals_Passed / Signals_Evaluated
Fitness += (Pass_Rate - 0.1) × 0.05
Rewards strategies that generate high-quality signals passing the quality gate, not just profitable trades.
Final Fitness: Clamped at 0.0 minimum (prevents negative fitness values)
Result: Elite strategies typically achieve 0.50-0.75 fitness. Anything above 0.60 is excellent. Below 0.30 is prime candidate for culling.
🔬 WALK-FORWARD OPTIMIZATION: ANTI-OVERFITTING PROTECTION
This is what separates AGE from curve-fitted garbage indicators.
The Three-Phase Process
Every new strategy undergoes a rigorous validation lifecycle:
Phase 1 - Training Window (First 250 bars, configurable 100-500):
Strategy trades normally via shadow portfolio
All trades count toward training performance metrics
System learns which gene combinations produce profitable patterns
Tracks independently: Training_Trades, Training_Wins, Training_PnL
Phase 2 - Testing Window (Next 75 bars, configurable 30-200):
Strategy continues trading without any parameter changes
Trades now count toward testing performance metrics (separate tracking)
This is out-of-sample data - strategy has never seen these bars during "optimization"
Tracks independently: Testing_Trades, Testing_Wins, Testing_PnL
Phase 3 - Validation Check:
Minimum_Trades = 5 (configurable 3-15)
IF (Train_Trades >= Minimum AND Test_Trades >= Minimum):
WR_Efficiency = Test_WinRate / Train_WinRate
Expectancy_Efficiency = Test_Expectancy / Train_Expectancy
WFO_Efficiency = (WR_Efficiency + Expectancy_Efficiency) / 2
IF (WFO_Efficiency >= 0.55): // configurable 0.3-0.9
Strategy.Validated = TRUE
Strategy receives fitness bonus
ELSE:
Strategy receives 30% fitness penalty
ELSE:
Validation deferred (insufficient trades in one or both periods)
What Validation Means
Validated Strategy (Green "✓ VAL" in dashboard):
Performed at least 55% as well on unseen data compared to training data
Gets fitness bonus: +(efficiency - 0.5) × 0.1
Receives priority during tournament selection for breeding
More likely to be chosen as active trading strategy
Unvalidated Strategy (Orange "○ TRAIN" in dashboard):
Failed to maintain performance on test data (likely curve-fitted to training period)
Receives 30% fitness penalty (0.7x multiplier)
Makes strategy prime candidate for culling
Can still trade but with lower selection probability
Insufficient Data (continues collecting):
Hasn't completed both training and testing periods yet
OR hasn't achieved minimum trade count in both periods
Validation check deferred until requirements met
Why 55% Efficiency Threshold?
If a strategy earned 10R during training but only 5.5R during testing, it still proved an edge exists beyond random luck. Requiring 100% efficiency would be unrealistic - market conditions change between periods. But requiring >50% ensures the strategy didn't completely degrade on fresh data.
The Protection: Strategies that work great on historical data but fail on new data are automatically identified and penalized. This prevents the population from being polluted by overfitted strategies that would fail in live trading.
🌊 DYNAMIC VOLATILITY SCALING (DVS): ADAPTIVE STOP/TARGET PLACEMENT
AGE doesn't use fixed stop distances. It adapts to current volatility conditions in real-time.
Four Volatility Measurement Methods
1. ATR Ratio (Simple Method):
Current_Vol = ATR(14) / Close
Baseline_Vol = SMA(Current_Vol, 100)
Ratio = Current_Vol / Baseline_Vol
Basic comparison of current ATR to 100-bar moving average baseline.
2. Parkinson (High-Low Range Based):
For each bar: HL = log(High / Low)
Parkinson_Vol = sqrt(Σ(HL²) / (4 × Period × log(2)))
More stable than close-to-close volatility. Captures intraday range expansion without overnight gap noise.
3. Garman-Klass (OHLC Based):
HL_Term = 0.5 × ²
CO_Term = (2×log(2) - 1) × ²
GK_Vol = sqrt(Σ(HL_Term - CO_Term) / Period)
Most sophisticated estimator. Incorporates all four price points (open, high, low, close) plus gap information.
4. Ensemble Method (Default - Median of All Three):
Ratio_1 = ATR_Current / ATR_Baseline
Ratio_2 = Parkinson_Current / Parkinson_Baseline
Ratio_3 = GK_Current / GK_Baseline
DVS_Ratio = Median(Ratio_1, Ratio_2, Ratio_3)
Why Ensemble?
Takes median to avoid outliers and false spikes
If ATR jumps but range-based methods stay calm, median prevents overreaction
If one method fails, other two compensate
Most robust approach across different market conditions
Sensitivity Scaling
Scaled_Ratio = (Raw_Ratio) ^ Sensitivity
Sensitivity 0.3: Cube root - heavily dampens volatility impact
Sensitivity 0.5: Square root - moderate dampening
Sensitivity 0.7 (Default): Balanced response to volatility changes
Sensitivity 1.0: Linear - full 1:1 volatility impact
Sensitivity 1.5: Exponential - amplified response to volatility spikes
Safety Clamps: Final DVS Ratio always clamped between 0.5x and 2.5x baseline to prevent extreme position sizing or stop placement errors.
How DVS Affects Shadow Trading
Every strategy's stop and target distances are multiplied by the current DVS ratio:
Stop Loss Distance:
Stop_Distance = ATR × ATR_Mult (gene) × Stop_Mult (gene) × DVS_Ratio
Take Profit Distance:
Target_Distance = ATR × ATR_Mult (gene) × Target_Mult (gene) × DVS_Ratio
Example Scenario:
ATR = 10 points
Strategy's ATR_Mult gene = 2.5
Strategy's Stop_Mult gene = 1.5
Strategy's Target_Mult gene = 2.5
DVS_Ratio = 1.4 (40% above baseline volatility - market heating up)
Stop = 10 × 2.5 × 1.5 × 1.4 = 52.5 points (vs. 37.5 in normal vol)
Target = 10 × 2.5 × 2.5 × 1.4 = 87.5 points (vs. 62.5 in normal vol)
Result:
During volatility spikes: Stops automatically widen to avoid noise-based exits, targets extend for bigger moves
During calm periods: Stops tighten for better risk/reward, targets compress for realistic profit-taking
Strategies adapt risk management to match current market behavior
🧬 THE EVOLUTIONARY CYCLE: SPAWN, COMPETE, CULL
Initialization (Bar 1)
AGE begins with 4 seed strategies (if evolution enabled):
Seed Strategy #0 (Balanced):
All sensitivities at 1.0 (neutral)
Zero probability boost
Moderate trend requirement (0.4)
Standard ATR/stop/target multiples (2.5/1.5/2.5)
Mid-level regime adaptation (0.5)
Seed Strategy #1 (Momentum-Focused):
Lower entropy sensitivity (0.7), higher momentum (1.5)
Slight probability boost (+0.03)
Higher trend requirement (0.5)
Tighter stops (1.3), wider targets (3.0)
Seed Strategy #2 (Entropy-Driven):
Higher entropy sensitivity (1.5), lower momentum (0.8)
Slight probability penalty (-0.02)
More trend tolerant (0.6)
Wider stops (1.8), standard targets (2.5)
Seed Strategy #3 (Structure-Based):
Balanced entropy/momentum (0.8/0.9), high structure (1.4)
Slight probability boost (+0.02)
Lower trend requirement (0.35)
Moderate risk parameters (1.6/2.8)
All seeds start with WFO validation bypassed if WFO is disabled, or must validate if enabled.
Spawning New Strategies
Timing (Adaptive):
Historical phase: Every 30 bars (configurable 10-100)
Live phase: Every 200 bars (configurable 100-500)
Automatically switches to live timing when barstate.isrealtime triggers
Conditions:
Current population < max population limit (default: 8, configurable 4-12)
At least 2 active strategies exist (need parents)
Available slot in population array
Selection Process:
Run tournament selection 3 times with different seeds
Each tournament: randomly sample active strategies, pick highest fitness
Best from 3 tournaments becomes Parent 1
Repeat independently for Parent 2
Ensures fit parents but maintains diversity
Crossover Breeding:
For each of 10 genes:
Parent1_Fitness = fitness
Parent2_Fitness = fitness
Weight1 = Parent1_Fitness / (Parent1_Fitness + Parent2_Fitness)
Gene1 = parent1's value
Gene2 = parent2's value
Child_Gene = Weight1 × Gene1 + (1 - Weight1) × Gene2
Fitness-weighted crossover ensures fitter parent contributes more genetic material.
Mutation:
For each gene in child:
IF (random < mutation_rate):
Gene_Range = GENE_MAX - GENE_MIN
Noise = (random - 0.5) × 2 × mutation_strength × Gene_Range
Mutated_Gene = Clamp(Child_Gene + Noise, GENE_MIN, GENE_MAX)
Historical mutation rate: 20% (aggressive exploration)
Live mutation rate: 8% (conservative stability)
Mutation strength: 12% of gene range (configurable 5-25%)
Initialization of New Strategy:
Unique ID assigned (total_spawned counter)
Parent ID recorded
Generation = max(parent generations) + 1
Birth bar recorded (for age tracking)
All performance metrics zeroed
Shadow portfolio reset
WFO validation flag set to false (must prove itself)
Result: New strategy with hybrid DNA enters population, begins trading in next bar.
Competition (Every Bar)
All active strategies:
Calculate their signal based on unique DNA
Check quality gate with their thresholds
Manage shadow positions (entries/exits)
Update performance metrics
Recalculate fitness score
Track WFO validation progress
Strategies compete indirectly through fitness ranking - no direct interaction.
Culling Weak Strategies
Timing (Adaptive):
Historical phase: Every 60 bars (configurable 20-200, should be 2x spawn interval)
Live phase: Every 400 bars (configurable 200-1000, should be 2x spawn interval)
Minimum Adaptation Score (MAS):
Initial MAS = 0.10
MAS decays: MAS × 0.995 every cull cycle
Minimum MAS = 0.03 (floor)
MAS represents the "survival threshold" - strategies below this fitness level are vulnerable.
Culling Conditions (ALL must be true):
Population > minimum population (default: 3, configurable 2-4)
At least one strategy has fitness < MAS
Strategy's age > culling interval (prevents premature culling of new strategies)
Strategy is not in top N elite (default: 2, configurable 1-3)
Culling Process:
Find worst strategy:
For each active strategy:
IF (age > cull_interval):
Fitness = base_fitness
IF (not WFO_validated AND WFO_enabled):
Fitness × 0.7 // 30% penalty for unvalidated
IF (Fitness < MAS AND Fitness < worst_fitness_found):
worst_strategy = this_strategy
worst_fitness = Fitness
IF (worst_strategy found):
Count elite strategies with fitness > worst_fitness
IF (elite_count >= elite_preservation_count):
Deactivate worst_strategy (set active flag = false)
Increment total_culled counter
Elite Protection:
Even if a strategy's fitness falls below MAS, it survives if fewer than N strategies are better. This prevents culling when population is generally weak.
Result: Weak strategies removed from population, freeing slots for new spawns. Gene pool improves over time.
Selection for Display (Every Bar)
AGE chooses one strategy to display signals:
Best fitness = -1
Selected = none
For each active strategy:
Fitness = base_fitness
IF (WFO_validated):
Fitness × 1.3 // 30% bonus for validated strategies
IF (Fitness > best_fitness):
best_fitness = Fitness
selected_strategy = this_strategy
Display selected strategy's signals on chart
Result: Only the highest-fitness (optionally validated-boosted) strategy's signals appear as chart markers. Other strategies trade invisibly in shadow portfolios.
🎨 PREMIUM VISUALIZATION SYSTEM
AGE includes sophisticated visual feedback that standard indicators lack:
1. Gradient Probability Cloud (Optional, Default: ON)
Multi-layer gradient showing signal buildup 2-3 bars before entry:
Activation Conditions:
Signal persistence > 0 (same directional signal held for multiple bars)
Signal probability ≥ minimum threshold (65% by default)
Signal hasn't yet executed (still in "forming" state)
Visual Construction:
7 gradient layers by default (configurable 3-15)
Each layer is a line-fill pair (top line, bottom line, filled between)
Layer spacing: 0.3 to 1.0 × ATR above/below price
Outer layers = faint, inner layers = bright
Color transitions from base to intense based on layer position
Transparency scales with probability (high prob = more opaque)
Color Selection:
Long signals: Gradient from theme.gradient_bull_mid to theme.gradient_bull_strong
Short signals: Gradient from theme.gradient_bear_mid to theme.gradient_bear_strong
Base transparency: 92%, reduces by up to 8% for high-probability setups
Dynamic Behavior:
Cloud grows/shrinks as signal persistence increases/decreases
Redraws every bar while signal is forming
Disappears when signal executes or invalidates
Performance Note: Computationally expensive due to linefill objects. Disable or reduce layers if chart performance degrades.
2. Population Fitness Ribbon (Optional, Default: ON)
Histogram showing fitness distribution across active strategies:
Activation: Only draws on last bar (barstate.islast) to avoid historical clutter
Visual Construction:
10 histogram layers by default (configurable 5-20)
Plots 50 bars back from current bar
Positioned below price at: lowest_low(100) - 1.5×ATR (doesn't interfere with price action)
Each layer represents a fitness threshold (evenly spaced min to max fitness)
Layer Logic:
For layer_num from 0 to ribbon_layers:
Fitness_threshold = min_fitness + (max_fitness - min_fitness) × (layer / layers)
Count strategies with fitness ≥ threshold
Height = ATR × 0.15 × (count / total_active)
Y_position = base_level + ATR × 0.2 × layer
Color = Gradient from weak to strong based on layer position
Line_width = Scaled by height (taller = thicker)
Visual Feedback:
Tall, bright ribbon = healthy population, many fit strategies at high fitness levels
Short, dim ribbon = weak population, few strategies achieving good fitness
Ribbon compression (layers close together) = population converging to similar fitness
Ribbon spread = diverse fitness range, active selection pressure
Use Case: Quick visual health check without opening dashboard. Ribbon growing upward over time = population improving.
3. Confidence Halo (Optional, Default: ON)
Circular polyline around entry signals showing probability strength:
Activation: Draws when new position opens (shadow_position changes from 0 to ±1)
Visual Construction:
20-segment polyline forming approximate circle
Center: Low - 0.5×ATR (long) or High + 0.5×ATR (short)
Radius: 0.3×ATR (low confidence) to 1.0×ATR (elite confidence)
Scales with: (probability - min_probability) / (1.0 - min_probability)
Color Coding:
Elite (85%+): Cyan (theme.conf_elite), large radius, minimal transparency (40%)
Strong (75-85%): Strong green (theme.conf_strong), medium radius, moderate transparency (50%)
Good (65-75%): Good green (theme.conf_good), smaller radius, more transparent (60%)
Moderate (<65%): Moderate green (theme.conf_moderate), tiny radius, very transparent (70%)
Technical Detail:
Uses chart.point array with index-based positioning
5-bar horizontal spread for circular appearance (±5 bars from entry)
Curved=false (Pine Script polyline limitation)
Fill color matches line color but more transparent (88% vs line's transparency)
Purpose: Instant visual probability assessment. No need to check dashboard - halo size/brightness tells the story.
4. Evolution Event Markers (Optional, Default: ON)
Visual indicators of genetic algorithm activity:
Spawn Markers (Diamond, Cyan):
Plots when total_spawned increases on current bar
Location: bottom of chart (location.bottom)
Color: theme.spawn_marker (cyan/bright blue)
Size: tiny
Indicates new strategy just entered population
Cull Markers (X-Cross, Red):
Plots when total_culled increases on current bar
Location: bottom of chart (location.bottom)
Color: theme.cull_marker (red/pink)
Size: tiny
Indicates weak strategy just removed from population
What It Tells You:
Frequent spawning early = population building, active exploration
Frequent culling early = high selection pressure, weak strategies dying fast
Balanced spawn/cull = healthy evolutionary churn
No markers for long periods = stable population (evolution plateaued or optimal genes found)
5. Entry/Exit Markers
Clear visual signals for selected strategy's trades:
Long Entry (Triangle Up, Green):
Plots when selected strategy opens long position (position changes 0 → +1)
Location: below bar (location.belowbar)
Color: theme.long_primary (green/cyan depending on theme)
Transparency: Scales with probability:
Elite (85%+): 0% (fully opaque)
Strong (75-85%): 10%
Good (65-75%): 20%
Acceptable (55-65%): 35%
Size: small
Short Entry (Triangle Down, Red):
Plots when selected strategy opens short position (position changes 0 → -1)
Location: above bar (location.abovebar)
Color: theme.short_primary (red/pink depending on theme)
Transparency: Same scaling as long entries
Size: small
Exit (X-Cross, Orange):
Plots when selected strategy closes position (position changes ±1 → 0)
Location: absolute (at actual exit price if stop/target lines enabled)
Color: theme.exit_color (orange/yellow depending on theme)
Transparency: 0% (fully opaque)
Size: tiny
Result: Clean, probability-scaled markers that don't clutter chart but convey essential information.
6. Stop Loss & Take Profit Lines (Optional, Default: ON)
Visual representation of shadow portfolio risk levels:
Stop Loss Line:
Plots when selected strategy has active position
Level: shadow_stop value from selected strategy
Color: theme.short_primary with 60% transparency (red/pink, subtle)
Width: 2
Style: plot.style_linebr (breaks when no position)
Take Profit Line:
Plots when selected strategy has active position
Level: shadow_target value from selected strategy
Color: theme.long_primary with 60% transparency (green, subtle)
Width: 2
Style: plot.style_linebr (breaks when no position)
Purpose:
Shows where shadow portfolio would exit for stop/target
Helps visualize strategy's risk/reward ratio
Useful for manual traders to set similar levels
Disable for cleaner chart (recommended for presentations)
7. Dynamic Trend EMA
Gradient-colored trend line that visualizes trend strength:
Calculation:
EMA(close, trend_length) - default 50 period (configurable 20-100)
Slope calculated over 10 bars: (current_ema - ema ) / ema × 100
Color Logic:
Trend_direction:
Slope > 0.1% = Bullish (1)
Slope < -0.1% = Bearish (-1)
Otherwise = Neutral (0)
Trend_strength = abs(slope)
Color = Gradient between:
- Neutral color (gray/purple)
- Strong bullish (bright green) if direction = 1
- Strong bearish (bright red) if direction = -1
Gradient factor = trend_strength (0 to 1+ scale)
Visual Behavior:
Faint gray/purple = weak/no trend (choppy conditions)
Light green/red = emerging trend (low strength)
Bright green/red = strong trend (high conviction)
Color intensity = trend strength magnitude
Transparency: 50% (subtle, doesn't overpower price action)
Purpose: Subconscious awareness of trend state without checking dashboard or indicators.
8. Regime Background Tinting (Subtle)
Ultra-low opacity background color indicating detected market regime:
Regime Detection:
Efficiency = directional_movement / total_range (over trend_length bars)
Vol_ratio = current_volatility / average_volatility
IF (efficiency > 0.5 AND vol_ratio < 1.3):
Regime = Trending (1)
ELSE IF (vol_ratio > 1.5):
Regime = Volatile (2)
ELSE:
Regime = Choppy (0)
Background Colors:
Trending: theme.regime_trending (dark green, 92-93% transparency)
Volatile: theme.regime_volatile (dark red, 93% transparency)
Choppy: No tint (normal background)
Purpose:
Subliminal regime awareness
Helps explain why signals are/aren't generating
Trending = ideal conditions for AGE
Volatile = fewer signals, higher thresholds applied
Choppy = mixed signals, lower confidence
Important: Extremely subtle by design. Not meant to be obvious, just subconscious context.
📊 ENHANCED DASHBOARD
Comprehensive real-time metrics in single organized panel (top-right position):
Dashboard Structure (5 columns × 14 rows)
Header Row:
Column 0: "🧬 AGE PRO" + phase indicator (🔴 LIVE or ⏪ HIST)
Column 1: "POPULATION"
Column 2: "PERFORMANCE"
Column 3: "CURRENT SIGNAL"
Column 4: "ACTIVE STRATEGY"
Column 0: Market State
Regime (📈 TREND / 🌊 CHAOS / ➖ CHOP)
DVS Ratio (current volatility scaling factor, format: #.##)
Trend Direction (▲ BULL / ▼ BEAR / ➖ FLAT with color coding)
Trend Strength (0-100 scale, format: #.##)
Column 1: Population Metrics
Active strategies (count / max_population)
Validated strategies (WFO passed / active total)
Current generation number
Total spawned (all-time strategy births)
Total culled (all-time strategy deaths)
Column 2: Aggregate Performance
Total trades across all active strategies
Aggregate win rate (%) - color-coded:
Green (>55%)
Orange (45-55%)
Red (<45%)
Total P&L in R-multiples - color-coded by positive/negative
Best fitness score in population (format: #.###)
MAS - Minimum Adaptation Score (cull threshold, format: #.###)
Column 3: Current Signal Status
Status indicator:
"▲ LONG" (green) if selected strategy in long position
"▼ SHORT" (red) if selected strategy in short position
"⏳ FORMING" (orange) if signal persisting but not yet executed
"○ WAITING" (gray) if no active signal
Confidence percentage (0-100%, format: #.#%)
Quality assessment:
"🔥 ELITE" (cyan) for 85%+ probability
"✓ STRONG" (bright green) for 75-85%
"○ GOOD" (green) for 65-75%
"- LOW" (dim) for <65%
Confluence score (X/3 format)
Signal age:
"X bars" if signal forming
"IN TRADE" if position active
"---" if no signal
Column 4: Selected Strategy Details
Strategy ID number (#X format)
Validation status:
"✓ VAL" (green) if WFO validated
"○ TRAIN" (orange) if still in training/testing phase
Generation number (GX format)
Personal fitness score (format: #.### with color coding)
Trade count
P&L and win rate (format: #.#R (##%) with color coding)
Color Scheme:
Panel background: theme.panel_bg (dark, low opacity)
Panel headers: theme.panel_header (slightly lighter)
Primary text: theme.text_primary (bright, high contrast)
Secondary text: theme.text_secondary (dim, lower contrast)
Positive metrics: theme.metric_positive (green)
Warning metrics: theme.metric_warning (orange)
Negative metrics: theme.metric_negative (red)
Special markers: theme.validated_marker, theme.spawn_marker
Update Frequency: Only on barstate.islast (current bar) to minimize CPU usage
Purpose:
Quick overview of entire system state
No need to check multiple indicators
Trading decisions informed by population health, regime state, and signal quality
Transparency into what AGE is thinking
🔍 DIAGNOSTICS PANEL (Optional, Default: OFF)
Detailed signal quality tracking for optimization and debugging:
Panel Structure (3 columns × 8 rows)
Position: Bottom-right corner (doesn't interfere with main dashboard)
Header Row:
Column 0: "🔍 DIAGNOSTICS"
Column 1: "COUNT"
Column 2: "%"
Metrics Tracked (for selected strategy only):
Total Evaluated:
Every signal that passed initial calculation (direction ≠ 0)
Represents total opportunities considered
✓ Passed:
Signals that passed quality gate and executed
Green color coding
Percentage of evaluated signals
Rejection Breakdown:
⨯ Probability:
Rejected because probability < minimum threshold
Most common rejection reason typically
⨯ Confluence:
Rejected because confluence < minimum required (e.g., only 1 of 3 indicators agreed)
⨯ Trend:
Rejected because signal opposed strong trend
Indicates counter-trend protection working
⨯ Regime:
Rejected because volatile regime detected and probability wasn't high enough to override
Shows regime filter in action
⨯ Volume:
Rejected because volume < 70% of 20-bar average
Indicates volume confirmation requirement
Color Coding:
Passed count: Green (success metric)
Rejection counts: Red (failure metrics)
Percentages: Gray (neutral, informational)
Performance Cost: Slight CPU overhead for tracking counters. Disable when not actively optimizing settings.
How to Use Diagnostics
Scenario 1: Too Few Signals
Evaluated: 200
Passed: 10 (5%)
⨯ Probability: 120 (60%)
⨯ Confluence: 40 (20%)
⨯ Others: 30 (15%)
Diagnosis: Probability threshold too high for this strategy's DNA.
Solution: Lower min probability from 65% to 60%, or allow strategy more time to evolve better DNA.
Scenario 2: Too Many False Signals
Evaluated: 200
Passed: 80 (40%)
Strategy win rate: 45%
Diagnosis: Quality gate too loose, letting low-quality signals through.
Solution: Raise min probability to 70%, or increase min confluence to 3 (all indicators must agree).
Scenario 3: Regime-Specific Issues
⨯ Regime: 90 (45% of rejections)
Diagnosis: Frequent volatile regime detection blocking otherwise good signals.
Solution: Either accept fewer trades during chaos (recommended), or disable regime filter if you want signals regardless of market state.
Optimization Workflow:
Enable diagnostics
Run 200+ bars
Analyze rejection patterns
Adjust settings based on data
Re-run and compare pass rate
Disable diagnostics when satisfied
⚙️ CONFIGURATION GUIDE
🧬 Evolution Engine Settings
Enable AGE Evolution (Default: ON):
ON: Full genetic algorithm (recommended for best results)
OFF: Uses only 4 seed strategies, no spawning/culling (static population for comparison testing)
Max Population (4-12, Default: 8):
Higher = more diversity, more exploration, slower performance
Lower = faster computation, less exploration, risk of premature convergence
Sweet spot: 6-8 for most use cases
4 = minimum for meaningful evolution
12 = maximum before diminishing returns
Min Population (2-4, Default: 3):
Safety floor - system never culls below this count
Prevents population extinction during harsh selection
Should be at least half of max population
Elite Preservation (1-3, Default: 2):
Top N performers completely immune to culling
Ensures best genes always survive
1 = minimal protection, aggressive selection
2 = balanced (recommended)
3 = conservative, slower gene pool turnover
Historical: Spawn Interval (10-100, Default: 30):
Bars between spawning new strategies during historical data
Lower = faster evolution, more exploration
Higher = slower evolution, more evaluation time per strategy
30 bars = ~1-2 hours on 15min chart
Historical: Cull Interval (20-200, Default: 60):
Bars between culling weak strategies during historical data
Should be 2x spawn interval for balanced churn
Lower = aggressive selection pressure
Higher = patient evaluation
Live: Spawn Interval (100-500, Default: 200):
Bars between spawning during live trading
Much slower than historical for stability
Prevents population chaos during live trading
200 bars = ~1.5 trading days on 15min chart
Live: Cull Interval (200-1000, Default: 400):
Bars between culling during live trading
Should be 2x live spawn interval
Conservative removal during live trading
Historical: Mutation Rate (0.05-0.40, Default: 0.20):
Probability each gene mutates during breeding (20% = 2 out of 10 genes on average)
Higher = more exploration, slower convergence
Lower = more exploitation, faster convergence but risk of local optima
20% balances exploration vs exploitation
Live: Mutation Rate (0.02-0.20, Default: 0.08):
Mutation rate during live trading
Much lower for stability (don't want population to suddenly degrade)
8% = mostly inherits parent genes with small tweaks
Mutation Strength (0.05-0.25, Default: 0.12):
How much genes change when mutated (% of gene's total range)
0.05 = tiny nudges (fine-tuning)
0.12 = moderate jumps (recommended)
0.25 = large leaps (aggressive exploration)
Example: If gene range is 0.5-2.0, 12% strength = ±0.18 possible change
📈 Signal Quality Settings
Min Signal Probability (0.55-0.80, Default: 0.65):
Quality gate threshold - signals below this never generate
0.55-0.60 = More signals, accept lower confidence (higher risk)
0.65 = Institutional-grade balance (recommended)
0.70-0.75 = Fewer but higher-quality signals (conservative)
0.80+ = Very selective, very few signals (ultra-conservative)
Min Confluence Score (1-3, Default: 2):
Required indicator agreement before signal generates
1 = Any single indicator can trigger (not recommended - too many false signals)
2 = Requires 2 of 3 indicators agree (RECOMMENDED for balance)
3 = All 3 must agree (very selective, few signals, high quality)
Base Persistence Bars (1-5, Default: 2):
Base bars signal must persist before entry
System adapts automatically:
High probability signals (75%+) enter 1 bar faster
Low probability signals (<68%) need 1 bar more
Trending regime: -1 bar (faster entries)
Volatile regime: +1 bar (more confirmation)
1 = Immediate entry after quality gate (responsive but prone to whipsaw)
2 = Balanced confirmation (recommended)
3-5 = Patient confirmation (slower but more reliable)
Cooldown After Trade (3-20, Default: 8):
Bars to wait after exit before next entry allowed
Prevents overtrading and revenge trading
3 = Minimal cooldown (active trading)
8 = Balanced (recommended)
15-20 = Conservative (position trading)
Entropy Length (10-50, Default: 20):
Lookback period for market order/disorder calculation
Lower = more responsive to regime changes (noisy)
Higher = more stable regime detection (laggy)
20 = works across most timeframes
Momentum Length (5-30, Default: 14):
Period for RSI/ROC calculations
14 = standard (RSI default)
Lower = more signals, less reliable
Higher = fewer signals, more reliable
Structure Length (20-100, Default: 50):
Lookback for support/resistance swing range
20 = short-term swings (day trading)
50 = medium-term structure (recommended)
100 = major structure (position trading)
Trend EMA Length (20-100, Default: 50):
EMA period for trend detection and direction bias
20 = short-term trend (responsive)
50 = medium-term trend (recommended)
100 = long-term trend (position trading)
ATR Period (5-30, Default: 14):
Period for volatility measurement
14 = standard ATR
Lower = more responsive to vol changes
Higher = smoother vol calculation
📊 Volatility Scaling (DVS) Settings
Enable DVS (Default: ON):
Dynamic volatility scaling for adaptive stop/target placement
Highly recommended to leave ON
OFF only for testing fixed-distance stops
DVS Method (Default: Ensemble):
ATR Ratio: Simple, fast, single-method (good for beginners)
Parkinson: High-low range based (good for intraday)
Garman-Klass: OHLC based (sophisticated, considers gaps)
Ensemble: Median of all three (RECOMMENDED - most robust)
DVS Memory (20-200, Default: 100):
Lookback for baseline volatility comparison
20 = very responsive to vol changes (can overreact)
100 = balanced adaptation (recommended)
200 = slow, stable baseline (minimizes false vol signals)
DVS Sensitivity (0.3-1.5, Default: 0.7):
How much volatility affects scaling (power-law exponent)
0.3 = Conservative, heavily dampens vol impact (cube root)
0.5 = Moderate dampening (square root)
0.7 = Balanced response (recommended)
1.0 = Linear, full 1:1 vol response
1.5 = Aggressive, amplified response (exponential)
🔬 Walk-Forward Optimization Settings
Enable WFO (Default: ON):
Out-of-sample validation to prevent overfitting
Highly recommended to leave ON
OFF only for testing or if you want unvalidated strategies
Training Window (100-500, Default: 250):
Bars for in-sample optimization
100 = fast validation, less data (risky)
250 = balanced (recommended) - about 1-2 months on daily, 1-2 weeks on 15min
500 = patient validation, more data (conservative)
Testing Window (30-200, Default: 75):
Bars for out-of-sample validation
Should be ~30% of training window
30 = minimal test (fast validation)
75 = balanced (recommended)
200 = extensive test (very conservative)
Min Trades for Validation (3-15, Default: 5):
Required trades in BOTH training AND testing periods
3 = minimal sample (risky, fast validation)
5 = balanced (recommended)
10+ = conservative (slow validation, high confidence)
WFO Efficiency Threshold (0.3-0.9, Default: 0.55):
Minimum test/train performance ratio required
0.30 = Very loose (test must be 30% as good as training)
0.55 = Balanced (recommended) - test must be 55% as good
0.70+ = Strict (test must closely match training)
Higher = fewer validated strategies, lower risk of overfitting
🎨 Premium Visuals Settings
Visual Theme:
Neon Genesis: Cyberpunk aesthetic (cyan/magenta/purple)
Carbon Fiber: Industrial look (blue/red/gray)
Quantum Blue: Quantum computing (blue/purple/pink)
Aurora: Northern lights (teal/orange/purple)
⚡ Gradient Probability Cloud (Default: ON):
Multi-layer gradient showing signal buildup
Turn OFF if chart lags or for cleaner look
Cloud Gradient Layers (3-15, Default: 7):
More layers = smoother gradient, more CPU intensive
Fewer layers = faster, blockier appearance
🎗️ Population Fitness Ribbon (Default: ON):
Histogram showing fitness distribution
Turn OFF for cleaner chart
Ribbon Layers (5-20, Default: 10):
More layers = finer fitness detail
Fewer layers = simpler histogram
⭕ Signal Confidence Halo (Default: ON):
Circular indicator around entry signals
Size/brightness scales with probability
Minimal performance cost
🔬 Evolution Event Markers (Default: ON):
Diamond (spawn) and X (cull) markers
Shows genetic algorithm activity
Minimal performance cost
🎯 Stop/Target Lines (Default: ON):
Shows shadow portfolio stop/target levels
Turn OFF for cleaner chart (recommended for screenshots/presentations)
📊 Enhanced Dashboard (Default: ON):
Comprehensive metrics panel
Should stay ON unless you want zero overlays
🔍 Diagnostics Panel (Default: OFF):
Detailed signal rejection tracking
Turn ON when optimizing settings
Turn OFF during normal use (slight performance cost)
📈 USAGE WORKFLOW - HOW TO USE THIS INDICATOR
Phase 1: Initial Setup & Learning
Add AGE to your chart
Recommended timeframes: 15min, 30min, 1H (best signal-to-noise ratio)
Works on: 5min (day trading), 4H (swing trading), Daily (position trading)
Load 1000+ bars for sufficient evolution history
Let the population evolve (100+ bars minimum)
First 50 bars: Random exploration, poor results expected
Bars 50-150: Population converging, fitness improving
Bars 150+: Stable performance, validated strategies emerging
Watch the dashboard metrics
Population should grow toward max capacity
Generation number should advance regularly
Validated strategies counter should increase
Best fitness should trend upward toward 0.50-0.70 range
Observe evolution markers
Diamond markers (cyan) = new strategies spawning
X markers (red) = weak strategies being culled
Frequent early activity = healthy evolution
Activity slowing = population stabilizing
Be patient. Evolution takes time. Don't judge performance before 150+ bars.
Phase 2: Signal Observation
Watch signals form
Gradient cloud builds up 2-3 bars before entry
Cloud brightness = probability strength
Cloud thickness = signal persistence
Check signal quality
Look at confidence halo size when entry marker appears
Large bright halo = elite setup (85%+)
Medium halo = strong setup (75-85%)
Small halo = good setup (65-75%)
Verify market conditions
Check trend EMA color (green = uptrend, red = downtrend, gray = choppy)
Check background tint (green = trending, red = volatile, clear = choppy)
Trending background + aligned signal = ideal conditions
Review dashboard signal status
Current Signal column shows:
Status (Long/Short/Forming/Waiting)
Confidence % (actual probability value)
Quality assessment (Elite/Strong/Good)
Confluence score (2/3 or 3/3 preferred)
Only signals meeting ALL quality gates appear on chart. If you're not seeing signals, population is either still learning or market conditions aren't suitable.
Phase 3: Manual Trading Execution
When Long Signal Fires:
Verify confidence level (dashboard or halo size)
Confirm trend alignment (EMA sloping up, green color)
Check regime (preferably trending or choppy, avoid volatile)
Enter long manually on your broker platform
Set stop loss at displayed stop line level (if lines enabled), or use your own risk management
Set take profit at displayed target line level, or trail manually
Monitor position - exit if X marker appears (signal reversal)
When Short Signal Fires:
Same verification process
Confirm downtrend (EMA sloping down, red color)
Enter short manually
Use displayed stop/target levels or your own
AGE tells you WHEN and HOW CONFIDENT. You decide WHETHER and HOW MUCH.
Phase 4: Set Up Alerts (Never Miss a Signal)
Right-click on indicator name in legend
Select "Add Alert"
Choose condition:
"AGE Long" = Long entry signal fired
"AGE Short" = Short entry signal fired
"AGE Exit" = Position reversal/exit signal
Set notification method:
Sound alert (popup on chart)
Email notification
Webhook to phone/trading platform
Mobile app push notification
Name the alert (e.g., "AGE BTCUSD 15min Long")
Save alert
Recommended: Set alerts for both long and short, enable mobile push notifications. You'll get alerted in real-time even if not watching charts.
Phase 5: Monitor Population Health
Weekly Review:
Check dashboard Population column:
Active count should be near max (6-8 of 8)
Validated count should be >50% of active
Generation should be advancing (1-2 per week typical)
Check dashboard Performance column:
Aggregate win rate should be >50% (target: 55-65%)
Total P&L should be positive (may fluctuate)
Best fitness should be >0.50 (target: 0.55-0.70)
MAS should be declining slowly (normal adaptation)
Check Active Strategy column:
Selected strategy should be validated (✓ VAL)
Personal fitness should match best fitness
Trade count should be accumulating
Win rate should be >50%
Warning Signs:
Zero validated strategies after 300+ bars = settings too strict or market unsuitable
Best fitness stuck <0.30 = population struggling, consider parameter adjustment
No spawning/culling for 200+ bars = evolution stalled (may be optimal or need reset)
Aggregate win rate <45% sustained = system not working on this instrument/timeframe
Health Check Pass:
50%+ strategies validated
Best fitness >0.50
Aggregate win rate >52%
Regular spawn/cull activity
Selected strategy validated
Phase 6: Optimization (If Needed)
Enable Diagnostics Panel (bottom-right) for data-driven tuning:
Problem: Too Few Signals
Evaluated: 200
Passed: 8 (4%)
⨯ Probability: 140 (70%)
Solutions:
Lower min probability: 65% → 60% or 55%
Reduce min confluence: 2 → 1
Lower base persistence: 2 → 1
Increase mutation rate temporarily to explore new genes
Check if regime filter is blocking signals (⨯ Regime high?)
Problem: Too Many False Signals
Evaluated: 200
Passed: 90 (45%)
Win rate: 42%
Solutions:
Raise min probability: 65% → 70% or 75%
Increase min confluence: 2 → 3
Raise base persistence: 2 → 3
Enable WFO if disabled (validates strategies before use)
Check if volume filter is being ignored (⨯ Volume low?)
Problem: Counter-Trend Losses
⨯ Trend: 5 (only 5% rejected)
Losses often occur against trend
Solutions:
System should already filter trend opposition
May need stronger trend requirement
Consider only taking signals aligned with higher timeframe trend
Use longer trend EMA (50 → 100)
Problem: Volatile Market Whipsaws
⨯ Regime: 100 (50% rejected by volatile regime)
Still getting stopped out frequently
Solutions:
System is correctly blocking volatile signals
Losses happening because vol filter isn't strict enough
Consider not trading during volatile periods (respect the regime)
Or disable regime filter and accept higher risk
Optimization Workflow:
Enable diagnostics
Run 200+ bars with current settings
Analyze rejection patterns and win rate
Make ONE change at a time (scientific method)
Re-run 200+ bars and compare results
Keep change if improvement, revert if worse
Disable diagnostics when satisfied
Never change multiple parameters at once - you won't know what worked.
Phase 7: Multi-Instrument Deployment
AGE learns independently on each chart:
Recommended Strategy:
Deploy AGE on 3-5 different instruments
Different asset classes ideal (e.g., ES futures, EURUSD, BTCUSD, SPY, Gold)
Each learns optimal strategies for that instrument's personality
Take signals from all 5 charts
Natural diversification reduces overall risk
Why This Works:
When one market is choppy, others may be trending
Different instruments respond to different news/catalysts
Portfolio-level win rate more stable than single-instrument
Evolution explores different parameter spaces on each chart
Setup:
Same settings across all charts (or customize if preferred)
Set alerts for all
Take every validated signal across all instruments
Position size based on total account (don't overleverage any single signal)
⚠️ REALISTIC EXPECTATIONS - CRITICAL READING
What AGE Can Do
✅ Generate probability-weighted signals using genetic algorithms
✅ Evolve strategies in real-time through natural selection
✅ Validate strategies on out-of-sample data (walk-forward optimization)
✅ Adapt to changing market conditions automatically over time
✅ Provide comprehensive metrics on population health and signal quality
✅ Work on any instrument, any timeframe, any broker
✅ Improve over time as weak strategies are culled and fit strategies breed
What AGE Cannot Do
❌ Win every trade (typical win rate: 55-65% at best)
❌ Predict the future with certainty (markets are probabilistic, not deterministic)
❌ Work perfectly from bar 1 (needs 100-150 bars to learn and stabilize)
❌ Guarantee profits under all market conditions
❌ Replace your trading discipline and risk management
❌ Execute trades automatically (this is an indicator, not a strategy)
❌ Prevent all losses (drawdowns are normal and expected)
❌ Adapt instantly to regime changes (re-learning takes 50-100 bars)
Performance Realities
Typical Performance After Evolution Stabilizes (150+ bars):
Win Rate: 55-65% (excellent for trend-following systems)
Profit Factor: 1.5-2.5 (realistic for validated strategies)
Signal Frequency: 5-15 signals per 100 bars (quality over quantity)
Drawdown Periods: 20-40% of time in equity retracement (normal trading reality)
Max Consecutive Losses: 5-8 losses possible even with 60% win rate (probability says this is normal)
Evolution Timeline:
Bars 0-50: Random exploration, learning phase - poor results expected, don't judge yet
Bars 50-150: Population converging, fitness climbing - results improving
Bars 150-300: Stable performance, most strategies validated - consistent results
Bars 300+: Mature population, optimal genes dominant - best results
Market Condition Dependency:
Trending Markets: AGE excels - clear directional moves, high-probability setups
Choppy Markets: AGE struggles - fewer signals generated, lower win rate
Volatile Markets: AGE cautious - higher rejection rate, wider stops, fewer trades
Market Regime Changes:
When market shifts from trending to choppy overnight
Validated strategies can become temporarily invalidated
AGE will adapt through evolution, but not instantly
Expect 50-100 bar re-learning period after major regime shifts
Fitness may temporarily drop then recover
This is NOT a holy grail. It's a sophisticated signal generator that learns and adapts using genetic algorithms. Your success depends on:
Patience during learning periods (don't abandon after 3 losses)
Proper position sizing (risk 0.5-2% per trade, not 10%)
Following signals consistently (cherry-picking defeats statistical edge)
Not abandoning system prematurely (give it 200+ bars minimum)
Understanding probability (60% win rate means 40% of trades WILL lose)
Respecting market conditions (trending = trade more, choppy = trade less)
Managing emotions (AGE is emotionless, you need to be too)
Expected Drawdowns:
Single-strategy max DD: 10-20% of equity (normal)
Portfolio across multiple instruments: 5-15% (diversification helps)
Losing streaks: 3-5 consecutive losses expected periodically
No indicator eliminates risk. AGE manages risk through:
Quality gates (rejecting low-probability signals)
Confluence requirements (multi-indicator confirmation)
Persistence requirements (no knee-jerk reactions)
Regime awareness (reduced trading in chaos)
Walk-forward validation (preventing overfitting)
But it cannot prevent all losses. That's inherent to trading.
🔧 TECHNICAL SPECIFICATIONS
Platform: TradingView Pine Script v5
Indicator Type: Overlay indicator (plots on price chart)
Execution Type: Signals only - no automatic order placement
Computational Load:
Moderate to High (genetic algorithms + shadow portfolios)
8 strategies × shadow portfolio simulation = significant computation
Premium visuals add additional load (gradient cloud, fitness ribbon)
TradingView Resource Limits (Built-in Caps):
Max Bars Back: 500 (sufficient for WFO and evolution)
Max Labels: 100 (plenty for entry/exit markers)
Max Lines: 150 (adequate for stop/target lines)
Max Boxes: 50 (not heavily used)
Max Polylines: 100 (confidence halos)
Recommended Chart Settings:
Timeframe: 15min to 1H (optimal signal/noise balance)
5min: Works but noisier, more signals
4H/Daily: Works but fewer signals
Bars Loaded: 1000+ (ensures sufficient evolution history)
Replay Mode: Excellent for testing without risk
Performance Optimization Tips:
Disable gradient cloud if chart lags (most CPU intensive visual)
Disable fitness ribbon if still laggy
Reduce cloud layers from 7 to 3
Reduce ribbon layers from 10 to 5
Turn off diagnostics panel unless actively tuning
Close other heavy indicators to free resources
Browser/Platform Compatibility:
Works on all modern browsers (Chrome, Firefox, Safari, Edge)
Mobile app supported (full functionality on phone/tablet)
Desktop app supported (best performance)
Web version supported (may be slower on older computers)
Data Requirements:
Real-time or delayed data both work
No special data feeds required
Works with TradingView's standard data
Historical + live data seamlessly integrated
🎓 THEORETICAL FOUNDATIONS
AGE synthesizes advanced concepts from multiple disciplines:
Evolutionary Computation
Genetic Algorithms (Holland, 1975): Population-based optimization through natural selection metaphor
Tournament Selection: Fitness-based parent selection with diversity preservation
Crossover Operators: Fitness-weighted gene recombination from two parents
Mutation Operators: Random gene perturbation for exploration of new parameter space
Elitism: Preservation of top N performers to prevent loss of best solutions
Adaptive Parameters: Different mutation rates for historical vs. live phases
Technical Analysis
Support/Resistance: Price structure within swing ranges
Trend Following: EMA-based directional bias
Momentum Analysis: RSI, ROC, MACD composite indicators
Volatility Analysis: ATR-based risk scaling
Volume Confirmation: Trade activity validation
Information Theory
Shannon Entropy (1948): Quantification of market order vs. disorder
Signal-to-Noise Ratio: Directional information vs. random walk
Information Content: How much "information" a price move contains
Statistics & Probability
Walk-Forward Analysis: Rolling in-sample/out-of-sample optimization
Out-of-Sample Validation: Testing on unseen data to prevent overfitting
Monte Carlo Principles: Shadow portfolio simulation with realistic execution
Expectancy Theory: Win rate × avg win - loss rate × avg loss
Probability Distributions: Signal confidence quantification
Risk Management
ATR-Based Stops: Volatility-normalized risk per trade
Volatility Regime Detection: Market state classification (trending/choppy/volatile)
Drawdown Control: Peak-to-trough equity measurement
R-Multiple Normalization: Performance measurement in risk units
Machine Learning Concepts
Online Learning: Continuous adaptation as new data arrives
Fitness Functions: Multi-objective optimization (win rate + expectancy + drawdown)
Exploration vs. Exploitation: Balance between trying new strategies and using proven ones
Overfitting Prevention: Walk-forward validation as regularization
Novel Contribution:
AGE is the first TradingView indicator to apply genetic algorithms to real-time indicator parameter optimization while maintaining strict anti-overfitting controls through walk-forward validation.
Most "adaptive" indicators simply recalibrate lookback periods or thresholds. AGE evolves entirely new strategies through competitive selection - it's not parameter tuning, it's Darwinian evolution of trading logic itself.
The combination of:
Genetic algorithm population management
Shadow portfolio simulation for realistic fitness evaluation
Walk-forward validation to prevent overfitting
Multi-indicator confluence for signal quality
Dynamic volatility scaling for adaptive risk
...creates a system that genuinely learns and improves over time while avoiding the curse of curve-fitting that plagues most optimization approaches.
🏗️ DEVELOPMENT NOTES
This project represents months of intensive development, facing significant technical challenges:
Challenge 1: Making Genetics Actually Work
Early versions spawned garbage strategies that polluted the gene pool:
Random gene combinations produced nonsensical parameter sets
Weak strategies survived too long, dragging down population
No clear convergence toward optimal solutions
Solution:
Comprehensive fitness scoring (4 factors: win rate, P&L, expectancy, drawdown)
Elite preservation (top 2 always protected)
Walk-forward validation (unproven strategies penalized 30%)
Tournament selection (fitness-weighted breeding)
Adaptive culling (MAS decay creates increasing selection pressure)
Challenge 2: Balancing Evolution Speed vs. Stability
Too fast = population chaos, no convergence. Too slow = can't adapt to regime changes.
Solution:
Dual-phase timing: Fast evolution during historical (30/60 bar intervals), slow during live (200/400 bar intervals)
Adaptive mutation rates: 20% historical, 8% live
Spawn/cull ratio: Always 2:1 to prevent population collapse
Challenge 3: Shadow Portfolio Accuracy
Needed realistic trade simulation without lookahead bias:
Can't peek at future bars for exits
Must track multiple portfolios simultaneously
Stop/target checks must use bar's high/low correctly
Solution:
Entry on close (realistic)
Exit checks on current bar's high/low (realistic)
Independent position tracking per strategy
Cooldown periods to prevent unrealistic rapid re-entry
ATR-normalized P&L (R-multiples) for fair comparison across volatility regimes
Challenge 4: Pine Script Compilation Limits
Hit TradingView's execution limits multiple times:
Too many array operations
Too many variables
Too complex conditional logic
Solution:
Optimized data structures (single DNA array instead of 8 separate arrays)
Minimal visual overlays (only essential plots)
Efficient fitness calculations (vectorized where possible)
Strategic use of barstate.islast to minimize dashboard updates
Challenge 5: Walk-Forward Implementation
Standard WFO is difficult in Pine Script:
Can't easily "roll forward" through historical data
Can't re-optimize strategies mid-stream
Must work in real-time streaming environment
Solution:
Age-based phase detection (first 250 bars = training, next 75 = testing)
Separate metric tracking for train vs. test
Efficiency calculation at fixed interval (after test period completes)
Validation flag persists for strategy lifetime
Challenge 6: Signal Quality Control
Early versions generated too many signals with poor win rates:
Single indicators produced excessive noise
No trend alignment
No regime awareness
Instant entries on single-bar spikes
Solution:
Three-layer confluence system (entropy + momentum + structure)
Minimum 2-of-3 agreement requirement
Trend alignment checks (penalty for counter-trend)
Regime-based probability adjustments
Persistence requirements (signals must hold multiple bars)
Volume confirmation
Quality gate (probability + confluence thresholds)
The Result
A system that:
Truly evolves (not just parameter sweeps)
Truly validates (out-of-sample testing)
Truly adapts (ongoing competition and breeding)
Stays within TradingView's platform constraints
Provides institutional-quality signals
Maintains transparency (full metrics dashboard)
Development time: 3+ months of iterative refinement
Lines of code: ~1500 (highly optimized)
Test instruments: ES, NQ, EURUSD, BTCUSD, SPY, AAPL
Test timeframes: 5min, 15min, 1H, Daily
🎯 FINAL WORDS
The Adaptive Genesis Engine is not just another indicator - it's a living system that learns, adapts, and improves through the same principles that drive biological evolution. Every bar it observes adds to its experience. Every strategy it spawns explores new parameter combinations. Every strategy it culls removes weakness from the gene pool.
This is evolution in action on your charts.
You're not getting a static formula locked in time. You're getting a system that thinks , that competes , that survives through natural selection. The strongest strategies rise to the top. The weakest die. The gene pool improves generation after generation.
AGE doesn't claim to predict the future - it adapts to whatever the future brings. When markets shift from trending to choppy, from calm to volatile, from bullish to bearish - AGE evolves new strategies suited to the new regime.
Use it on any instrument. Any timeframe. Any market condition. AGE will adapt.
This indicator gives you the pure signal intelligence. How you choose to act on it - position sizing, risk management, execution discipline - that's your responsibility. AGE tells you when and how confident . You decide whether and how much .
Trust the process. Respect the evolution. Let Darwin work.
"In markets, as in nature, it is not the strongest strategies that survive, nor the most intelligent - but those most responsive to change."
Taking you to school. — Dskyz, Trade with insight. Trade with anticipation.
— Happy Holiday's

Adaptive SuperTrend - Multi-Method# 📊 Adaptive SuperTrend - Multi-Method with Advanced Analytics
## 🎯 Overview
The **Adaptive SuperTrend - Multi-Method** is a sophisticated trading indicator that enhances the traditional SuperTrend by dynamically adjusting its parameters based on market conditions. Unlike static SuperTrend indicators, this version adapts to volatility changes, providing more reliable signals across different market regimes.
## ✨ Key Features
### 🤖 7 Adaptive Methods
Choose from multiple adaptation strategies or use the powerful Hybrid mode that combines all methods:
1. **Percentile-Based Adaptation**
- Adjusts multiplier based on ATR percentile ranking
- Tightens during extreme volatility, widens during calm periods
- Lookback: 100 bars (customizable)
2. **Volatility Regime Classification**
- Categorizes market into Low/Normal/High volatility regimes
- Applies different multipliers for each regime
- Default: Low=4.0x, Normal=2.5x, High=1.5x
3. **Z-Score Normalization**
- Uses statistical Z-score to normalize ATR
- Adapts to volatility outliers intelligently
- Sensitivity: 0.3 (adjustable)
4. **Dynamic Period Adjustment**
- Blends short and long ATR periods based on volatility
- Responsive in volatile markets, stable in calm markets
- Period range: 7-20 bars
5. **Rate of Change Method**
- Adjusts based on ATR's rate of change
- Detects accelerating/decelerating volatility
- Lookback: 20 bars
6. **Multi-Timeframe Comparison**
- Compares current timeframe ATR with higher timeframe
- Provides macro-context awareness
- Default HTF: Daily
7. **Hybrid Approach** ⭐ RECOMMENDED
- Combines all 6 methods with equal weighting
- Smoothed with EMA for stability
- Best overall performance
### 📈 Professional Statistics Panel
A comprehensive performance tracking panel with ML Fusion-inspired color scheme:
**Features:**
- 💼 **Current Position**: Live LONG/SHORT status with entry price
- 📊 **Total Points**: Cumulative P&L for selected period (default: 60 days)
- 💰 **Current P&L**: Unrealized profit/loss with percentage
- 🟢 **Long Stats**: Separate tracking for long trades
- 🔴 **Short Stats**: Separate tracking for short trades
- 📈 **Averages**: Average points per trade (overall, long, short)
- 📅 **Date Range**: Start and end dates of tracking period
**Customizable Options:**
- Lookback period: 1-365 days (default: 60 days)
- Table position: Top Left/Right, Bottom Left/Right
- Toggle date range display on/off
### 🎨 Visual Features
- **Color-Coded Signals**: Clear buy (green) and sell (red) markers
- **Trend Background**: Subtle background coloring for trend direction
- **SuperTrend Line**: Dynamic color based on current trend
- **Price Fill**: Shaded area between price and SuperTrend
- **Vibrant Colors**: Professional Material Design color palette
### 📊 Information Panel
Real-time display of:
- Active adaptation method
- Current ATR value
- ATR percentile ranking
- Active multiplier vs base multiplier
- Volatility regime (Low/Normal/High)
- ATR Z-Score
- Current trend direction
## 🔧 How to Use
### Quick Start
1. Add indicator to your chart
2. Choose adaptation method (start with "Hybrid")
3. Monitor the statistics panel for performance
4. Use signals for entry/exit points
### Recommended Settings
**For Intraday Trading:**
- Method: Hybrid or Dynamic Period
- Base ATR Period: 10
- Base Multiplier: 2.5-3.0
- P&L Tracking: 30 days
**For Swing Trading:**
- Method: Hybrid or Multi-Timeframe
- Base ATR Period: 14
- Base Multiplier: 3.0-4.0
- P&L Tracking: 90 days
**For Scalping:**
- Method: Rate of Change or Z-Score
- Base ATR Period: 7
- Base Multiplier: 2.0-2.5
- P&L Tracking: 7-14 days
### Signal Interpretation
✅ **BUY Signal**: Triangle up below bar
- Enter long position
- Place stop loss below SuperTrend line
❌ **SELL Signal**: Triangle down above bar
- Exit long / Enter short position
- Place stop loss above SuperTrend line
## ⚙️ Input Parameters
### Basic Settings
- **Base ATR Period**: Default 10 (1-50)
- **Base Multiplier**: Default 3.0 (0.1-10.0)
### Method-Specific Settings
Each of the 7 methods has its own customizable parameters for fine-tuning.
### Display Settings
- **Show Volatility Regime**: Toggle regime display
- **Show ATR Info Panel**: Toggle information panel
- **Show Statistics Panel**: Toggle performance stats
- **Stats Table Position**: Choose corner placement
- **P&L Tracking Period**: 1-365 days (default: 60)
- **Show P&L Date Range**: Toggle date range display
- **Bullish Color**: Customize trend-up color
- **Bearish Color**: Customize trend-down color
## 📊 Statistics Tracking
The indicator automatically tracks:
- **Entry Points**: Recorded on every trend change
- **Exit Points**: Calculated on opposite signal
- **Points Gained/Lost**: Per trade and cumulative
- **Long vs Short Performance**: Separate analytics
- **Trade Count**: Total, long, and short trades
- **Average Performance**: Overall and per direction
- **Time-Based Filtering**: Only shows trades within lookback period
## 🎯 Advantages Over Standard SuperTrend
1. **Adaptive to Market Conditions**: No more whipsaws in ranging markets or missed trends in volatile markets
2. **Multiple Adaptation Strategies**: Choose the method that fits your market and timeframe
3. **Comprehensive Analytics**: Track your performance with detailed statistics
4. **Professional Presentation**: Clean, organized display with Material Design colors
5. **Flexible Configuration**: Highly customizable for any trading style
6. **Real-Time Monitoring**: Live P&L tracking and performance metrics
## 🔔 Alerts
Built-in alert conditions for:
- Buy Signal (trend change to bullish)
- Sell Signal (trend change to bearish)
- Trend Change (any direction change)
Set up TradingView alerts to get notified on your phone or email when signals occur.
## 💡 Pro Tips
1. **Combine with Volume**: Use with volume indicators for confirmation
2. **Multiple Timeframes**: Add on multiple timeframes for confluence
3. **Risk Management**: Always use stop losses at SuperTrend line
4. **Backtest First**: Test on historical data before live trading
5. **Monitor Statistics**: Track your win rate and average gains
6. **Adjust for Market**: Switch methods based on market conditions
7. **Use Hybrid Mode**: When unsure, Hybrid mode provides balanced adaptation
## 📝 Version Notes
**Version 1.0**
- 7 adaptive methods with Hybrid mode
- Professional statistics panel with P&L tracking
- Configurable lookback period (1-365 days)
- Date range display
- Material Design color scheme
- Real-time performance analytics
- Multiple table position options
## ⚠️ Disclaimer
This indicator is for educational and informational purposes only. It should not be considered as financial advice. Always do your own research and consider consulting with a financial advisor before making trading decisions. Past performance does not guarantee future results.
---
**Happy Trading! 🚀📈**
---
## 🏷️ Tags
#SuperTrend #Adaptive #Volatility #TrendFollowing #ATR #Statistics #Analytics #PnL #Trading #Technical #Indicators #MultiMethod #Swing #Intraday #Scalping #RiskManagement

Kinetic Scalper [BULLBYTE]KINETIC SCALPER - ADVANCED MOMENTUM & CONFLUENCE TRADING SYSTEM
A SOPHISTICATED MULTI-FACTOR ANALYSIS INDICATOR FOR PRECISION ENTRIES
The Kinetic Scalper is a comprehensive trading analysis tool that combines volume-weighted momentum calculations, multi-oscillator divergence detection, and a proprietary 15-factor confluence scoring system to identify high-probability reversal setups across all timeframes.
WHAT MAKES THIS INDICATOR ORIGINAL
This is NOT a simple mashup of existing indicators.
The Kinetic Scalper features a completely custom momentum engine called the "Kinetic Pulse" - a volume-weighted momentum oscillator with Fisher Transform normalization that fundamentally differs from standard RSI or other momentum indicators. Every component feeds into a unified algorithmic framework designed specifically for this system.
KEY INNOVATIONS:
KINETIC PULSE ENGINE
Unlike standard RSI which uses simple price changes, the Kinetic Pulse applies:
→ Volume weighting to price movements (high-volume moves carry more weight)
→ EMA smoothing instead of traditional SMA (faster response to changes)
→ Fisher Transform normalization for improved signal clarity
→ Adaptive period adjustment based on current volatility regime
→ Result: A momentum oscillator that responds to conviction, not just price noise
15-FACTOR CONFLUENCE SCORING SYSTEM
Every signal is graded based on the number of confirming factors present:
→ Momentum position (oversold/overbought extremes)
→ Momentum velocity (direction change confirmation)
→ Momentum acceleration (strength of reversal)
→ Multi-oscillator divergence (price vs. 3 oscillators)
→ Volume confirmation (above-average participation)
→ Volume delta analysis (buying vs. selling pressure)
→ Higher timeframe alignment (trend confirmation from larger timeframe)
→ Session timing (major forex session awareness)
→ Structure clearance (clear path to profit targets)
→ Support/resistance proximity (confluence with key levels)
→ Market regime filtering (trending vs. choppy conditions)
Signals are graded A+, A, or B based on how many factors align:
• CONSERVATIVE MODE: A+ requires 12+ factors, A requires 9+, B requires 7+
• BALANCED MODE: A+ requires 10+ factors, A requires 7+, B requires 5+
• AGGRESSIVE MODE: A+ requires 8+ factors, A requires 5+, B requires 3+
TRADE ANALYSIS STATE MACHINE
A sophisticated monitoring system that tracks trade conditions in real-time using:
→ 5-state analysis framework (Factors Aligned / Positive Bias / Mixed Signals / Factors Weakening / Negative Bias)
→ Hysteresis-based transitions (different thresholds to enter vs. exit states)
→ Confidence smoothing with EMA (reduces noise, prevents flip-flopping)
→ Minimum commitment periods before state changes
→ Override logic for significant events (near TP/SL, momentum reversals)
→ Result: Stable, actionable guidance that doesn't change on every bar
INSTRUMENT-AWARE CALIBRATION
Automatically detects what you're trading and applies optimized parameters:
→ Forex Majors: Standard ATR, high session weight
→ Forex Crosses: Tighter stops, moderate session weight
→ Crypto: Wider stops (1.8x multiplier), reduced session weight (24/7 markets)
→ Indices: Moderate-wide stops, high session weight
→ Commodities: Moderate stops, moderate session weight
WHAT THIS INDICATOR DOES
The Kinetic Scalper is designed to identify high-confluence reversal opportunities by analyzing multiple dimensions of market behavior simultaneously.
CORE FUNCTIONS:
1. SIGNAL GENERATION
→ Identifies potential reversal points at oversold/overbought extremes
→ Confirms with multi-oscillator divergence detection
→ Validates with volume, higher timeframe, and structural analysis
→ Filters out low-probability setups automatically
→ Grades signals based on total confluence factors present
2. AUTOMATED TRADE TRACKING
→ Calculates structure-based or ATR-based stop loss levels
→ Projects take profit targets using risk-to-reward ratios
→ Monitors live position status (P/L, distance to targets, R-multiple)
→ Tracks TP1 and TP2 hits automatically
→ Displays outcome markers (TP HIT, PARTIAL WIN, STOPPED)
3. REAL-TIME CONDITION MONITORING
→ Analyzes 6 factor categories during active trades
→ Provides confidence scoring (0-100 scale)
→ Generates actionable guidance based on current market state
→ Alerts when conditions deteriorate or improve
→ Helps with trade management decisions
4. COMPREHENSIVE MARKET ANALYSIS
→ Session detection (Asian, London, New York, Overlap)
→ Volatility regime identification (Low, Normal, High, Extreme)
→ Trend state classification (Trending Up/Down, Ranging, Transitioning)
→ Volume analysis (relative volume and delta approximation)
→ Choppiness filtering (blocks signals in ranging markets)
WHY USE THIS INDICATOR
PROBLEM: Most momentum indicators generate too many false signals at extremes.
SOLUTION: The Kinetic Scalper requires MULTIPLE confirming factors before generating a signal, dramatically reducing noise and focusing on high-confluence setups.
ADVANTAGES:
✓ QUALITY OVER QUANTITY
→ Signal grading ensures you can filter for only the highest-quality setups
→ A+ signals have 10-12+ confirming factors aligned
→ Cooldown periods prevent over-trading the same move
✓ COMPLETE TRADE FRAMEWORK
→ Entry signals with confluence justification
→ Calculated stop loss based on market structure or ATR
→ Two profit targets with clear risk-to-reward ratios
→ Live trade monitoring with factor analysis
→ Outcome tracking and visual markers
✓ ADAPTIVE TO MARKET CONDITIONS
→ Volatility-based period adjustment for momentum calculations
→ Instrument-specific ATR multipliers
→ Session awareness for forex traders
→ Higher timeframe trend filtering
→ Automatic regime detection (trending vs. choppy)
✓ TRANSPARENT METHODOLOGY
→ Every input has detailed tooltips explaining its purpose
→ Signal tooltips show exactly why a signal was generated
→ Dashboard displays all relevant market conditions
→ Factor scores are visible during trades
→ No "black box" mystery calculations
✓ NON-REPAINTING & RELIABLE
→ All signals use barstate.isconfirmed (only on closed bars)
→ Higher timeframe data uses lookahead_off with historical offset
→ No future data access or repainting behavior
→ What you see is what you get - signals don't disappear or move
HOW THE INDICATOR WORKS
SIGNAL GENERATION PROCESS:
STEP 1: MOMENTUM ANALYSIS
The Kinetic Pulse engine calculates volume-weighted momentum:
→ Price changes are weighted by volume ratio vs. 20-bar average
→ High-volume moves have more influence on the oscillator
→ Gains and losses are smoothed using EMA (not SMA like RSI)
→ Fisher Transform is applied for normalization to 0-100 scale
→ Result: Momentum reading that emphasizes conviction, not noise
STEP 2: REVERSAL DETECTION
The indicator looks for potential reversal conditions:
→ Kinetic Pulse reaching oversold zone (below dynamic lower threshold)
→ Momentum velocity turning positive after being negative (for longs)
→ OR bullish divergence detected on multiple oscillators
→ Price making lower lows while oscillators make higher lows = divergence
STEP 3: MULTI-OSCILLATOR DIVERGENCE CONFIRMATION
Divergence is validated across three sources:
→ Kinetic Pulse divergence
→ CCI divergence
→ Stochastic divergence
→ Multiple oscillators confirming divergence increases signal reliability
STEP 4: CONFLUENCE FACTOR SCORING
The system evaluates all 15 possible confirming factors:
→ Momentum position: Is pulse oversold/overbought? (+0 to +2 points)
→ Momentum direction: Is velocity reversing? (+0 to +2 points)
→ Momentum acceleration: Is reversal strengthening? (+0 to +1 point)
→ Divergence count: How many oscillators show divergence? (+0 to +2 points)
→ Volume strength: Is volume above 1.3x average? (+0 to +1 point)
→ Volume delta: Is cumulative delta positive/negative? (+0 to +1 point)
→ HTF alignment: Does higher timeframe support direction? (+0 to +2 points)
→ Session timing: Is it a prime trading session? (+0 to +1 point)
→ Clear air: Is path to targets clear of obstacles? (+0 to +1 point)
→ Structure confluence: Are we near support/resistance? (+0 to +1 point)
→ Market regime: Is market trending, not choppy? (+0 to +1 point)
Total possible score: 15 points
Minimum for signal: 3-12 points depending on sensitivity mode
STEP 5: FILTER VALIDATION
Before generating a signal, additional checks are performed:
→ Volume must be above minimum threshold (if filter enabled)
→ Higher timeframe must not oppose the signal direction (if filter enabled)
→ Target path must be clear of major resistance/support (if filter enabled)
→ Volatility must not be EXTREME (blocks signals in chaos)
→ Risk-to-reward ratio must meet minimum requirement
→ Cooldown period must have elapsed since last signal
STEP 6: SIGNAL GRADING
If all filters pass, the signal is graded based on score:
→ A+ Grade: Highest confluence (8-12+ factors depending on sensitivity)
→ A Grade: High confluence (5-9+ factors)
→ B Grade: Moderate confluence (3-7+ factors)
Only graded signals (A+, A, or B) are displayed.
STEP 7: TRADE LEVEL CALCULATION
Stop loss and targets are calculated automatically:
STOP LOSS METHODS:
• Structure-Based: Uses recent swing low/high with ATR buffer, constrained by min/max ATR limits
• ATR-Based: Pure ATR multiplier with min/max constraints
• Fixed ATR: Simple ATR multiplier, no adjustments
TARGET CALCULATION:
• TP1: Entry ± (Stop Distance × Target 1 R:R)
• TP2: Entry ± (Stop Distance × Target 2 R:R)
• Default: TP1 at 1.0 R:R (1:1), TP2 at 2.0 R:R (1:2)
STEP 8: TRADE MONITORING
Once a signal is taken, the indicator tracks:
→ Current P/L in ticks and R-multiples
→ Distance to each target in ATR units
→ Distance to stop loss in ATR units
→ TP1 hit detection (marks with label, updates lines)
→ TP2 hit detection (closes trade, marks outcome)
→ Stop loss hit detection (closes trade, differentiates partial vs. full loss)
STEP 9: FACTOR ANALYSIS (DURING TRADES)
The Trade Analysis Panel monitors 6 key factor categories:
→ Momentum: Is momentum still aligned with trade direction? (-15 to +15 pts)
→ Position: Current R-multiple position (-12 to +12 pts)
→ Volume: Is volume still supportive? (-6 to +6 pts)
→ HTF Alignment: Does HTF still support trade? (-6 to +8 pts)
→ Target Proximity: How close are we to targets? (0 to +10 pts)
→ Stop Proximity: Are we dangerously close to stop? (-15 to +3 pts)
Raw scores are summed and smoothed using 5-bar EMA to create Confidence Score (0-100).
STEP 10: STATE MACHINE TRANSITIONS
Based on smoothed confidence, the system transitions between 5 states:
→ FACTORS ALIGNED (72+): Everything looks good
→ POSITIVE BIAS (58-72): Conditions favorable
→ MIXED SIGNALS (48-58): Neutral conditions
→ FACTORS WEAKENING (22-48): Concerning signals
→ NEGATIVE BIAS (<22): Poor conditions
Hysteresis prevents rapid flipping between states (different entry/exit thresholds).
RECOMMENDED TIMEFRAMES & INSTRUMENTS
TIMEFRAME VERSATILITY:
Despite the name "Scalper," this indicator works on ALL timeframes:
✓ LOWER TIMEFRAMES (1m - 15m)
→ Ideal for: Scalping and very short-term trades
→ Expect: More signals, faster trades, requires active monitoring
→ Best for: Forex majors, liquid crypto pairs
→ Tip: Use Conservative sensitivity to reduce noise
✓ MID TIMEFRAMES (15m - 1H)
→ Ideal for: Intraday trading and day trading
→ Expect: Moderate signal frequency, 1-4 hour trade duration
→ Best for: Forex, indices, major crypto
→ Tip: Balanced sensitivity works well here
✓ HIGHER TIMEFRAMES (4H - Daily)
→ Ideal for: Swing trading and position trading
→ Expect: Fewer signals, higher-quality setups, multi-day trades
→ Best for: All instruments
→ Tip: Can use Aggressive sensitivity for more opportunities
INSTRUMENT COMPATIBILITY:
✓ FOREX MAJORS (EUR/USD, GBP/USD, USD/JPY, etc.)
→ Auto-detected or manually select "Forex Major"
→ Session filtering is highly valuable here
→ London/NY overlap generates best signals
✓ FOREX CROSSES (EUR/GBP, AUD/NZD, etc.)
→ Auto-detected or manually select "Forex Cross"
→ Slightly tighter stops applied automatically
→ Session weight reduced vs. majors
✓ CRYPTOCURRENCIES (BTC, ETH, SOL, etc.)
→ Auto-detected or manually select "Crypto"
→ Wider stops (1.8x multiplier) due to volatility
→ Session filtering less relevant (24/7 markets)
→ Works well on both spot and perpetual futures
✓ INDICES (S&P 500, NASDAQ, DAX, etc.)
→ Auto-detected or manually select "Index"
→ Session opens (NY, London) are important
→ Moderate stop widths applied
✓ COMMODITIES (Gold, Silver, Oil, etc.)
→ Auto-detected or manually select "Commodity"
→ Moderate stops and session awareness
→ Works well on both spot and futures
VISUAL ELEMENTS EXPLAINED
SIGNAL MARKERS:
The indicator offers 3 display styles (choose in settings):
• PREMIUM STYLE (Default)
→ Signal appears below/above candles with connecting line
→ Background panel with grade badge (LONG , SHORT , etc.)
→ Entry price displayed
→ Direction arrow pointing to entry candle
→ Most informative, best for detailed analysis
• MINIMAL STYLE
→ Simple dot marker with grade text next to it
→ Clean, unobtrusive design
→ Best for mobile devices or cluttered charts
→ Less visual noise
• CLASSIC STYLE
→ Diamond marker with grade badge below/above
→ Traditional indicator aesthetic
→ Good balance between info and simplicity
ALL STYLES INCLUDE:
→ Signal tooltips with complete trade plan details
→ Grade display (A+, A, or B)
→ Color coding (bright colors for A+, standard for A/B)
SIGNAL TOOLTIP CONTENTS:
When you hover over any signal marker, you'll see:
→ Signal direction and grade
→ Confluence score (actual points vs. required)
→ Reason for signal (divergence type, reversal pattern)
→ Complete trade plan (Entry, Stop, TP1, TP2)
→ Risk in ticks
→ Risk-to-reward ratios
→ Market conditions at signal (Pulse value, HTF status, Volume, Session)
TRADE LEVEL LINES:
When Trade Tracking is enabled:
• ENTRY LINE (Yellow/Gold)
→ Solid horizontal line at entry price
→ Shaded zone around entry (±ATR buffer)
→ Label showing entry price
→ Extends 20-25 bars into future
• STOP LOSS LINE (Orange/Red)
→ Dashed line at stop level
→ Label showing stop price and distance in ticks
→ Turns dotted and changes color after TP1 hit (breakeven implied)
→ Deleted when trade closes
• TAKE PROFIT 1 LINE (Blue)
→ Dotted line at TP1 level
→ Label showing price and R:R ratio (e.g., "1:1.0")
→ Turns solid and changes to green when hit
→ Deleted after TP1 hit
• TAKE PROFIT 2 LINE (Blue)
→ Solid line at TP2 level
→ Label showing price and R:R ratio (e.g., "1:2.0")
→ This is the "full win" target
→ Deleted when trade closes
OUTCOME MARKERS:
When trade milestones are reached:
• - Green label appears when first target is touched
• - Green label when second target is touched (trade complete)
• - Red label if stop loss hit before any target
• - Orange label if TP1 hit but then stopped out
PREVIOUS DAY LEVELS:
If enabled (Show Previous Day Levels):
• PDH (Previous Day High) - Solid red/orange line
→ Label shows "PDH: "
→ Useful resistance reference for intraday trading
• PDL (Previous Day Low) - Solid green line
→ Label shows "PDL: "
→ Useful support reference for intraday trading
BACKGROUND TINTS:
Subtle background colors indicate states:
→ Light green tint: Active long position being tracked
→ Light red tint: Active short position being tracked
→ Light orange tint: Extreme volatility warning (signals blocked)
DASHBOARD GUIDE
The indicator features TWO dashboard panels:
━━━━━━━━━━━━━━━━━━━━━━━━━━━━━━━━━━━━━━━━━━━━━━━━━━━━━━━━━━━━━━━━━━━━━━━━━━━━━
MAIN DASHBOARD (Top Right by default)
━━━━━━━━━━━━━━━━━━━━━━━━━━━━━━━━━━━━━━━━━━━━━━━━━━━━━━━━━━━━━━━━━━━━━━━━━━━━━
WHEN NO TRADE IS ACTIVE:
→ Bias: Current market bias (BULLISH, BEARISH, NEUTRAL, LEAN LONG/SHORT)
→ Based on Kinetic Pulse position and velocity
→ Helps you understand overall momentum direction
→ Pulse: Current Kinetic Pulse value (0-100 scale)
→ <30 = Oversold (potential long setups developing)
→ >70 = Overbought (potential short setups developing)
→ 40-60 = Neutral zone
→ Volatility: Current volatility regime (LOW, NORMAL, HIGH, EXTREME)
→ Calculated from ATR ratio vs. 100-period average
→ EXTREME volatility blocks all signals (too chaotic)
→ Trend: Market state classification
→ TREND UP / TREND DOWN: ADX > 25, directional movement clear
→ RANGING: ADX < 20, choppy conditions
→ TRANSITIONING: ADX 20-25, developing conditions
→ VOLATILE: Extreme ATR regime
→ Session: Current forex session
→ ASIAN (00:00-08:00 UTC)
→ LONDON (07:00-16:00 UTC)
→ NEW YORK (13:00-22:00 UTC)
→ LDN/NY (13:00-16:00 UTC) - Overlap period, highest volatility
→ OFF-HOURS: Outside major sessions
→ Volume: Current volume vs. 20-bar average
→ Displayed as multiplier (e.g., "1.45x" = 45% above average)
→ Green if >1.3x (high volume, bullish for signal quality)
→ Red if <0.8x (low volume, bearish for signal quality)
→ HTF: Higher timeframe analysis status
→ BULLISH: HTF momentum supports longs
→ BEARISH: HTF momentum supports shorts
→ NEUTRAL: No clear HTF direction
→ Best Score: Highest confluence score currently available
→ Shows both long and short scores
→ Format: " / "
→ Example: "8/7 " means long score is 8, threshold is 7, long is leading
→ Helps you anticipate which direction might signal next
→ PDH/PDL: Previous day high and low prices
→ Quick reference for intraday support/resistance
WHEN TRADE IS ACTIVE:
→ Trade: Direction and grade (e.g., "LONG ")
→ Entry: Entry price of current trade
→ P/L: Current profit/loss
→ Shown in ticks and R-multiples
→ Format: "+45 | +0.75R" or "-20 | -0.35R"
→ Green when positive, red when negative
→ TP1: First target status
→ Shows price and distance if not hit
→ Shows "HIT" in green if reached
→ TP2: Second target price and distance
→ Stop: Stop loss price and current distance from stop
→ Bars: Number of bars since entry (trade duration)
━━━━━━━━━━━━━━━━━━━━━━━━━━━━━━━━━━━━━━━━━━━━━━━━━━━━━━━━━━━━━━━━━━━━━━━━━━━━━
TRADE ANALYSIS PANEL (Bottom Left by default)
━━━━━━━━━━━━━━━━━━━━━━━━━━━━━━━━━━━━━━━━━━━━━━━━━━━━━━━━━━━━━━━━━━━━━━━━━━━━━
This panel provides algorithmic analysis of market conditions. It does NOT provide investment advice or recommendations.
WHEN NO TRADE IS ACTIVE:
Shows scanning status and signal readiness:
→ Long/Short Readiness Gauges
→ Visual bar showing proximity to signal threshold
→ Score display (e.g., "8/7" means 8 points scored, 7 needed)
→ "RDY" indicator when threshold reached
→ Status Messages
→ "Scanning for setups..." - Normal scanning mode
→ "Long setup ready - cooldown: X bars" - Signal qualified but in cooldown
→ "Oversold conditions - watch for reversal" - Setup developing
→ "Choppy conditions detected" - Warning about market state
→ "Extreme volatility - signals blocked" - Safety filter active
WHEN TRADE IS ACTIVE:
Header shows current analysis state:
→ FACTORS ALIGNED (Green) - Everything looks good, confidence 72+
→ POSITIVE BIAS (Light Green) - Conditions favorable, confidence 58-72
→ MIXED SIGNALS (Blue) - Neutral conditions, confidence 48-58
→ FACTORS WEAKENING (Orange) - Concerning signals, confidence 22-48
→ NEGATIVE BIAS (Red) - Poor conditions, confidence <22
Confidence Score:
→ Displayed as percentage (0-100%)
→ Visual gauge (|||||.....)
→ Trend indicator (Rising, Falling, Stable)
→ Shows momentum of confidence change
Factor Breakdown (if enabled):
Shows 6 factor categories with individual scores:
→ Momentum: Is momentum aligned with trade? (-15 to +15 points)
→ Positive if velocity matches trade direction
→ Negative if momentum opposes trade
→ Position: Current R-multiple analysis (-12 to +12 points)
→ Positive if trade is in profit
→ Negative if underwater
→ Score increases as profit grows
→ Volume: Is volume supportive? (-6 to +6 points)
→ Positive if volume above average
→ Negative if volume weak
→ HTF Align: Higher timeframe status (-6 to +8 points)
→ Positive if HTF still supports trade direction
→ Negative if HTF turned against trade
→ Target: Proximity to profit targets (0 to +10 points)
→ Higher score when approaching targets
→ Bonus if TP1 already hit and near TP2
→ Stop Dist: Distance from stop loss (-15 to +3 points)
→ Negative if dangerously close to stop (<0.3 ATR)
→ Positive if well away from stop (>1.5 ATR)
Each factor shows:
• Score value with +/- indicator
• Trend symbol: + (improving), - (deteriorating), = (stable)
• Visual gauge
Guidance Messages:
→ "TARGET 2 APPROACHING" - TP2 within 0.3 ATR
→ "TARGET 1 APPROACHING" - TP1 within 0.3 ATR
→ "STOP PROXIMITY WARNING" - Stop within 0.3 ATR
→ "Factors aligned - Holding" - Positive state, stay in trade
→ "Conditions favorable" - Still looking good
→ "Conditions mixed - " - Neutral assessment
→ "Factors deteriorating" - Warning of weakening setup
→ "Confluence weakening - secure gains" - Consider exit if profitable
COMPACT MODE (Mobile-Friendly):
→ Reduces panel size by showing only essential info
→ Factor icons instead of full breakdowns
→ Simplified guidance messages
→ Perfect for smaller screens
SETTINGS GUIDE
MASTER SETTINGS:
Instrument Type
→ Purpose: Optimizes ATR multipliers and session weights for your asset
→ Options: Auto-Detect (recommended), Forex Major, Forex Cross, Crypto, Index, Commodity
→ Default: Auto-Detect
→ When to change: If auto-detection is incorrect for your symbol
Signal Sensitivity
→ Purpose: Controls how many factors required before generating signals
→ Options:
• Conservative: Requires 12+ for A+, 9+ for A, 7+ for B (fewer, highest quality)
• Balanced: Requires 10+ for A+, 7+ for A, 5+ for B (recommended)
• Aggressive: Requires 8+ for A+, 5+ for A, 3+ for B (more frequent)
→ Default: Balanced
→ When to change: If you want fewer signals (Conservative) or more opportunities (Aggressive)
Enable Trade Signals
→ Purpose: Master on/off switch for signal generation
→ Default: ON
→ When to disable: If you only want to use the analysis dashboards without signals
Enable Trade Tracking
→ Purpose: Tracks active trades and monitors conditions until TP/SL hit
→ Default: ON
→ When to disable: If you manage trades manually and don't want automatic tracking
Show Entry/Stop/Target Levels
→ Purpose: Displays trade plan lines and labels on chart
→ Default: ON
→ When to disable: If you prefer clean charts or manage levels yourself
DISPLAY SETTINGS:
Color Theme
→ Purpose: Optimizes colors for your chart background
→ Options: Dark (for dark charts), Light (for light charts)
→ Default: Dark
Signal Display Style
→ Purpose: Visual style of signal markers
→ Options:
• Premium: Badge with line and background panel (most detailed)
• Minimal: Simple dot with grade text (cleanest)
• Classic: Diamond marker with badge (traditional)
→ Default: Premium
Signal Distance
→ Purpose: How far signal labels appear from price bars (in ATR units)
→ Range: 0.5 to 10.0
→ Default: 2.0
→ When to adjust: Increase to 3.0-4.0 if signals hide behind candle wicks
TP/SL Label Distance
→ Purpose: Spacing of price labels to prevent overlap
→ Range: 0.5 to 5.0
→ Default: 1.5
Show Previous Day Levels
→ Purpose: Display PDH/PDL reference lines
→ Default: ON
→ Best for: Intraday traders who respect previous day levels
MAIN DASHBOARD:
Show Main Dashboard
→ Purpose: Toggle visibility of market conditions table
→ Default: ON
Main Dashboard Position
→ Options: Top Right, Top Left, Bottom Right, Bottom Left
→ Default: Top Right
→ When to change: To avoid overlap with TradingView's built-in panels
TRADE ANALYSIS PANEL:
Show Trade Analysis Panel
→ Purpose: Toggle factor analysis dashboard
→ Default: ON
Analysis Panel Position
→ Options: Top Right, Top Left, Bottom Right, Bottom Left, Middle Right, Middle Left
→ Default: Bottom Left
→ Recommended: Bottom Right or Middle Right to avoid overlap with Main Dashboard
Compact Mode
→ Purpose: Reduces panel size for mobile or smaller screens
→ Default: OFF
→ When to enable: Mobile trading, small screens, or minimalist preference
Show Factor Details
→ Purpose: Displays individual factor scores vs. overall confidence only
→ Default: ON
→ When to disable: For more compact view showing only state and confidence
RISK MANAGEMENT:
Stop Loss Method
→ Purpose: How stop loss distance is calculated
→ Options:
• Structure-Based: Uses swing highs/lows with ATR buffer (recommended)
• ATR-Based: Pure ATR multiplier with min/max constraints
• Fixed ATR: Simple multiplier, no adjustments
→ Default: Structure-Based
→ Impact: Structure-Based respects market geometry but constrains within safe limits
ATR Stop Multiplier
→ Purpose: Multiplier for ATR-based stop calculation
→ Range: 0.5 to 3.0
→ Default: 1.5
→ When to adjust:
• Increase to 2.0-2.5 for more breathing room (fewer false stops)
• Decrease to 1.0-1.2 for tighter stops (but more stop-outs)
Maximum Stop Distance (ATR)
→ Purpose: Cap on stop width to prevent excessive risk
→ Range: 1.0 to 5.0
→ Default: 2.5
→ Impact: If structure-based stop exceeds this, ATR-based stop is used instead
Minimum Stop Distance (ATR)
→ Purpose: Floor on stop width to avoid noise-induced stops
→ Range: 0.2 to 1.0
→ Default: 0.5
→ Impact: Prevents stops too tight to survive normal volatility
Target 1 Risk/Reward Ratio
→ Purpose: R:R for first profit target
→ Range: 0.5 to 2.0
→ Default: 1.0 (1:1 ratio)
→ Common values: 1.0 for quick profit taking, 1.5 for patient trading
Target 2 Risk/Reward Ratio
→ Purpose: R:R for second profit target (full win)
→ Range: 1.0 to 4.0
→ Default: 2.0 (1:2 ratio)
→ Common values: 2.0-3.0 for balanced risk/reward
Minimum R:R Required
→ Purpose: Filters out signals with poor risk/reward
→ Range: 0.5 to 2.0
→ Default: 1.0
→ Impact: Signals where potential reward doesn't meet this ratio are rejected
→ WARNING: Always ensure your position sizing means a stop loss = no more than 1-2% of your account, regardless of R:R ratio
SIGNAL FILTERS:
Session Awareness
→ Purpose: Weights signals higher during major forex sessions
→ Default: ON
→ Impact: Doesn't block signals, but session quality factors into scoring
→ Best for: Forex traders
Session Timezone
→ Purpose: Timezone for session calculations
→ Options: UTC, America/New_York, Europe/London, Asia/Tokyo, Asia/Hong_Kong
→ Default: UTC
→ When to change: Match your broker's server time
Higher Timeframe Alignment
→ Purpose: Checks HTF momentum before generating signals
→ Default: ON
→ Impact: Filters counter-trend signals, improves quality
→ Recommended: Keep enabled
HTF Timeframe
→ Purpose: Which higher timeframe to check
→ Default: Auto (blank field)
→ Auto selection:
• 1m chart → 5m HTF
• 5m chart → 15m HTF
• 15m chart → 1H HTF
• 1H chart → 4H HTF
• 4H+ chart → Daily HTF
→ Manual override: Enter any timeframe (e.g., "60" for 1-hour)
Volume Confirmation
→ Purpose: Requires above-average volume for signals
→ Default: ON
→ Impact: Filters low-liquidity false signals
→ Recommended: Keep enabled
Minimum Volume Ratio
→ Purpose: Volume threshold vs. 20-bar average
→ Range: 0.3 to 2.0
→ Default: 0.8 (80% of average)
→ When to adjust:
• Increase to 1.2-1.5 for only high-volume signals
• Decrease to 0.5-0.7 for more permissive filtering
Structure Clearance Check
→ Purpose: Ensures clear path to targets (no nearby resistance/support)
→ Default: ON
→ Impact: Prevents trades with immediate obstacles
→ Recommended: Keep enabled
Minimum Bars Between Signals
→ Purpose: Cooldown period after each signal
→ Range: 1 to 10
→ Default: 3
→ Impact: After a signal, this many bars must pass before another in same direction
→ When to adjust:
• Increase to 5-7 to prevent over-trading
• Decrease to 1-2 for faster re-entries
ADVANCED TUNING:
Momentum Period
→ Purpose: Base period for Kinetic Pulse calculation
→ Range: 5 to 30
→ Default: 14
→ When to adjust:
• Lower (8-10): More responsive, noisier
• Higher (18-21): Smoother, slower to react
→ Note: If Adaptive Period enabled, this is adjusted automatically
Adaptive Period
→ Purpose: Auto-adjusts momentum period based on volatility
→ Default: ON
→ Impact: Shortens period in high volatility, lengthens in low volatility
→ Recommended: Keep enabled for automatic optimization
Divergence Lookback
→ Purpose: How far back to search for divergence patterns
→ Range: 10 to 60
→ Default: 30
→ When to adjust:
• Shorter (15-20): Only recent divergences
• Longer (40-50): Catches older divergences (may be less relevant)
Swing Detection Bars
→ Purpose: Bars required on each side to confirm swing high/low
→ Range: 2 to 7
→ Default: 3
→ Impact on stops:
• Lower (2-3): More swing points, potentially tighter stops
• Higher (5-7): Only major swings, wider stops
Choppiness Index Threshold
→ Purpose: Threshold above which market considered choppy
→ Range: 38.2 to 80.0
→ Default: 61.8
→ Impact:
• Lower (50-55): Stricter quality filter (fewer signals in ranging markets)
• Higher (65-70): More permissive (allows signals in choppier conditions)
HOW TO READ SIGNALS
SIGNAL ANATOMY:
When a signal appears, you'll see:
1. DIRECTIONAL MARKER
→ Arrow, dot, or diamond pointing to entry candle (depends on style)
→ Positioned below price for LONG, above price for SHORT
→ Connected to price with line (Premium style)
2. GRADE BADGE
→ Displays signal quality: LONG , SHORT , etc.
→ Color coding:
• Bright green/cyan for A+ longs
• Standard green for A/B longs
• Bright pink/magenta for A+ shorts
• Standard red for A/B shorts
3. ENTRY PRICE (Premium style only)
→ Shows exact entry price at signal generation
4. TOOLTIP (all styles)
→ Hover over signal to see complete trade plan
→ Includes: Entry, Stop, TP1, TP2, Risk, R:R ratios, market conditions, signal reason, confluence score
INTERPRETING GRADES:
→ A+ SIGNALS (Highest Quality)
• 8-12+ confirming factors aligned
• Multiple divergences OR strong momentum reversal
• HTF alignment + volume + session timing + clear structure
• These are your highest-probability setups
• Recommended action: Give these priority, consider larger position size
→ A SIGNALS (High Quality)
• 5-9+ confirming factors aligned
• Good confluence, most key factors present
• Missing 1-2 optimal conditions
• These are still quality trades
• Recommended action: Standard position size, solid setups
→ B SIGNALS (Moderate Quality)
• 3-7+ confirming factors aligned
• Minimum viable confluence
• May be missing HTF alignment, volume, or session timing
• Higher variance outcomes
• Recommended action: Smaller position size or skip if conservative
SIGNAL NARRATIVE:
Each signal tooltip includes a narrative explaining WHY it was generated:
→ "Multi-divergence at oversold extreme"
• Multiple oscillators showing bullish divergence
• Kinetic Pulse in oversold zone
• High-quality reversal setup
→ "Bullish divergence near support"
• Divergence detected
• Price near key support level (swing low or PDL)
• Structure confluence
→ "Momentum reversal with HTF alignment"
• Kinetic Pulse velocity reversing
• Higher timeframe supports direction
• Strong trend-following setup
→ "Oversold momentum reversal"
• Extreme Kinetic Pulse reading reversing
• May not have divergence but strong momentum shift
READING THE TRADE PLAN:
Every signal comes with a complete trade plan:
→ ENTRY: The close price of the signal candle
• This is where the signal triggered
• If using limit orders, you might improve on this price
→ STOP: Calculated stop loss level
• Based on your Stop Loss Method setting
• Distance shown in ticks
• Risk tolerance: Ensure this represents ≤1-2% of your account
→ TP1: First profit target
• Default: 1:1 risk-reward
• This is your partial profit or first exit
• Consider taking 50% off at TP1
→ TP2: Second profit target
• Default: 1:2 risk-reward
• This is your "full win" target
• Hold remaining position for this level
SIGNAL FREQUENCY EXPECTATIONS:
Frequency varies by timeframe, sensitivity, and market conditions:
→ AGGRESSIVE MODE
• Lower timeframes (1m-5m): 5-15 signals per day
• Mid timeframes (15m-1H): 2-5 signals per day
• Higher timeframes (4H-D): 1-3 signals per week
→ BALANCED MODE (Default)
• Lower timeframes: 3-8 signals per day
• Mid timeframes: 1-3 signals per day
• Higher timeframes: 2-5 signals per week
→ CONSERVATIVE MODE
• Lower timeframes: 1-4 signals per day
• Mid timeframes: 0-2 signals per day
• Higher timeframes: 1-3 signals per week
Note: Frequency also depends on market volatility and trending vs. ranging conditions.
Example - Kinetic Scalper Trade Sequence
Here's an example showing the complete trade lifecycle with all dashboard transitions, annotations, and descriptions.
INSTRUMENT & TIMEFRAME DETAILS
Symbol: Nifty 50 Index (NSE)
Date: December 15, 2025
Session: London session (active trading hours)
Instrument Type: Index (auto-detected)
TRADE SEQUENCE BREAKDOWN
SCREENSHOT 1: Pre-Signal Setup Building (Image 1)
Time: ~12:00-14:30 UTC+5:30(approx.)
Price Action: Uptrend showing signs of exhaustion near 26,200
Market State: Price at session highs
Main Dashboard (Top Right):
- Bias: LEAN SHORT
- Pulse: 58.9 (approaching overbought)
- Volatility: NORMAL
- Trend: TRANSITIONING
- Session: LONDON (favorable timing)
- Volume: 0.98x (slightly below average)
- HTF: BULLISH (caution for counter-trend)
- Best Score: 9/5 (Short score building)
- PDH/PDL: 26098.25 / 25938.95
Trade Analysis Panel (Bottom Left):
- Status: NO ACTIVE TRADE
- Long Score: 5/5 (RDY)
- Short Score: 9/5 (RDY)
- Panel Message: "Short pattern developing - score: 9"
Description :
Setup Development Phase: The indicator identifies a potential short opportunity as price reaches the previous day's high. The short confluence score has climbed to 9/15 points, meeting the 'Balanced' sensitivity threshold for a Grade B signal. Notice the 'LEAN SHORT' bias and the Kinetic Pulse reading of 58.9 approaching overbought territory. The Trade Analysis panel shows 'Short pattern developing' with 9/5 factors aligned. Key factors: momentum approaching reversal zone, price at resistance (PDH), and London session providing favorable conditions.
SCREENSHOT 2: Signal Generated & Trade Entered (Image 2)
Time: ~13:00 UTC+5:30 (signal bar)
Entry Price: 26,184.65
Signal Grade: Grade
Main Dashboard (Top Right):
- Trade: SHORT
- Entry: 26184.65
- P/L: 5.95 pts | +0.2R (early positive movement)
- TP1: 26157.00 (33.2 pts away)
- TP2: 26129.35 (60.84 pts away)
- Stop: 26212.30 (22.1 pts away)
- Bars: 1 (just entered)
Trade Analysis Panel (Bottom Left):
- Header: TRADE ANALYSIS
- Status Bar: "Conditions mixed - improving 57%"
- Confidence: 57% RISING
- Factor Breakdown:
- Momentum: -4 (velocity not yet aligned)
- Position: +4 (slight profit)
- Volume: +2 = (volume present)
- HTF Align: +2 = (not strongly aligned)
- Target: +0 - (far from TP)
- Stop Dist: +3 - (good distance)
- Bottom Status: "Conditions mixed - Monitoring"
- Disclaimer: "Analysis only - Not financial advice"
Description:
Signal Activation: A Grade A short signal triggers at 26,184.65 after the short confluence score reached qualifying levels. The indicator places a structure-based stop loss at 26,212.30 (27.65 points risk) with dual targets at 1:1 and 1:2 risk-reward ratios.
The Trade Analysis Panel immediately begins monitoring with an initial confidence score of 57% - classified as 'MIXED SIGNALS' but showing a 'RISING' trend. Factor analysis reveals: momentum not yet aligned (-4 points as price just reversed), position slightly favorable (+4 points already +0.2R), volume adequate (+2), HTF showing weak alignment (+2 as we're counter-trend), stop well-placed (+3), but targets still distant (0 points).
Notice how the Main Dashboard switches from market scanning mode to active trade tracking, now displaying entry price, live P/L in both points (5.95 pts) and R-multiples (+0.2R), and distances to all key levels. The analysis panel provides real-time factor scoring to help monitor trade health.
SCREENSHOT 3: TP1 Hit - Trade Performing Well (Image 3)
Time: ~14:20 UTC+5:30(approx)
Price: ~26,154 (TP1 zone)
Bars in Trade: 29
Main Dashboard (Top Right):
- Trade: SHORT
- Entry: 26184.65
- P/L: 30.85 pts | +1.12R (excellent progress)
- TP1: HIT (displayed in green)
- TP2: 26129.35 (24.44 pts away)
- Stop: 26212.30 (58.5 pts away - well protected)
- Bars: 29
Trade Analysis Panel (Bottom Left):
- Header: TRADE ANALYSIS
- Status Bar: "Multiple factors positive"
- Confidence: 78% RISING
- Factor Breakdown:
- Momentum: +8 = (ALIGNED)
- Position: +8 + (strong profit zone)
- Volume: +2 + (continued support)
- HTF Align: +8 = (now strongly aligned)
- Target: +10 + (TP1 achieved, approaching TP2)
- Stop Dist: +3 + (excellent cushion)
- Bottom Status: "Multiple factors positive"
- Visual State: Green background (FACTORS ALIGNED state)
Description:
Trade Execution Phase - First Target Achieved: After 29 bars , price reaches the first take-profit target at 26,157.00. The ' ' marker confirms partial profit taking. Current P/L shows +30.85 points (+1.12R), exceeding the initial 1:1 risk-reward.
The Trade Analysis Panel shows dramatic improvement - confidence has surged to 78% (FACTORS ALIGNED state) with most factors now positive:
- Momentum factor improved to +8 (velocity aligned with trade direction)
- Position factor at +8 (over +1R profit zone)
- HTF Align jumped to +8 (higher timeframe now confirming the move)
- Target factor maxed at +10 (TP1 achieved, TP2 within reach)
- Stop Distance at +3 (58.5 points cushion providing safety)
Notice the panel status displays 'Multiple factors positive' with a green-tinted background, indicating optimal trade conditions. The confidence trend shows 'RISING' suggesting continued momentum. With TP1 secured and only 24.44 points to TP2, the trade is well-positioned for a full 1:2R win.
SCREENSHOT 4: TP2 Reached - Trade Complete (Image 4)
Time: ~15:00+ UTC+5:30
Final Exit: 26,129.35 (TP2)
Final Result: Full TP2 win
Main Dashboard (Top Right):
- Bias: NEUTRAL (reverted to scanning mode)
- Pulse: 45.2 (returned to neutral zone)
- Volatility: NORMAL
- Trend: TREND DOWN (confirmed the move)
- Session: LONDON
- Volume: 1.26x (increased as move developed)
- HTF: BEARISH (fully aligned post-trade)
- Best Score: 5/5 (neutral after completion)
Trade Analysis Panel (Bottom Left):
- Status: NO ACTIVE TRADE (reverted)
- Long Score: 5/5 (RDY)
- Short Score: 5/5 (RDY)
- Panel Message: "Scanning - prime session active"
- Light blue/cyan background (back to scanning mode)
Description:
Trade Completion - Full Target Achieved: The short trade reaches its second take-profit target at 26,129.35, securing a complete 1:2 risk-reward win. The ' ' marker confirms the exit. Final results:
- Entry: 26,184.65
- Exit: 26,129.35
- Profit: 55.30 points (approximately +2.0R)
- Outcome: Full TP2 success
Post-Trade Analysis: After trade closure, the indicator automatically returns to market scanning mode. The Main Dashboard reverts to showing market conditions rather than trade metrics. Notice how the 'Trend' now displays 'TREND DOWN' - confirming the move we captured. Volume increased to 1.26x during the winning move, validating the signal quality.
The Trade Analysis Panel switches back to 'NO ACTIVE TRADE' status and resumes displaying long/short setup scores. The confidence-based factor monitoring was instrumental throughout the trade:
- Initial entry at 57% confidence (MIXED SIGNALS)
- Peak confidence of 78% at TP1 (FACTORS ALIGNED)
- Real-time factor updates helped confirm trade validity
This example demonstrates the indicator's complete workflow: setup identification → signal generation → entry execution → live trade monitoring → systematic exit at targets.
KEY FEATURES DEMONSTRATED
1. Dual Dashboard System
- Main Dashboard: Market conditions (scanning) → Trade metrics (active position)
- Analysis Panel: Setup scores (scanning) → Factor-based confidence (in-trade)
2. Visual Trade Management
- Color-coded entry zones (yellow)
- Risk levels clearly marked (red dashed stop)
- Profit targets with R:R ratios labeled
- Achievement markers ( , )
3. Real-Time Factor Analysis
- 6-factor scoring system (Momentum, Position, Volume, HTF, Target, Stop Dist)
- Confidence percentage with trend indicators
- State machine (MIXED → FACTORS ALIGNED)
- Hysteresis prevents false state changes
4. Risk Management
- Structure-based stop placement (respects swing highs)
- Multiple take-profit levels (1:1 and 1:2 R:R)
- Live P/L tracking in points and R-multiples
- Distance monitoring to all key levels
This complete example showcases the indicator's progression from setup identification through trade completion, demonstrating how the dual-dashboard system and factor-based analysis provide continuous trade guidance. The structured stop-loss and dual-target approach delivered the planned 1:2 risk-reward ratio with systematic, rule-based execution.
ALERT SYSTEM
The indicator includes 9 built-in alert conditions:
SIGNAL ALERTS:
→ High-Grade Long Signal (A+)
• Triggers only on A+ long signals
• For traders who want only the highest-quality longs
• Message: "KINETIC SCALPER: LONG @ "
→ High-Grade Short Signal (A+)
• Triggers only on A+ short signals
• For traders who want only the highest-quality shorts
• Message: "KINETIC SCALPER: SHORT @ "
→ Long Signal
• Triggers on ANY qualified long signal (A+, A, or B)
• For traders who want all long opportunities
• Message: "KINETIC SCALPER: LONG @ "
→ Short Signal
• Triggers on ANY qualified short signal
• For traders who want all short opportunities
• Message: "KINETIC SCALPER: SHORT @ "
TRADE MANAGEMENT ALERTS:
→ TP1 Hit
• Triggers when first profit target is reached
• Useful for partial profit taking notifications
• Message: "KINETIC SCALPER: TP1 REACHED"
→ TP2 Reached
• Triggers when second profit target is reached
• Trade is complete, full win achieved
• Message: "KINETIC SCALPER: TP2 REACHED"
→ Stop Loss Hit
• Triggers when stop loss is reached
• Important for trade management and risk tracking
• Message: "KINETIC SCALPER: STOP LOSS"
ANALYSIS STATE ALERTS:
→ Analysis State: Negative Bias
• Triggers when factor analysis enters "Negative Bias" state
• Warning that trade conditions are deteriorating
• Consider reducing position or preparing to exit
• Message: "KINETIC SCALPER: Analysis state changed to NEGATIVE BIAS"
→ Analysis State: Factors Weakening
• Triggers when factor analysis enters "Factors Weakening" state
• Caution that confluence is diminishing
• Monitor trade closely
• Message: "KINETIC SCALPER: Analysis state changed to FACTORS WEAKENING"
HOW TO SET UP ALERTS:
1. Click the "Create Alert" button in TradingView
2. Condition: Select "Kinetic Scalper "
3. Choose your desired alert from the dropdown
4. Configure your alert options:
→ Once Per Bar Close (recommended for non-repainting)
→ Frequency: Once Per Bar Close or Only Once
5. Set expiration and notification methods (popup, email, webhook, etc.)
6. Create alert
RECOMMENDED ALERT STRATEGY:
For active traders:
→ Set "Long Signal" and "Short Signal" alerts for all opportunities
→ Set "TP1 Hit", "TP2 Reached", and "Stop Loss Hit" for trade management
→ Consider "Analysis State: Negative Bias" for trade monitoring
For selective traders:
→ Set only "High-Grade Long Signal (A+)" and "High-Grade Short Signal (A+)"
→ Focus on the absolute highest-quality setups
→ Set TP/SL alerts for position management
USAGE TIPS & BEST PRACTICES
SIGNAL SELECTION:
✓ GRADE MATTERS
→ A+ signals have statistically more confluence factors
→ If you're conservative, trade only A+ signals
→ B signals can work but require more discretion
✓ CONFLUENCE WITH YOUR ANALYSIS
→ Use this indicator as CONFIRMATION, not sole decision criteria
→ Combine with your own support/resistance analysis
→ Check for fundamental events (news, economic data)
→ Respect major round numbers and psychological levels
✓ SESSION TIMING (Forex)
→ Best signals often occur during London/NY overlap
→ Avoid signals 10 minutes before major news releases
→ Asian session signals can be valid but lower liquidity
✓ TIMEFRAME CONFLUENCE
→ If you get an A+ signal on 15m, check if 1H chart agrees
→ Higher timeframe confirmation adds conviction
→ Avoid signals that oppose the daily/4H trend
TRADE MANAGEMENT:
✓ POSITION SIZING
→ ALWAYS size positions so stop loss = 1-2% of account
→ Never risk more than you can afford to lose
→ Smaller position on B signals, standard on A, larger on A+ (within limits)
✓ PARTIAL PROFIT TAKING
→ Consider taking 50% off at TP1
→ Move stop to breakeven after TP1 hit
→ Let remaining position run to TP2
✓ TRAILING STOPS
→ The indicator doesn't auto-trail stops (manual decision)
→ After TP1, you might manually move stop to entry (breakeven)
→ Consider ATR-based trailing stop for runners
✓ WATCH THE ANALYSIS PANEL
→ If state changes to "Factors Weakening" while in profit, consider exit
→ "Negative Bias" during a trade is a strong warning
→ "Factors Aligned" confirms your trade thesis is still valid
RISK MANAGEMENT:
✓ NEVER IGNORE STOPS
→ The calculated stop is there for a reason
→ Moving stop further away increases risk exponentially
→ If stopped out, accept it and wait for next setup
✓ AVOID REVENGE TRADING
→ If you get stopped out, resist urge to immediately re-enter
→ Signal cooldown helps with this
→ Wait for next qualified signal
✓ RESPECT VOLATILITY WARNINGS
→ If indicator shows "EXTREME" volatility, signals are blocked for a reason
→ Don't force trades in chaotic conditions
→ Wait for regime to normalize
✓ CORRELATION RISK
→ Be aware of correlation if trading multiple pairs
→ EUR/USD and GBP/USD are highly correlated
→ Don't stack risk on correlated instruments
OPTIMIZATION:
✓ START WITH DEFAULTS
→ Default settings are well-tested
→ Don't over-optimize for recent market behavior
→ Give settings at least 20-30 trades before judging
✓ TIMEFRAME-SPECIFIC ADJUSTMENTS
→ Lower timeframes: Consider increasing Signal Distance to 3.0-4.0
→ Higher timeframes: ATR Stop Multiplier might go to 2.0-2.5
→ Crypto: Ensure Instrument Type is set to "Crypto" for proper stops
✓ SENSITIVITY CALIBRATION
→ Too many signals? Switch to Conservative
→ Missing good setups? Try Balanced or Aggressive
→ Quality > Quantity always
✓ KEEP A JOURNAL
→ Track which signal grades work best for you
→ Note which sessions produce best results
→ Review stopped trades for patterns
THINGS TO AVOID:
✗ DON'T chase signals after several bars have passed
✗ DON'T ignore the stop loss or move it further away
✗ DON'T overtrade by taking every B-grade signal
✗ DON'T trade during major news if you're not experienced
✗ DON'T use this as your only analysis tool
✗ DON'T expect 100% win rate (no indicator has this)
✗ DON'T risk more than 1-2% per trade regardless of signal grade
UNDERSTANDING THE METHODOLOGY
WHY VOLUME WEIGHTING?
Traditional momentum oscillators treat all price moves equally. A 10-point move on low volume is weighted the same as a 10-point move on high volume.
The Kinetic Pulse corrects this by:
→ Calculating volume ratio vs. 20-bar average
→ Applying square root transformation to volume ratio (prevents extreme weights)
→ Multiplying price changes by volume weight
→ Result: High-volume moves influence the oscillator more than low-volume noise
This helps filter false breakouts and emphasizes moves with participation.
WHY FISHER TRANSFORM?
Fisher Transform is a mathematical transformation that:
→ Normalizes probability distributions
→ Creates sharper turning points
→ Amplifies extremes while compressing the middle
→ Makes overbought/oversold levels more distinct
Applied to the Kinetic Pulse, it helps identify genuine extremes vs. noise.
WHY MULTI-OSCILLATOR DIVERGENCE?
Single-source divergence can give false signals. By requiring divergence confirmation across multiple oscillators (Kinetic Pulse, CCI, Stochastic), the system filters out:
→ Divergences caused by calculation quirks in one oscillator
→ Temporary momentum anomalies
→ False divergence on noisy, low-timeframe charts
Multiple sources confirming the same pattern increases reliability.
WHY ADAPTIVE PERIODS?
Fixed periods can be:
→ Too slow during high volatility (miss fast reversals)
→ Too fast during low volatility (generate noise)
The adaptive system:
→ Shortens period when ATR ratio > 1.3 (high volatility = need faster response)
→ Lengthens period when ATR ratio < 0.7 (low volatility = need noise filtering)
→ Keeps period in reasonable range (60% to 140% of base period)
→ Result: Oscillator adjusts to current market pace automatically
WHY HYSTERESIS IN STATE MACHINE?
Without hysteresis, the analysis state would flip-flop on every bar, creating:
→ Confusing, contradictory guidance
→ Analysis paralysis
→ Lack of actionable information
Hysteresis solves this by:
→ Using different thresholds to ENTER vs. EXIT a state
→ Example: Enter "Factors Aligned" at 72+ confidence, but don't exit until <62
→ This creates stable states that persist through minor fluctuations
→ Requires minimum commitment period (3 bars) before state changes
→ Overrides commitment for significant events (near TP/SL)
→ Result: Stable, trustworthy analysis that changes only when truly warranted
WHY CONFIDENCE SMOOTHING?
Raw factor scores fluctuate bar-by-bar based on momentary conditions. Smoothing:
→ Uses 5-period EMA on raw confidence scores
→ Filters out single-bar anomalies
→ Preserves genuine trends in confidence
→ Prevents false state transitions
→ Result: More reliable assessment of actual trade health
WHY INSTRUMENT-SPECIFIC PARAMETERS?
Different instruments have different characteristics:
→ Forex is highly liquid, respects technical levels well, standard ATR works
→ Crypto is extremely volatile, needs wider stops (1.8x) to avoid false stops
→ Indices respect session opens strongly, session weighting is important
→ Commodities fall in between
Auto-detection applies research-based multipliers automatically.
WHY STRUCTURE-BASED STOPS?
ATR-based stops can:
→ Place stop in middle of consolidation (easily hit)
→ Ignore obvious invalidation levels
→ Be too tight during expansion or too wide during contraction
Structure-based stops:
→ Use actual swing highs/lows (where traders actually place stops)
→ Add small ATR buffer to avoid stop hunting
→ Constrain within min/max ATR limits for safety
→ Result: Stops that respect market geometry while managing risk
DISCLAIMER & RISK WARNING
READ THIS CAREFULLY BEFORE USING THIS INDICATOR
This indicator is provided for EDUCATIONAL and INFORMATIONAL purposes only.
❌ NOT FINANCIAL ADVICE
This indicator does NOT constitute financial advice, investment recommendations, or solicitation to buy or sell any financial instrument. All information is for educational purposes only.
❌ NO GUARANTEES
→ Past performance does NOT guarantee future results
→ No indicator can predict future price movements with certainty
→ Signal grades represent confluence, NOT win probability
→ A+ signals can lose, B signals can win - markets are probabilistic
❌ SUBSTANTIAL RISK
Trading financial instruments involves SUBSTANTIAL RISK of loss:
→ You can lose your entire investment
→ Leveraged trading amplifies both gains AND losses
→ Never trade with money you cannot afford to lose
→ Never risk more than 1-2% of your account per trade
❌ YOUR RESPONSIBILITY
→ All trading decisions are YOUR responsibility
→ You must conduct your own analysis before entering trades
→ Consult a licensed financial advisor before trading
→ Understand the risks specific to your jurisdiction and situation
→ Only trade with capital you can afford to lose completely
❌ NO HOLY GRAIL
→ This indicator is a TOOL, not a complete trading system
→ It should be used as part of a broader analysis framework
→ Combine with your own technical analysis, risk management, and judgment
→ No indicator works 100% of the time in all market conditions
❌ ANALYSIS PANEL DISCLAIMER
The "Trade Analysis Panel" provides ALGORITHMIC ANALYSIS of market factors.
→ It does NOT provide investment advice or recommendations
→ Factor scores are mathematical calculations, not predictions
→ Guidance messages are informational, not directives
→ All trading decisions remain your responsibility
❌ BACKTESTING LIMITATIONS
→ This is an indicator, not a strategy, so no backtesting results are provided
→ Any backtesting you perform includes hindsight bias and optimization bias
→ Historical performance does not indicate future performance
→ Slippage, commissions, and real-world execution differ from backtests
❌ MARKET CONDITIONS
→ This indicator performs differently in trending vs. ranging markets
→ Extreme volatility can produce false signals or whipsaws
→ Low liquidity periods increase execution risk
→ Major news events can invalidate technical analysis
BY USING THIS INDICATOR, YOU ACKNOWLEDGE:
→ You have read and understood this disclaimer
→ You accept full responsibility for your trading decisions
→ You understand the substantial risks involved in trading
→ You will not hold the author liable for any losses incurred
→ You are using this tool as part of your own due diligence process
KEY FEATURES SUMMARY
✅ Volume-Weighted Kinetic Pulse Engine (proprietary momentum calculation)
✅ 15-Factor Confluence Scoring System (graded signals: A+, A, B)
✅ Multi-Oscillator Divergence Detection (Pulse + CCI + Stochastic)
✅ Higher Timeframe Trend Alignment Filter
✅ Adaptive Period Adjustment (volatility-responsive)
✅ Instrument-Aware Calibration (Forex, Crypto, Indices, Commodities)
✅ Structure-Based Stop Loss Calculation (respects swing highs/lows)
✅ Automated Trade Tracking (entry, stop, TP1, TP2, P/L)
✅ Real-Time Factor Analysis State Machine (5-state system with hysteresis)
✅ Session Awareness (Asian, London, New York, Overlap)
✅ Volatility Regime Detection (blocks signals in extreme conditions)
✅ Choppiness Filter (reduces signals in ranging markets)
✅ Volume Confirmation (relative volume and delta analysis)
✅ Clean Air Check (validates clear path to targets)
✅ Comprehensive Dashboards (market conditions + trade analysis)
✅ Customizable Display (3 signal styles, color themes, positioning)
✅ 9 Built-In Alert Conditions (signals, TP/SL hits, state changes)
✅ Fully Non-Repainting (barstate.isconfirmed, lookahead_off)
✅ Previous Day Levels (PDH/PDL reference lines)
✅ Mobile-Friendly Compact Mode (for smaller screens)
TECHNICAL SPECIFICATIONS
→ Pine Script Version: v6
→ Indicator Type: Overlay (displays on price chart)
→ License: Mozilla Public License 2.0
→ Copyright: BULLBYTE
→ Object Limits: 300 labels, 100 lines, 50 boxes
→ Memory Management: Automatic cleanup system (FIFO queue)
→ Repainting: Non-repainting (signals confirmed on bar close)
→ Timeframe Support: All timeframes (1s to Monthly)
→ Instrument Support: Forex, Crypto, Indices, Commodities, Stocks
→ HTF Data Handling: lookahead_off with historical offset
VERSION HISTORY
v1.0 - Initial Release
→ Kinetic Pulse engine with volume weighting and Fisher Transform
→ 15-factor confluence scoring system
→ Trade analysis state machine with hysteresis
→ Automated trade tracking and monitoring
→ Dual dashboard system (market conditions + factor analysis)
→ 9 alert conditions
→ 3 signal display styles
→ Instrument-aware calibration
→ Full risk management framework
WHO IS THIS INDICATOR FOR?
IDEAL FOR:
✓ Scalpers and day traders seeking high-confluence reversal entries
✓ Swing traders who want quality over quantity
✓ Traders who appreciate systematic, rules-based analysis
✓ Multi-timeframe traders who value HTF confirmation
✓ Forex traders who respect session timing
✓ Crypto traders needing volatility-adjusted parameters
✓ Traders who want complete trade management (entry, stop, targets)
✓ Analytical traders who want transparency in signal generation
NOT IDEAL FOR:
✗ Traders seeking a "set and forget" holy grail system
✗ Traders who don't want to learn the methodology
✗ Traders unwilling to accept losing trades as part of the process
✗ Traders who need constant signals (this is a quality-focused system)
✗ Traders who ignore risk management
FINAL THOUGHTS
The Kinetic Scalper is the result of extensive research into momentum behavior, volume confirmation, and multi-factor confluence analysis. It's designed to identify high-probability reversal setups while maintaining strict risk management and providing complete transparency.
This is NOT a magic solution. It's a sophisticated TOOL that requires:
→ Understanding of the methodology
→ Proper risk management discipline
→ Patience to wait for quality setups
→ Willingness to accept losses as part of trading
→ Integration with your own analysis and judgment
Used properly as part of a complete trading plan, the Kinetic Scalper can help you identify high-confluence opportunities and manage trades systematically.
Remember: Quality over quantity. Discipline over emotion. Risk management over everything.
Trade smart. Trade safe.
© 2025 BULLBYTE | Kinetic Scalper v1.0 | For Educational Purposes Only

ICT/SMC DOL Detector PRO (Final)This indicator is designed to operate only on the 1-hour timeframe.
The ICT/SMC DOL Detector PRO is an educational indicator designed to identify and visualize Draw on Liquidity (DOL) levels across multiple time-frames. It tracks unmitigated daily highs and lows, clusters them into zones, and calculates confidence scores based on multiple factors including time decay, cluster size, and time-frame alignment.
This indicator is based on ICT (Inner Circle Trader) concepts and liquidity theory, which suggests that price tends to seek out areas of concentrated unfilled orders before reversing or continuing its trend.
What is a DOL (Draw on Liquidity)?
A Draw on Liquidity represents a daily high or low that has not been revisited (mitigated) by price. These levels act as "magnets" that draw price toward them because:
1. They represent untapped liquidity pools where unfilled orders exist
2. Market makers and institutions often target these levels to fill large orders
3. Price is drawn to these zones to clear pending orders
4. They can serve as potential reversal or continuation zones once liquidity is taken
Methodology
1. Level Tracking
The indicator monitors daily session highs and lows on the 1-hour time-frame, tracking:
- Session high price and time of formation
- Session low price and time of formation
- Whether each level has been breached (mitigated)
- Time elapsed since level formation
2. Clustering Algorithm
Unmitigated levels within a defined tolerance (default 0.5% of price) are grouped together to identify zones where multiple DOLs cluster. Larger clusters indicate stronger liquidity pools.
3. Confidence Scoring (The "AI" Logic)
Each DOL receives a confidence score (0-100%) based on three weighted factors. This is the core "AI" intelligence of the indicator:
**Factor 1: Cluster Size (50% weight)**
- Counts how many unmitigated levels exist within 0.5% of the price zone
- Formula: (levels_in_cluster / total_unmitigated_levels) × 50
- Logic: More unfilled orders clustered together = stronger liquidity pool = higher confidence
- Example: If 5 out of 10 total unmitigated levels cluster at 27,500, cluster score = (5/10) × 50 = 25%
**Factor 2: Time Decay (25% weight)**
- Calculates age of the level since formation
- Fresh levels (< 1 week old): Full 25% score
- Aging penalty: Loses 5% per week of age
- Maximum penalty: 25% (very old levels = 0% time score)
- Formula: max(0, 25 - (weeks_old × 5))
- Logic: Recent liquidity is more relevant than old liquidity that price has ignored for months
**Factor 3: Timeframe Alignment (25% weight)**
- Checks how many timeframes (1H, 4H, D1, W1) point in the same direction
- If multiple timeframes identify DOLs on the same side (all bullish or all bearish): Higher score
- If mixed signals: Lower score
- Formula: (aligned_timeframes / total_timeframes) × 25
- Logic: When multiple timeframes agree, the liquidity zone is validated across different time perspectives
**Total Confidence Score:**
```
Confidence = Cluster_Score + Time_Score + Alignment_Score
= (0-50%) + (0-25%) + (0-25%)
= 0-100%
```
**Example Calculation:**
```
DOL at 27,500:
- 6 out of 12 unmitigated levels cluster here → (6/12) × 50 = 25%
- Level is 2 weeks old → 25 - (2 × 5) = 15%
- 3 out of 4 timeframes bullish toward this level → (3/4) × 25 = 18.75%
- Total Confidence = 25% + 15% + 18.75% = 58.75% ≈ 59%
```
This mathematical approach removes subjectivity and provides objective, data-driven confidence scoring.
4. Multi-Timeframe Analysis
The indicator analyzes DOLs across four timeframes:
- **1H:** Intraday levels (fastest reaction)
- **4H:** Short-term swing levels
- **Daily:** Intermediate-term levels
- **Weekly:** Long-term structural levels
For each timeframe, it identifies:
- Highest confidence unmitigated high
- Highest confidence unmitigated low
- Directional bias (bullish if high > low confidence, bearish if low > high confidence)
5. Primary DOL Selection (AI Auto-Selection Logic)
When "Show AI DOL" is enabled, the indicator uses an automated selection algorithm to identify the most important targets:
**Step 1: Collect All Candidates**
The algorithm gathers all identified DOLs from all timeframes (1H, 4H, D1, W1) that meet minimum criteria:
- Must be unmitigated (not yet swept)
- Must have confidence score > 0%
- Must have at least 1 level in cluster
**Step 2: Calculate Confidence for Each**
Each candidate DOL receives its confidence score using the three-factor formula described above (Cluster + Time + Alignment).
**Step 3: Sort by Confidence**
All candidates are ranked from highest to lowest confidence score.
**Step 4: Select Primary and Secondary**
- **P1 (Primary DOL):** The DOL with the absolute highest confidence score
- **P2 (Secondary DOL):** The DOL with the second highest confidence score
**Why This Matters:**
Instead of manually scanning multiple timeframes and guessing which level is most important, the AI objectively identifies the two highest-probability liquidity targets based on quantifiable data.
**Example AI Selection:**
```
Available DOLs:
- 1H High: 27,400
- 4H High: 27,500
- D1 High: 27,500 ← P1 (Highest)
- W1 High: 27,650 ← P2 (Second Highest)
- 1H Low: 26,800
- D1 Low: 26,500
AI Selection:
P1 = 27,500 (Daily High with 92% confidence)
P2 = 27,650 (Weekly High with 88% confidence)
```
This provides a data-driven target selection rather than subjective manual interpretation. The AI removes emotion and bias, selecting targets based purely on mathematical probability.
Features
Why "AI" DOL?
The term "AI" in this indicator refers to the automated algorithmic selection process, not machine learning or neural networks. Specifically:
**What the AI Does:**
- Automatically evaluates all available DOLs across all timeframes
- Applies a weighted scoring algorithm (Cluster 50%, Time 25%, Alignment 25%)
- Objectively ranks DOLs by probability
- Selects the top 2 highest-confidence targets (P1 and P2)
- Removes human bias and emotion from target selection
**What the AI Does NOT Do:**
- It does not use machine learning or train on historical data
- It does not predict future price movements
- It does not adapt or "learn" over time
- It does not guarantee accuracy
The "AI" is simply an automated decision-making algorithm that applies consistent mathematical rules to identify the most statistically significant liquidity zones. Think of it as a "smart filter" rather than artificial intelligence in the traditional sense.
Visual Components
**Daily Level Lines:**
- Green lines: Unmitigated (not yet breached) levels
- Red lines: Mitigated (already breached) levels
- Dots at origin point showing where level was formed
- X marker when level gets breached
- Lines extend forward to show projection
**DOL Labels:**
- Display timeframe (1H, 4H, D1, W1) or "DOL" for AI selection
- Show confidence percentage in brackets
- Color-coded by timeframe:
- Lime: AI DOL (Smart selection)
- Aqua: 1-hour timeframe
- Blue: 4-hour timeframe
- Purple: Daily timeframe
- Orange: Weekly timeframe
**Info Box (Top Right):**
Displays comprehensive liquidity metrics:
- Total levels tracked
- Active (unmitigated) levels count
- Cleared (mitigated) levels count
- Flow direction (BID PRESSURE / OFFER PRESSURE)
- Most recent sweep
- Primary and Secondary DOL targets
- Multi-timeframe bias analysis
- Overall directional bias
Settings Explained
**Daily Levels Group:**
- Show Daily Highs/Lows: Toggle visibility of all daily level tracking
- Unbreached Color: Color for levels not yet hit
- Breached Color: Color for levels that have been swept
- Show X on Breach: Display marker when level is breached
- Show Dot at Origin: Display marker at level formation point
- Line Width: Thickness of level lines (1-5)
- Line Extension: How many bars forward to project (1-24)
- Max Days to Track: Historical lookback period (5-200 days)
**DOL Settings Group:**
- Cluster Tolerance %: Price range to group DOLs (0.1-2.0%)
- Show Price on Labels: Display actual price value on labels
- Backtest Mode: Only show recent labels for clean historical analysis
- Labels Lookback: Number of bars to show labels when backtesting (10-500)
**Info Box Group:**
- Show Info Box: Toggle info panel visibility
**DOL Toggles Group:**
- Show AI DOL: Display smart auto-selected primary target
- Show 1HR DOL: Display 1-hour timeframe DOLs
- Show 4HR DOL: Display 4-hour timeframe DOLs
- Show Daily DOL: Display daily timeframe DOLs
- Show Weekly DOL: Display weekly timeframe DOLs
**Advanced Group:**
- Manual Mode: Simplified display showing only daily high/low clusters
How to Use This Indicator
Educational Application
This indicator is intended for educational purposes to help traders:
1. **Understand Liquidity Concepts:** Visualize where unfilled orders may exist
2. **Identify Key Levels:** See where price may be drawn to
3. **Analyze Market Structure:** Understand how price interacts with liquidity
4. **Study Multi-Timeframe Alignment:** Observe when multiple timeframes agree
5. **Learn ICT Concepts:** Apply liquidity theory in practice
Interpretation Guidelines
**BID PRESSURE (Flow):**
When lows are being swept more than highs, it suggests:
- Sell-side liquidity being taken
- Potential for upward move to unfilled buy-side liquidity
- Market may be clearing the way for a bullish move
**OFFER PRESSURE (Flow):**
When highs are being swept more than lows, it suggests:
- Buy-side liquidity being taken
- Potential for downward move to unfilled sell-side liquidity
- Market may be clearing the way for a bearish move
**Confidence Scores:**
- 90-100%: Very high probability zone (strong cluster, recent, aligned)
- 80-89%: High probability zone (good cluster, relatively recent)
- 70-79%: Moderate probability zone (decent cluster or older)
- 60-69%: Lower probability zone (small cluster or very old)
- Below 60%: Weak zone (minimal confluence)
**Timeframe Analysis:**
- All timeframes LONG: Strong bullish alignment
- All timeframes SHORT: Strong bearish alignment
- Mixed: Conflicting signals, exercise caution
- Higher timeframes (D1, W1) carry more weight than lower (1H, 4H)
**DIRECTIONAL Indicator:**
- BULLISH: Overall bias suggests upward movement toward buy-side DOLs
- BEARISH: Overall bias suggests downward movement toward sell-side DOLs
- NEUTRAL: No clear directional bias, conflicting signals
Practical Application Examples
**Example 1: Bullish Setup**
```
Flow: BID PRESSURE (lows being swept)
P1: 27,500 (price above current market)
D1: LONG 27,500
W1: LONG 27,650
DIRECTIONAL: BULLISH
```
Interpretation: Price has cleared sell-side liquidity. High confidence buy-side DOL at 27,500. Daily and Weekly timeframes aligned bullish. Watch for move toward 27,500 target.
**Example 2: Bearish Setup**
```
Flow: OFFER PRESSURE (highs being swept)
P1: 26,200 (price below current market)
D1: SHORT 26,200
W1: SHORT 26,100
DIRECTIONAL: BEARISH
```
Interpretation: Price has cleared buy-side liquidity. High confidence sell-side DOL at 26,200. Daily and Weekly timeframes aligned bearish. Watch for move toward 26,200 target.
**Example 3: Mixed Signals - Wait**
```
Flow: BID PRESSURE
P1: 26,800
D1: LONG 27,000
W1: SHORT 26,200
DIRECTIONAL: NEUTRAL
```
Interpretation: Conflicting signals. Flow suggests up, but Weekly bias is down. Confidence scores moderate. Better to wait for clarity.
Important Considerations
This Indicator Does NOT:
- Predict the future
- Guarantee profitable trades
- Provide buy/sell signals
- Replace proper risk management
- Work in isolation without other analysis
This Indicator DOES:
- Visualize liquidity concepts
- Identify potential target zones
- Show timeframe alignment
- Calculate objective confidence scores
- Help understand market structure
Proper Usage:
1. Use as one component of a complete trading strategy
2. Combine with price action analysis
3. Confirm with other technical indicators
4. Consider fundamental factors
5. Always use proper risk management
6. Backtest any strategy before live trading
Risk Disclaimer
**FOR EDUCATIONAL PURPOSES ONLY**
This indicator is for educational purposes only. Trading financial markets involves substantial risk of loss. Past performance does not guarantee future results. Always conduct your own research and consult with a financial advisor before making trading decisions.
**Important Limitations:**
- No indicator is 100% accurate, including the AI selection
- The "AI" is an automated algorithm, not predictive artificial intelligence
- DOL levels can be swept and price can continue in the same direction
- Confidence scores are mathematical calculations, not predictions or probabilities of success
- High confidence does not mean guaranteed profit
- Markets can remain irrational longer than you can remain solvent
- Always use stop losses and proper position sizing
**Understanding the AI Component:**
The AI auto-selection feature uses a fixed mathematical formula to rank DOLs. It does not:
- Predict where price will go
- Learn from past performance
- Adapt to market conditions
- Guarantee any level of accuracy
The confidence score represents the mathematical strength of a liquidity cluster based on objective factors (cluster size, recency, timeframe alignment), NOT a probability of the trade succeeding.
**Risk Warning:**
Trading is risky. Most traders lose money. This indicator cannot change that fundamental reality. Use it as an educational tool to understand market structure, not as a trading signal or system.
Technical Requirements
- **Timeframe:** Best used on 1-hour charts (required for accurate daily level tracking)
- **Markets:** Works on any market (forex, crypto, stocks, futures, indices)
- **Updates:** Real-time calculation on each bar close
- **Resources:** Uses max 500 lines and 500 labels (TradingView limits)
Backtesting Features
The indicator includes "Backtest Mode" to keep historical charts clean:
- When enabled, only shows labels from recent bars
- Adjustable lookback period (10-500 bars)
- All lines remain visible
- Helps review past setups without clutter
To use:
1. Enable "Backtest Mode" in settings
2. Adjust "Labels Lookback" to desired period
3. Review historical price action
4. Disable for live trading
Credits and Methodology
This indicator implements concepts from:
- ICT (Inner Circle Trader) liquidity theory
- Smart Money Concepts (SMC)
- Order flow analysis
- Multi-timeframe analysis principles
The clustering algorithm, confidence scoring, and timeframe synthesis are original implementations designed to quantify and visualize these concepts.
Version History
**v1.0 - Initial Release**
- Multi-timeframe DOL detection
- Confidence scoring system
- Info box with liquidity metrics
- Backtest mode for clean charts
- Black/white professional theme
Support and Updates
For questions, feedback, or suggestions, please use the TradingView comments section. Updates and improvements will be released as needed based on user feedback and market evolution.
**Remember:** This is an educational tool. Successful trading requires knowledge, discipline, risk management, and continuous learning. Use this indicator to enhance your understanding of market structure and liquidity, not as a standalone trading system.

TradeChartist Spotter ™TradeChartist Spotter is a extremely well designed Trader's toolkit that packs a range of trading indicators like MACD, RSI, MA/MA-Crosses and Price-Volume Trend Oscillator, along with visual trade spotting tools like Symbol Tracker, MACD Trend Shadow plot and Coloured Bars, including a handy information Dashboard.
===================================================================================================================
™TradeChartist Spotter Features:
1. MACD
MACD is an essential indicator for any trader to track trend strength and momentum of asset prices. Spotter offers 3 MACD options - SMA, EMA and Zero-Lag EMA . Since MACD is based on moving averages, it is inherently a lagging indicator and may not work well when there is no trend strength or when the market is choppy. It is for this reason Spotter offers the option of Overall Trend Shadow and also the option to display Zero-Lag Trend Shadow on normal MACD based on SMA or EMA. This is based on the average of MACD and Signal plots.
Spotter's default MACD settings are 13/34/13, but this can be changed to the classic settings of 12/26/9 and the user can enable or disable the various elements of the MACD based on their preference.
The Dashboard on the MACD Spotter offers information on the symbol tracked, settings used and also the close price of the asset. This is really useful especially when tracking a different symbol than the current price chart symbol. Note that the actual MACD plot also will be of the symbol tracked if it is not the same as price chart symbol.
Using Zero-Lag Trend Shadow on normal SMA/EMA MACD histogram helps spot trend changes early. It is recommended to test different MACD settings on asset traded to suit trading style and frequency.
If MACD Histogram is disabled to see the Overall Trend better, make sure to switch back on as it should not be confused with the main MACD histogram which tracks the distance between the MACD and Signal plots.
2. RSI
RSI is the classic technical indicator that helps track the price magnitude and velocity of the asset's price movement. It helps spot Oversold and Overbought areas easily as it oscillates between 0 and 100, even though values below 10 and values above 90 are almost never seen. By using a upper band and a lower band plot, it is possible to track the strength of the up or down move.
Spotter's default RSI settings are ohlc4/14/5. EMA smoothing of 5 is used to eliminate the noise, but these can be changed to suit user's preference. The default Upper Band is 60 and Lower Band is 40 in the settings, as price moves above 60 RSI tend to be bullish and price moves below 40 tend to be bearish. This can be changed to 70/30 or 80/20 etc. based on how RSI is being used by the user.
RSI strength can also be visualised on the price bars using Spotter's Coloured Bars. The bar colours can be inverted to help traders see the price action differently.
RSI Dashboard also helps track another symbol, it's RSI value and close price to help the user track another symbol on the same chart. Note that the actual RSI plot also will be of the symbol tracked if it is not the same as price chart symbol.
3. MA/MA-Crosses
Two Moving averages (SMA, EMA or Zero-Lag EMA) can be plotted with MA Crosses using the MA/MA-Crosses Spotter.
The MACD input of Fast MA Length and Slow MA Length is used to plot the MA's. To plot just one MA, same value can be entered in both MA length boxes in the settings.
The plots can be merged with the main price chart by using Move Pane Above and by merging the scales into one.
The Dashboard also helps track another symbol, it's MA plots and close price to help the user track another symbol on the same chart. Note that the actual MA plots also will be of the symbol tracked if it is not the same as price chart symbol.
4. Price-Volume Trend Oscillator
Spotter converts the Price Volume Trend (PVT) into an Oscillator, as it helps spot divergences and makes it easy to plot PVT strength as coloured bars on main price chart.
No user input required for this Oscillator plot. Note: Some Symbols don't have volume information and hence PVT Oscillator will not work on them.
PVT Oscillator Dashboard displays current bar volume (if available) along with the close price. Similar to other plots in the Spotter, the Oscillator is of the symbol tracked if its not the same as price chart symbol.
5. Useful Extras
Coloured Bars - Paints price bars with strength and intensity based on indicator used. Bar Colours can be inverted by enabling Invert Bar Colors option from Spotter settings.
Five Colour Themes - Classic, Acute Classic, Effulgence, Firefly and Hallucination
Background colour - Same as bar colour strength, but painted subtly in the indicator background.
===================================================================================================================
Note:
Alerts can be created using the name of the plot under Alert Condition for Spotter - ™TradeChartist crossing above/below etc based on the type of alert the user wants to get.
The indicator does not repaint. Alerts may display potential repaint warning, but this is because the code uses bar index for the Dashboard. For confidence in the indicator, it can be tested using bar replay to make sure the real-time and bar replay trade entries and plots stay on the same bar/timestamp.
™TradeChartist Spotter can be connected to ™TradeChartist Plug and Trade (Premium Script - not free) to generate Trade Entries, Targets, Sop Loss plots etc and to create all types of alerts. Example chart below using LINK-USDT.
===================================================================================================================
Example Charts
1. BTC-USDT 1 hr chart showing MACD with classic settings 12/26/9 on top pane with normal Overall Trend Shadow and the bottom pane with exact same settings with Zero-Lag Overall Trend Shadow.
2. XAU-USD 4 hr chart showing MACD (13/55/34) using Zero-Lag EMA.
3.ADA-USDT 1 hr chart with Price-Volume Trend Oscillator - Useful for confirming divergences and trade decisions based on volume.
4. SPX 15m chart with RSI (ohlc4,14,5) in bottom pane and 5/34 MA cross Spotter on Price Chart with Dashboard.
5. GBP-USD 1 hr chart with Spotter tracking MACD (13/89/34) of DXY (Different Symbol from GBP-USD on chart)
===================================================================================================================
Best Practice: Test with different settings first using Paper Trades before trading with real money
This is a free to use indicator.
===================================================================================================================
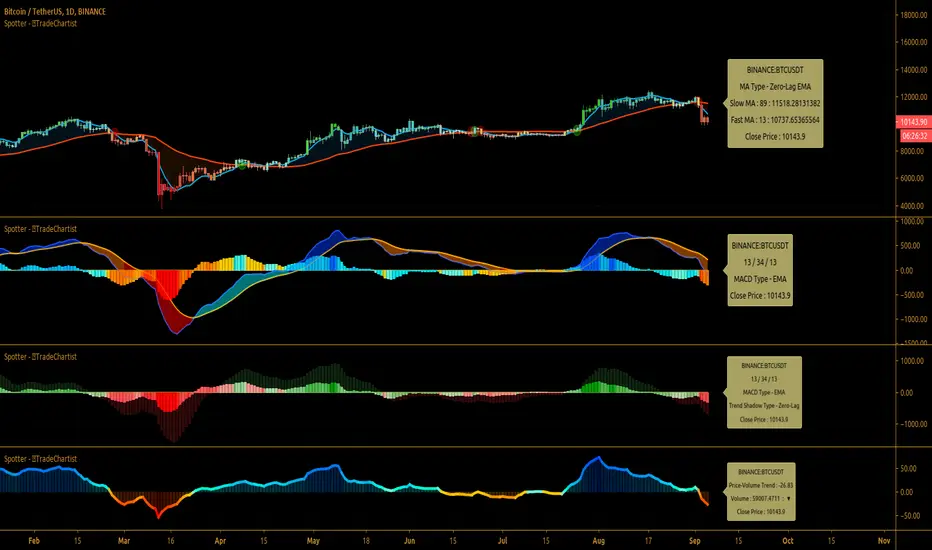
Chronos Reversal Labs - SPChronos Reversal Labs - Shadow Portfolio
Chronos Reversal Labs - Shadow Portfolio: combines reinforcement learning optimization with adaptive confluence detection through a shadow portfolio system. Unlike traditional indicator mashups that force traders to manually interpret conflicting signals, this system deploys 4 multi-armed bandit algorithms to automatically discover which of 5 specialized confluence strategies performs best in current market conditions, then validates those discoveries through parallel shadow portfolios that track virtual P&L for each strategy independently.
Core Innovation: Rather than relying on static indicator combinations, this system implements Thompson Sampling (Bayesian multi-armed bandits), contextual bandits (regime-specific learning), advanced chop zone detection (geometric pattern analysis), and historical pre-training to build a self-improving confluence detection engine. The shadow portfolio system runs 5 parallel virtual trading accounts—one per strategy—allowing the system to learn which confluence approach works best through actual position tracking with realistic exits.
Target Users: Intermediate to advanced traders seeking systematic reversal signals with mathematical rigor. Suitable for swing trading and day trading across stocks, forex, crypto, and futures on liquid instruments. Requires understanding of basic technical analysis and willingness to allow 50-100 bars for initial learning.
Why These Components Are Combined
The Fundamental Problem
No single confluence method works consistently across all market regimes. Kernel-based methods (entropy, DFA) excel during predictable phases but fail in chaos. Structure-based methods (harmonics, BOS) work during clear swings but fail in ranging conditions. Technical methods (RSI, MACD, divergence) provide reliable signals in trends but generate false signals during consolidation.
Traditional solutions force traders to either manually switch between methods (slow, error-prone) or interpret all signals simultaneously (cognitive overload). Both fail because they assume the trader knows which regime the market is in and which method works best.
The Solution: Meta-Learning Through Reinforcement Learning
This system solves the problem through automated strategy selection : Deploy 5 specialized confluence strategies designed for different market conditions, track their real-world performance through shadow portfolios, then use multi-armed bandit algorithms to automatically select the optimal strategy for the next trade.
Why Shadow Portfolios? Traditional bandit implementations use abstract "rewards." Shadow portfolios provide realistic performance measurement : Each strategy gets a virtual trading account with actual position tracking, stop-loss management, take-profit targets, and maximum holding periods. This creates risk-adjusted learning where strategies are evaluated on P&L, win rate, and drawdown—not arbitrary scores.
The Five Confluence Strategies
The system deploys 5 orthogonal strategies with different weighting schemes optimized for specific market conditions:
Strategy 1: Kernel-Dominant (Entropy/DFA focused, optimal in predictable markets)
Shannon Entropy weight × 2.5, DFA weight × 2.5
Detects low-entropy predictable patterns and DFA persistence/mean-reversion signals
Failure mode: High-entropy chaos (hedged by Technical-Dominant)
Strategy 2: Structure-Dominant (Harmonic/BOS focused, optimal in clear swing structures)
Harmonics weight × 2.5, Liquidity (S/R) weight × 2.0
Uses swing detection, break-of-structure, and support/resistance clustering
Failure mode: Range-bound markets (hedged by Balanced)
Strategy 3: Technical-Dominant (RSI/MACD/Divergence focused, optimal in established trends)
RSI weight × 2.0, MACD weight × 2.0, Trend weight × 2.0
Zero-lag RSI suite with 4 calculation methods, MACD analysis, divergence detection
Failure mode: Choppy/ranging markets (hedged by chop filter)
Strategy 4: Balanced (Equal weighting, optimal in unknown/transitional regimes)
All components weighted 1.2×
Baseline performance during regime uncertainty
Strategy 5: Regime-Adaptive (Dynamic weighting by detected market state)
Chop zones: Kernel × 2.0, Technical × 0.3
Bull/Bear trends: Trend × 1.5, DFA × 2.0
Ranging: Mean reversion × 1.5
Adapts explicitly to detected regime
Multi-Armed Bandit System: 4 Core Algorithms
What Is a Multi-Armed Bandit Problem?
Formal Definition: K arms (strategies), each with unknown reward distribution. Goal: Maximize cumulative reward while learning which arms are best. Challenge: Balance exploration (trying uncertain strategies) vs. exploitation (using known-best strategy).
Trading Application: Each confluence strategy is an "arm." After each trade, receive reward (P&L percentage). Bandits decide which strategy to trust for next signal.
The 4 Implemented Algorithms
1. Thompson Sampling (DEFAULT)
Category: Bayesian approach with probability distributions
How It Works: Model each strategy as Beta(α, β) where α = wins, β = losses. Sample from distributions, select highest sample.
Properties: Optimal regret O(K log T), automatic exploration-exploitation balance
When To Use: Best all-around choice, adaptive markets, long-term optimization
2. UCB1 (Upper Confidence Bound)
Category: Frequentist approach with confidence intervals
Formula: UCB_i = reward_mean_i + sqrt(2 × ln(total_pulls) / pulls_i)
Properties: Deterministic, interpretable, same optimal regret as Thompson
When To Use: Prefer deterministic behavior, stable markets
3. Epsilon-Greedy
Category: Simple baseline with random exploration
How It Works: With probability ε (0.15): random strategy. Else: best average reward.
Properties: Simple, fast initial learning
When To Use: Baseline comparison, short-term testing
4. Contextual Bandit
Category: Context-aware Thompson Sampling
Enhancement: Maintains separate alpha/beta for Bull/Bear/Ranging regimes
Learning: "Strategy 2: 60% win rate in Bull, 40% in Bear"
When To Use: After 100+ bars, clear regime shifts
Shadow Portfolio System
Why Shadow Portfolios?
Traditional bandits use abstract scores. Shadow portfolios provide realistic performance measurement through actual position simulation.
How It Works
Position Opening:
When strategy generates validated signal:
Opens virtual position for selected strategy
Records: entry price, direction, entry bar, RSI method
Optional: Open positions for ALL strategies simultaneously (faster learning)
Position Management (Every Bar):
Current P&L: pnl_pct = (close - entry) / entry × direction × 100
Exit if: pnl_pct <= -2.0% (stop-loss) OR pnl_pct >= +4.0% (take-profit) OR held ≥ 100 bars (time)
Position Closing:
Calculate final P&L percentage
Update strategy equity, track win rate, gross profit/loss, max drawdown
Calculate risk-adjusted reward:
text
base_reward = pnl_pct / 10.0
win_rate_bonus = (win_rate - 0.5) × 0.3
drawdown_penalty = -max_drawdown × 0.05
total_reward = sigmoid(base + bonus + penalty)
Update bandit algorithms with reward
Update RSI method bandit
Statistics Tracked Per Strategy:
Equity curve (starts at $10,000)
Win rate percentage
Max drawdown
Gross profit/loss
Current open position
This creates closed-loop learning : Strategies compete → Best performers selected → Bandits learn quality → System adapts automatically.
Historical Pre-Training System
The Problem with Live-Only Learning
Standard bandits start with zero knowledge and need 50-100 signals to stabilize. For weekly timeframe traders, this could take years.
The Solution: Historical Training
During Chart Load: System processes last 300-1000 bars (configurable) in "training mode":
Detect signals using Balanced strategy (consistent baseline)
For each signal, open virtual training positions for all 5 strategies
Track positions through historical bars using same exit logic (SL/TP/time)
Update bandit algorithms with historical outcomes
CRITICAL TRANSPARENCY: Signal detection does NOT look ahead—signals use only data available at entry bar. Exit tracking DOES look ahead (uses future bars for SL/TP), which is acceptable because:
✅ Entry decisions remain valid (no forward bias)
✅ Learning phase only (not affecting shown signals)
✅ Real-time mirrors training (identical exit logic)
Training Completion: Once chart reaches current bar, system transitions to live mode. Dashboard displays training vs. live statistics for comparison.
Benefit: System begins live trading with 100-500 historical trades worth of learning, enabling immediate intelligent strategy selection.
Advanced Chop Zone Detection Engine
The Innovation: Multi-Layer Geometric Chop Analysis
Traditional chop filters use simple volatility metrics (ATR thresholds) that can't distinguish between trending volatility (good for signals) and choppy volatility (bad for signals). This system implements three-layer geometric pattern analysis to precisely identify consolidation zones where reversal signals fail.
Layer 1: Micro-Structure Chop Detection
Method: Analyzes micro pivot points (5-bar left, 2-bar right) to detect geometric compression patterns.
Slope Analysis:
Calculates slope of pivot high trendline and pivot low trendline
Compression ratio: compression = slope_high - slope_low
Pattern Classification:
Converging slopes (compression < -0.05) → "Rising Wedge" or "Falling Wedge"
Flat slopes (|slope| < 0.05) → "Rectangle"
Parallel slopes (|compression| < 0.1) → "Channel"
Expanding slopes → "Expanding Range"
Chop Scoring:
Rectangle pattern: +15 points (highest chop)
Low average slope (<0.05): +15 points
Wedge patterns: +12 points
Flat structures: +10 points
Why This Works: Geometric patterns reveal market indecision. Rectangles and wedges create false breakouts that trap technical traders. By quantifying geometric compression, system detects these zones before signals fire.
Layer 2: Macro-Structure Chop Detection
Method: Tracks major swing highs/lows using ATR-based deviation threshold (default 2.0× ATR), projects channel boundaries forward.
Channel Position Calculation:
proj_high = last_swing_high + (swing_high_slope × bars_since)
proj_low = last_swing_low + (swing_low_slope × bars_since)
channel_width = proj_high - proj_low
position = (close - proj_low) / channel_width
Dead Zone Detection:
Middle 50% of channel (position 0.25-0.75) = low-conviction zone
Score increases as price approaches center (0.5)
Chop Scoring:
Price in dead zone: +15 points (scaled by centrality)
Narrow channel width (<3× ATR): +15 points
Channel width 3-5× ATR: +10 points
Why This Works: Price in middle of range has equal probability of moving either direction. Institutional traders avoid mid-range entries. By detecting "dead zones," system avoids low-probability setups.
Layer 3: Volume Chop Scoring
Method: Low volume indicates weak conviction—precursor to ranging behavior.
Scoring:
Volume < 0.5× average: +20 points
Volume 0.5-0.8× average: +15 points
Volume 0.8-1.0× average: +10 points
Overall Chop Intensity & Signal Filtering
Total Chop Calculation:
chop_intensity = micro_score + macro_score + (volume_score × volume_weight)
is_chop = chop_intensity >= 40
Signal Filtering (Three-Tier Approach):
1. Signal Blocking (Intensity > 70):
Extreme chop detected (e.g., tight rectangle + dead zone + low volume)
ALL signals blocked regardless of confluence
Chart displays red/orange background shading
2. Threshold Adjustment (Intensity 40-70):
Moderate chop detected
Confluence threshold increased: threshold += (chop_intensity / 50)
Only highest-quality signals pass
3. Strategy Weight Adjustment:
During Chop: Kernel-Dominant weight × 2.0 (entropy detects breakout precursors), Technical-Dominant weight × 0.3 (reduces false signals)
After Chop Exit: Weights revert to normal
Why This Three-Tier Approach Is Original: Most chop filters simply block all signals (loses breakout entries). This system adapts strategy selection during chop—allowing Kernel-Dominant (which excels at detecting low-entropy breakout precursors) to operate while suppressing Technical-Dominant (which generates false signals in consolidation). Result: System remains functional across full market regime spectrum.
Zero-Lag Filter Suite with Dynamic Volatility Scaling
Zero-Lag ADX (Trend Regime Detection)
Implementation: Applies ZLEMA to ADX components:
lag = (length - 1) / 2
zl_source = source + (source - source ) × strength
Dynamic Volatility Scaling (DVS):
Calculates volatility ratio: current_ATR / ATR_100period_avg
Adjusts ADX length dynamically: High vol → shorter length (faster), Low vol → longer length (smoother)
Regime Classification:
ADX > 25 with +DI > -DI = Bull Trend
ADX > 25 with -DI > +DI = Bear Trend
ADX < 25 = Ranging
Zero-Lag RSI Suite (4 Methods with Bandit Selection)
Method 1: Standard RSI - Traditional Wilder's RSI
Method 2: Ehlers Zero-Lag RSI
ema1 = ema(close, length)
ema2 = ema(ema1, length)
zl_close = close + (ema1 - ema2)
Method 3: ZLEMA RSI
lag = (length - 1) / 2
zl_close = close + (close - close )
Method 4: Kalman-Filtered RSI - Adaptive smoothing with process/measurement noise
RSI Method Bandit: Separate 4-arm bandit learns which calculation method produces best results. Updates independently after each trade.
Kalman Adaptive Filters
Fast Kalman: Low process noise → Responsive to genuine moves
Slow Kalman: Higher measurement noise → Filters noise
Application: Crossover logic for trend detection, acceleration analysis for momentum inflection
What Makes This Original
Innovation 1: Shadow Portfolio Validation
First TradingView script to implement parallel virtual portfolios for multi-armed bandit reward calculation. Instead of abstract scoring metrics, each strategy's performance is measured through realistic position tracking with stop-loss, take-profit, time-based exits, and risk-adjusted reward functions (P&L + win rate + drawdown). This provides orders-of-magnitude better reward signal quality for bandit learning than traditional score-based approaches.
Innovation 2: Three-Layer Geometric Chop Detection
Novel multi-scale geometric pattern analysis combining: (1) Micro-structure slope analysis with pattern classification (wedges, rectangles, channels), (2) Macro-structure channel projection with dead zone detection, (3) Volume confirmation. Unlike simple volatility filters, this system adapts strategy weights during chop —boosting Kernel-Dominant (breakout detection) while suppressing Technical-Dominant (false signal reduction)—allowing operation across full market regime spectrum without blind signal blocking.
Innovation 3: Historical Pre-Training System
Implements two-phase learning : Training phase (processes 300-1000 historical bars on chart load with proper state isolation) followed by live phase (real-time learning). Training positions tracked separately from live positions. System begins live trading with 100-500 trades worth of learned experience. Dashboard displays training vs. live performance for transparency.
Innovation 4: Contextual Multi-Armed Bandits with Regime-Specific Learning
Beyond standard bandits (global strategy quality), implements regime-specific alpha/beta parameters for Bull/Bear/Ranging contexts. System learns: "Strategy 2: 60% win rate in ranging markets, 45% in bull trends." Uses current regime's learned parameters for strategy selection, enabling regime-aware optimization.
Innovation 5: RSI Method Meta-Learning
Deploys 4 different RSI calculation methods (Standard, Ehlers ZL, ZLEMA, Kalman) with separate 4-arm bandit that learns which calculation works best. Updates RSI method bandit independently based on trade outcomes, allowing automatic adaptation to instrument characteristics.
Innovation 6: Dynamic Volatility Scaling (DVS)
Adjusts ALL lookback periods based on current ATR ratio vs. 100-period average. High volatility → shorter lengths (faster response). Low volatility → longer lengths (smoother signals). Applied system-wide to entropy, DFA, RSI, ADX, and Kalman filters for adaptive responsiveness.
How to Use: Practical Guide
Initial Setup (5 Minutes)
Theory Mode: Start with "BALANCED" (APEX for aggressive, CONSERVATIVE for defensive)
Enable RL: Toggle "Enable RL Auto-Optimization" to TRUE, select "Thompson Sampling"
Enable Confluence Modules: Divergence, Volume Analysis, Liquidity Mapping, RSI OB/OS, Trend Analysis, MACD (all recommended)
Enable Chop Filter: Toggle "Enable Chop Filter" to TRUE, sensitivity 1.0 (default)
Historical Training: Enable "Enable Historical Pre-Training", set 300-500 bars
Dashboard: Enable "Show Dashboard", position Top Right, size Large
Learning Phase (First 50-100 Bars)
Monitor Thompson Sampling Section:
Alpha/beta values should diverge from initial 1.0 after 20-30 trades
Expected win% should stabilize around 55-60% (excellent), >50% (acceptable)
"Pulls" column should show balanced exploration (not 100% one strategy)
Monitor Shadow Portfolios:
Equity curves should diverge (different strategies performing differently)
Win rate > 55% is strong
Max drawdown < 15% is healthy
Monitor Training vs Live (if enabled):
Delta difference < 10% indicates good generalization
Large negative delta suggests overfitting
Large positive delta suggests system adapting well
Optimization:
Too few signals: Lower "Base Confluence Threshold" to 2.5-3.0
Too many signals: Raise threshold to 4.0-4.5
One strategy dominates (>80%): Increase "Exploration Rate" to 0.20-0.25
Excessive chop blocking: Lower "Chop Sensitivity" to 0.7-0.8
Signal Interpretation
Dashboard Indicators:
"WAITING FOR SIGNAL": No confluence
"LONG ACTIVE ": Validated long entry
"SHORT ACTIVE ": Validated short entry
Chart Visuals:
Triangle markers: Entry signal (green = long, red = short)
Orange/red background: Chop zone
Lines: Support/resistance if enabled
Position Management
Entry: Enter on triangle marker, confirm direction matches dashboard, check confidence >60%
Stop-Loss: Entry ± 1.5× ATR or at structural swing point
Take-Profit:
TP1: Entry + 1.5R (take 50%, move SL to breakeven)
TP2: Entry + 3.0R (runner) or trail
Position Sizing:
Risk per trade = 1-2% of capital
Position size = (Account × Risk%) / (Entry - SL)
Recommended Settings by Instrument
Stocks (Large Cap): Balanced mode, Threshold 3.5, Thompson Sampling, Chop 1.0, 15min-1H, Training 300-500 bars
Forex Majors: Conservative-Balanced mode, Threshold 3.5-4.0, Thompson Sampling, Chop 0.8-1.0, 5min-30min, Training 400-600 bars
Cryptocurrency: Balanced-APEX mode, Threshold 3.0-3.5, Thompson Sampling, Chop 1.2-1.5, 15min-4H, Training 300-500 bars
Futures: Balanced mode, Threshold 3.5, UCB1 or Thompson, Chop 1.0, 5min-30min, Training 400-600 bars
Technical Approximations & Limitations
1. Thompson Sampling: Pseudo-Random Beta Distribution
Standard: Cryptographic RNG with true beta sampling
This Implementation: Box-Muller transform using market data as entropy source
Impact: Not cryptographically random but maintains exploration-exploitation balance. Sufficient for strategy selection.
2. Shadow Portfolio: Simplified Execution Model
Standard: Order book simulation with slippage, partial fills
This Implementation: Perfect fills at close price, no fees modeled
Impact: Real-world performance ~0.1-0.3% worse per trade due to execution costs.
3. Historical Training: Forward-Looking for Exits Only
Entry signals: Use only past data (causal, no bias)
Exit tracking: Uses future bars to determine SL/TP (forward-looking)
Impact: Acceptable because: (1) Entry logic remains valid, (2) Live trading mirrors training, (3) Improves learning quality. Training win rates reflect 8-bar evaluation window—live performance may differ if positions held longer.
4. Shannon Entropy & DFA: Simplified Calculations
Impact: 10-15% precision loss vs. academic implementations. Still captures predictability and persistence signals effectively.
General Limitations
No Predictive Guarantee: Past performance ≠ future results
Learning Period Required: Minimum 50-100 bars for stable statistics
Overfitting Risk: May not generalize to unprecedented conditions
Single-Instrument: No multi-asset correlation or sector context
Execution Assumptions: Degrades in illiquid markets (<100k volume), major news events, flash crashes
Risk Warnings & Disclaimers
No Guarantee of Profit: All trading involves substantial risk of loss. This indicator is a tool, not a guaranteed profit system.
System Failures: Software bugs possible despite testing. Use appropriate position sizing.
Market Regime Changes: Performance may degrade during extreme volatility (VIX >40), low liquidity periods, or fundamental regime shifts.
Broker-Specific Issues: Real-world execution includes slippage (0.1-0.5%), commissions, overnight financing costs, partial fills.
Forward-Looking Bias in Training: Historical training uses 8-bar forward window for exit evaluation. Dashboard "Training Win%" reflects this method. Real-time performance may differ.
Appropriate Use
This Indicator IS:
✅ Entry trigger system with confluence validation
✅ Risk management framework (automated SL/TP)
✅ Adaptive strategy selection engine
✅ Learning system that improves over time
This Indicator IS NOT:
❌ Complete trading strategy (requires position sizing, portfolio management)
❌ Replacement for due diligence
❌ Guaranteed profit generator
❌ Suitable for complete beginners
Recommended Complementary Analysis: Market context, volume profile, fundamental catalysts, higher timeframe alignment, support/resistance from other sources.
Conclusion
Chronos Reversal Labs V2.0 - Elite Edition synthesizes research from multi-armed bandit theory (Thompson Sampling, UCB, contextual bandits), market microstructure (geometric chop detection, zero-lag filters), and machine learning (shadow portfolio validation, historical pre-training, RSI method meta-learning).
Unlike typical indicator mashups, this system implements mathematically rigorous bandit algorithms with realistic performance validation, three-layer chop detection with adaptive strategy weighting, regime-specific learning, and full transparency on approximations and limitations.
The system is designed for intermediate to advanced traders who understand that no indicator is perfect, but through proper machine learning and realistic validation, we can build systems that improve over time and adapt to changing markets without manual intervention.
Use responsibly. Understand the limitations. Risk disclosure applies. Past performance does not guarantee future results.
Taking you to school. — Dskyz, Trade with insight. Trade with anticipation.
