signalLib_yashgode9Signal Generation Library = "signalLib_yashgode9"
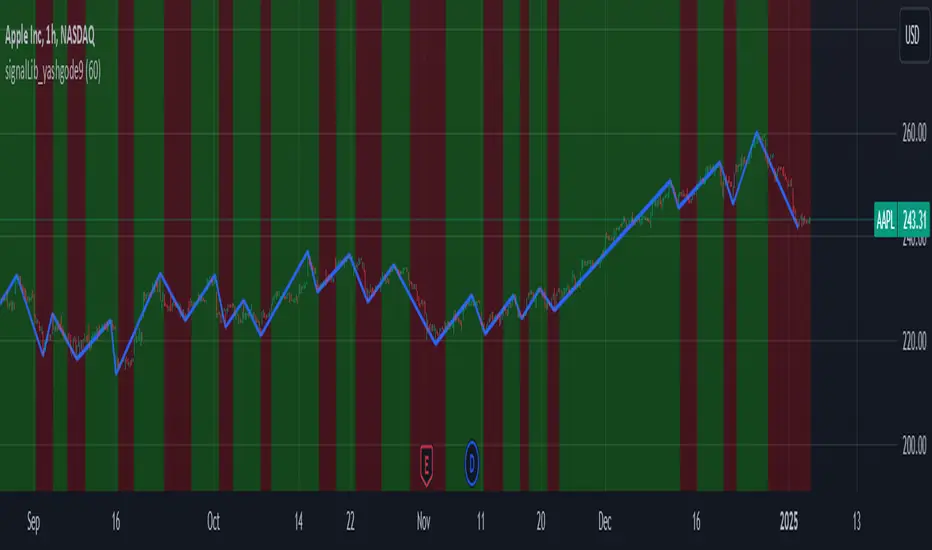
This library, named "signalLib_yashgode9", is designed to generate buy and sell signals based on the price action of a financial instrument. It utilizes various technical indicators and parameters to determine the market direction and provide actionable signals for traders.
Key Features:-
1.Trend Direction Identification: The library calculates the trend direction by comparing the number of bars since the highest and lowest prices within a specified depth. This allows the library to determine the overall market direction, whether it's bullish or bearish.
2.Dynamic Price Tracking: The library maintains two chart points, zee1 and zee2, which dynamically track the price levels based on the identified market direction. These points serve as reference levels for generating buy and sell signals.
3.Customizable Parameters: The library allows users to adjust several parameters, including the depth of the price analysis, the deviation threshold, and the number of bars to consider for the trend direction. This flexibility enables users to fine-tune the library's behavior to suit their trading strategies.
4.Visual Representation: The library provides a visual representation of the buy and sell signals by drawing a line between the zee1 and zee2 chart points. The line's color changes based on the identified market direction, with red indicating a bearish signal and green indicating a bullish signal.
Usage and Integration:
To use this library, you can call the "signalLib_yashgode9" function and pass in the necessary parameters, such as the lower and higher prices, the depth of the analysis, the deviation threshold, and the number of bars to consider for the trend direction. The function will return the direction of the market (1 for bullish, -1 for bearish), as well as the zee1 and zee2 chart points.You can then use these values to generate buy and sell signals in your trading strategy. For example, you could use the direction value to determine when to enter or exit a trade, and the zee1 and zee2 chart points to set stop-loss or take-profit levels.
Potential Use Cases:
This library can be particularly useful for traders who:
1.Trend-following Strategies: The library's ability to identify the market direction can be beneficial for traders who employ trend-following strategies, as it can help them identify the dominant trend and time their entries and exits accordingly.
2.Swing Trading: The dynamic price tracking provided by the zee1 and zee2 chart points can be useful for swing traders, who aim to capture medium-term price movements.
3.Automated Trading Systems: The library's functionality can be integrated into automated trading systems, allowing for the development of more sophisticated and rule-based trading strategies.
4.Educational Purposes: The library can also be used for educational purposes, as it provides a clear and concise way to demonstrate the application of technical analysis concepts in a trading context.
Important Notice:- This library effectively work on timeframe of 5-minute and 15-minute.
Cerca negli script per "track"
Ceres Trader Position and Risk Management ToolNOTE: It won't properly scale until you enter an entry point that is located on the chart. It's a feature not a bug. After that, you will see the entry, s/l, and target price lines properly displayed on the chart.
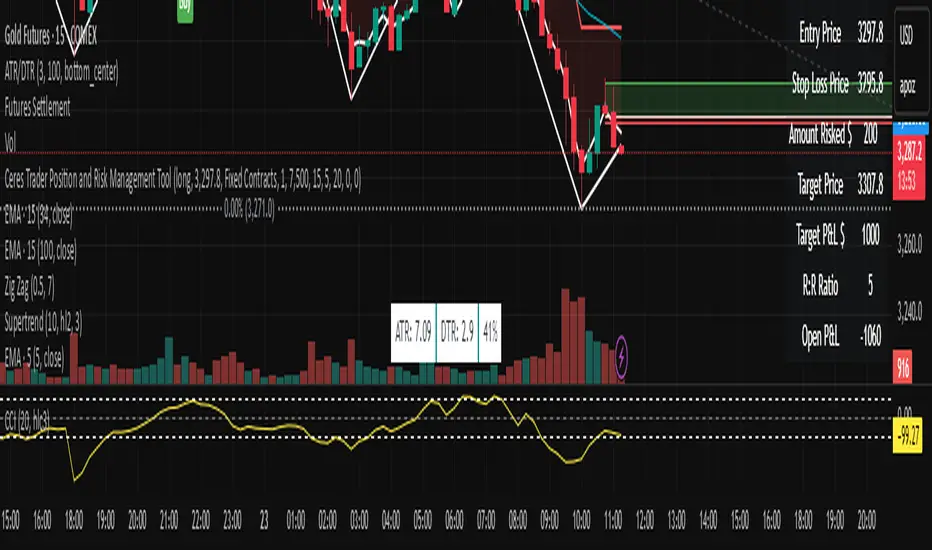
The "Ceres Trader Position and Risk Management Tool" is a comprehensive indicator designed for TradingView, meticulously crafted for traders who prioritize effective risk management and clear position visualization. This tool seamlessly integrates with your trading strategy, providing crucial information about your trades directly on your chart.
Key Features:
Position Type Visualization: Displays long or short positions with distinct color-coded lines and boxes for easy recognition.
Entry, Stop Loss, and Target Levels: Visual markers for entry price, stop loss, and target price, enabling you to track your trade setup at a glance.
Risk Assessment: Calculates and displays the amount at risk based on the stop loss distance and the percentage of risk capital.
Profit Potential: Shows the potential profit in dollar terms if the target is reached, helping you understand the reward prospects of your trade.
Reward to Risk Ratio: Indicates the ratio of potential reward to risk, an essential metric for evaluating the efficiency of your trade setup.
Current P&L Tracking: Continuously updates the open profit and loss based on the current market price, giving you real-time insight into your trade's performance.
Customizable Risk and Reward Boxes: Allows personalization of the risk and reward zones with color options, enhancing chart clarity and visual appeal.
How to Use:
Setting Up Your Trade:
Input your trade details including position type (long or short), entry price, risk capital, risk percentage, reward-risk ratio, and stop loss distance.
Visualize Your Trade:
The tool will automatically plot the entry, stop loss, and target prices on the chart.
Risk and reward areas will be highlighted with customizable color boxes.
Monitor Your Risk and Reward:
View the amount risked and potential profit in dollar terms directly on the chart.
Keep track of the reward to risk ratio to assess trade efficiency.
Stay Informed of Real-time Performance:
The current P&L of your open position will be updated in real-time, helping you make informed decisions.
This tool is ideal for traders who follow disciplined risk management practices and want to keep essential trade information easily accessible. With the "Ceres Trader Position and Risk Management Tool," you are equipped to make strategic trading decisions backed by clear visual cues and critical data.
Camarilla Pivots - Signals, Alerts, TP and SL by Tech Store OnThis is a Camarilla Pivots indicator script, which will show signals, take profit and stop-loss on the chart with alerts based on Camarilla Pivot strategies:
LONG signals: S5 > S4, TP1: S4, TP2: S3, TP3: R3 SL: Manual | S3 > R3, TP1: R3, TP2: R4, TP3: R5, SL: S4 | R4 > R5, TP1: R5, SL: R3
SHORT signals R5 > R4, TP1: R4, TP2: R3, TP3: S3, SL: Manual | R3 > S3, TP1: S3, TP2: S4, TP3: S5, S4 > S5, TP1: S5, SL: S3
Mainly, the script is based on the pivot levels and price action. The script will trigger a signal if a supporting direction candle breaks or bounces at certain pivot, triggering a direction of the potential trade with the next pivot serving as a Price Target area, each signal will potentially wait for 3 Price Target areas and if they happen will show each on chart. An opposite direction pivots are used as a Stop Loss, which the indicator will show on the chart. If stop-loss will be hit, the script will not show take profit areas considering the trade is closed with a loss. Same way if take profit area 1 is reach, it is considered that SL is moved to Entry and therefore the script will no longer show stop-loss for that trade. This indicator was mainly tested via 15min timeframe, but feel free to try different timeframes as the concept is the same.
This strategy was extensively manually tested, trade by trade, with S&P 500 ETF 15min timeframe, for back-testing results for the whole 2021 year (this is simply if you would LONG/SHORT stocks, don’t forget that if you trade Options, there is also Theta present (options price decay over time), the win rate is: 86.12%
*** If a trade was uncertain > it was marked immediately as stop-loss
*** A position was always closed at the end of the day no matter what (profit/loss)
Config: Alerts need to be set for each signal, take profit and stop-loss, it is pretty much self-explanatory, just right click the chart, select “Add alert” > next to Conditions select “Camarilla Pivot…”, for each trade signal and stop-loss, make sure it is “Once per Bar Close” and for each take-profit make sure it is “Once Per Bar”. Stop-losses are confirmed price breaks, while take-profits – we just need to touch those pivots.
Config: By Default, indicator signals are given during regular BEST (after 3PM ET – it’s power hour, which often is unpredictable + market will be closing soon) US standard market hours: 9:30AM-3PM ET, take profit and stop-losses by default are set to 9:30AM-4PM ET (US standard market hours. Both can be adjusted via Inputs. If you wish for the signals/take profit and stop-losses to be tracked 24/7 > choose the “EMPTY” space for both.
Config: Number of candles/bars to track back for opened positions is the number of Candles/Bars tracked back for each position. You can change this setting as it relates to timeframe versus trading style (day trading/swing), play around to find your best settings, by default it’s 13, which is best for day trading/15M timeframe. Please note: if position takes “too long” to reach TP or SL, it may not show TP or SL, so you need to keep an eye on this. It is best to use slightly lower number for day trading, because otherwise if you receive the same signal more than twice during the day > it will not show TP or SL for the second/third/etc. position. This is custom for you to change though, so if you want longer position tracking for the day, choose: 26 candles (this is the amount of 15M candles during the day), but keep in mind that for second/third position > it may not show you the TP1/SL.
Config: The table showing positions will show current open position on the bottom cell if position is opened per indicator, you can move or even hide this table in the indicator settings. (Please note: this is decorative thing and sometimes may show a position open, which is not actually open, especially when the market is not currently open).
Tip: Note: if pivots are too far away from each other and there is either big profit already or another support/resistance indicator (VWAP, SMA, support & resistance levels, etc.) – it is wise to take some profit off and move SL to Entry to secure profits in case market decides to turn around. This is especially wise if you trade Options as they include Theta (options price decay over time). Please note: back-test results displayed above were done without VWAP.
Tip: R5 > R4 and S5 > S4 are riskier signals as there are no pivots above/below for the SL, the script does not have a built-in stop-loss level/indicator for these, so you will need to manually set your stop-losses for these signals. Last day pivots often can help with this or simply use most recent support & resistance levels.
Tip: If trading S&P: be careful opening positions near 3PM ET, as during the “power hour” – 3-4PM ET > volatility increases and direction of the price becomes much more unpredictable. Similar: if you are in profit, it is wise to close the majority of your position at 3PM ET, before the “power hour” starts.
Tip: Very conservative trading approach: after signal happens, wait for a bounce back (price going back touching the pivot) and open position right there, that way > SL will be smaller and better risk/reward ration.
Tip: There is no limit on how many signals the script will show if it meets the conditions (in case you miss one of the signals and conditions repeat > you can still get into decent trade at next signal if it matches the condition).
Note1: if candle closes crossing/breaking several pivots at the same time and that same candle will touch take profit pivot – the script is configured to minimize showing/alerting signals/TP/SL for such conditions, so that you don’t get a very dirty chart / spammed with alerts, however sometimes it may or may not show signals and/or take profits/losses incorrectly. Overall, when you see such huge candles, it means that market volatility is bigger than usual, so a caution should be practiced.
Note2: If the signal candle almost nearly touches the first take profit area > it’s best not to open a position (you literally opening it at the first take profit pivot, and it may bounce the other way from that same pivot).
Note3: You may sometimes see take profit/stop-loss indicators in the beginning of the day or simply when pivot levels change, this is due to script registering the position open per old pivot levels and then show you take profit/stop-loss per new pivot levels.

Technical Analysis Consulting Table (TACT)Inspired by Tradingview's own "Technical Analysis Summary", I present to you a table with analogous logic.
You can track any ticker you want, no matter your chart. You can even have multiple tables to track multiple tickers. By default it tracks the Total Crypto Cap.
You can change the resolution you want to track. By default it is the same as the chart.
You can position the table to whichever corner of the chart you want. By default it draws in the bottom right corner.
Background colors and text size can be adjusted.
Indicators Used:
Oscillators
RSI(14)
STOCH(14, 3, 3)
CCI(20)
ADX(14)
AO
Momentum(10)
MACD(12, 26)
STOCH RSI(3, 3, 14, 14)
%R(14)
Bull Bear Power
UO(7,14,28)
Moving Averages
EMA(5)
SMA(5)
EMA(10)
SMA(10)
EMA(20)
SMA(20)
EMA(30)
SMA(30)
EMA(50)
SMA(50)
EMA(100)
SMA(100)
EMA(200)
SMA(200)
Ichimoku Cloud(9, 26, 52, 26)
VMWA(20)
HMA(9)
Pivots
Traditional
Fibonacci
Camarilla
Woodie
WARNING: I have observed up to a couple of seconds of signal jitter/delay, so use it with caution in very small resolutions (1s to 1m).
I hope you enjoy this and good luck with your trading. Suggestions and feedback are most welcome.

AMT Structure: 80% Traverse, PD Levels & nPOCsHere is a clean, professional description formatted for the TradingView description box. It highlights the methodology (AMT/80% Rule), the specific features, and the credits.
Title: AMT Structure: 80% Traverse, PD Levels & nPOCs
Description:
This indicator is a comprehensive toolkit designed for futures traders utilizing Auction Market Theory (AMT) and Volume Profile strategies. It consolidates multiple scripts into a single, unified overlay to declutter your chart while providing essential structural references for the 80% Traverse setup, intraday context, and longer-term auction targets.
Key Features:
1. 80% Rule / Traverse Setup (Chart Champions Logic)
Automated RTH Open Detection: Hardcoded to the 08:30 AM CT Open to ensure accuracy for US Futures (ES/NQ) regardless of your chart's timezone settings.
Value Area Logic: Automatically calculates the Previous Day's Value Area High (VAH), Value Area Low (VAL), and Point of Control (POC).
Setup Detection: If the market opens outside of the previous day's value, the script highlights the Value Area in color (default: Purple), signaling that an 80% traverse (filling the value area) is structurally possible if price re-enters value.
Background Fill: Optional shading between VAH and VAL to clearly visualize the "playing field" for the traverse.
2. Auction Market Theory (AMT) Premarket Levels
Overnight High/Low: Automatically captures the highest and lowest prices traded during the overnight session (17:00 - 08:30 CT).
Breakout Alerts: Includes logic to detect and alert when these overnight levels are broken during the RTH session.
Auto-Cleanup: Lines can be set to auto-delete after a specified time (default: 60 mins into the session) to keep the chart clean after the Initial Balance (IB) period.
3. Structural Reference Levels
Previous Day Levels: Plots Previous Day High, Low, and Equilibrium (Midpoint) as standard reference lines.
Initial Balance (IB): Option to display the First Hour High and Low (08:30 - 09:30 CT) to assess day type (Neutral, Trend, Normal Variation, etc.).
RTH VWAP: An anchored VWAP that resets specifically at the RTH Open (08:30 CT), distinct from the standard 24-hour VWAP.
4. Naked Points of Control (nPOCs)
Multi-Timeframe Tracking: Tracks and plots Naked POCs for Daily, Weekly, and Monthly profiles.
Auto-Cleanup: Lines automatically delete themselves the moment price touches them, ensuring you only see untested levels.
Customization: Toggle each timeframe on/off individually.
Settings & Customization:
Global Offset: Move all text labels to the right with a single setting to prevent price action from obscuring text.
8:30 Open Offset: Independent offset for the Open label to distinguish it from other opening references.
Smart Coloring: Text labels automatically match their corresponding line colors for easy identification.
Modular Toggles: Every section (AMT, VWAP, PD Levels, CCV, nPOCs) can be turned on or off individually to suit your specific trading plan.
Usage: This tool is specifically tuned for ES and NQ futures trading but can be adapted for other instruments. It replaces the need for separate indicators for Overnight Highs/Lows, Previous Day Levels, and Volume Profile targeting.

[Yorsh] BJN iFVG Model BJN iFVG Model - Mechanical Trading System
Description:
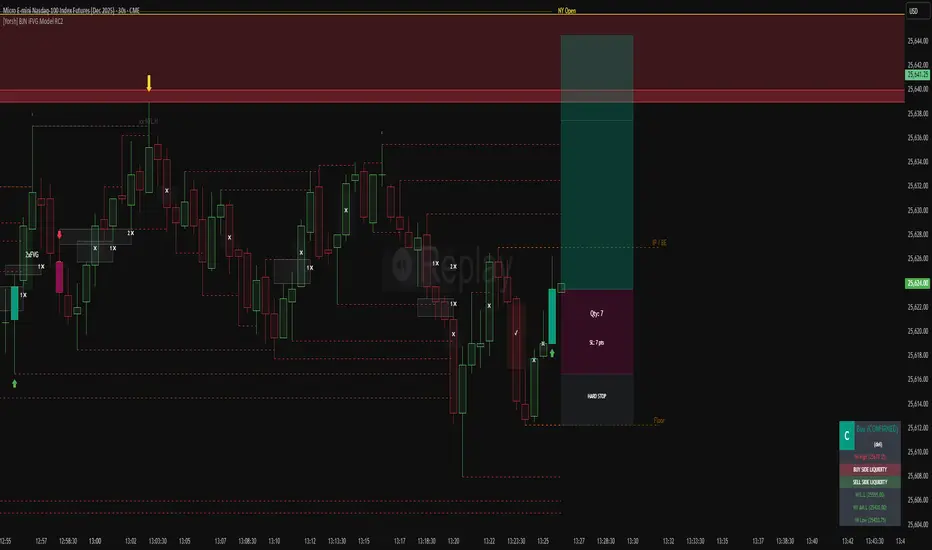
The BJN iFVG Model is not just an indicator; it is a full-scale, semi-automated trading architecture designed to mechanically execute the specific "BJN" Inverted FVG strategy.
Designed for precision traders operating on Lower Timeframes (1m to 5m), this script eliminates the cognitive load of manual analysis. It automates every single step of the mechanical model—from Higher Timeframe narrative building to tick-perfect structural validation and risk calculation.
This tool transforms your chart into a professional trading cockpit, split into three intelligent engines:
1. The Matrix (Context Engine)
Before looking for an entry, you must understand the narrative. The Matrix handles the heavy lifting of multi-timeframe analysis without cluttering your chart:
Real-Time Delivery State: Automatically detects if price is reacting from valid HTF PD Arrays (1H, 4H, Daily) to confirm a "Delivery" state.
Liquidity Sweeps: Tracks Fractals across three dimensions (1H, 15m, and Micro-Structure) to identify liquidity raids instantly.
Advanced SMT Divergence: A built-in, multi-mode SMT engine scans for correlation breaks (Pivot SMT, Adjacent Wick SMT, and FVG SMT) between NQ/ES (or custom tickers) in real-time.
Time & Macro Tracking: Automatically visualizes Killzones and highlights high-probability Macro windows.
2. The Executioner (Entry Engine)
Once the context is set, the Executioner handles the specific Inverted FVG (iFVG) entry model with strict mechanical rules:
Structural Integrity: Automatically identifies the Invalidation Point (IP), Floor/Ceiling, and Break-Even levels for every setup.
Hazard Detection: The script proactively scans the "Trading Leg" for opposing unmitigated FVGs (Hazards). If the path isn't clean, the trade is flagged or invalidated.
Composite Logic: Intelligently merges "noisy" price action into Composite FVGs to reduce false signals.
Integrated Position Sizer: When a trade is confirmed, a visual box appears showing your precise Entry, Stop Loss, Hard Stop, and Take Profit levels, along with a calculated Contract Quantity based on your risk tolerance.
3. The Ranking System (Quality Control)
Not all trades are created equal. This system grades every single confirmed setup in real-time based on confluence factors:
Grades: Ranges from A++ (Perfect Confluence) to C (Low Probability).
Confluence Check: Checks for Delivery, Sweeps (HTF/LTF), SMT, and Macro alignment at the exact moment of the trigger.
Live Status Panel: A dashboard on your chart displays the current live trade status (Armed, Triggered, Confirmed) and its Rank, so you never miss a beat.
Optimization & Performance
Trading on the 1-minute timeframe requires speed. This script has been rigorously optimized for high-frequency environments:
Smart Garbage Collection: The script manages its own memory, cleaning up old data arrays to prevent lag, ensuring the chart remains fluid even after days of data accumulation.
Tunnel Vision: Calculations are strictly focused on the relevant trading leg, ignoring historical noise to maximize execution speed.
Zero-Repaint: All historical analysis is strictly non-repainting to ensure backtesting reliability.
How to Use
Timeframes: Optimized for 1m, 2m, 3m, 4m, 5m execution.
Alerts: Configure the robust alert system to notify you only when setups meet your standards (e.g., "Alert only on Rank B+ or higher").
Strategy: Wait for the Status Panel to show a "CONFIRMED" signal. Use the on-screen Position Sizer to execute the trade with the displayed risk parameters.
Stop analyzing; start executing. Welcome to mechanical trading.
----------------------------------------------------------------------------------------------------------------
RISK DISCLAIMER:
The content, tools, and signals generated by this script are strictly for educational and informational purposes only. This script does not constitute financial advice, investment recommendations, or a solicitation to buy or sell any securities, futures, or other financial instruments.
Trading financial markets involves a high degree of risk and is not suitable for all investors. The "Position Sizer" and "Trade Setups" displayed are hypothetical simulations designed to demonstrate the mechanics of the BJN methodology; they do not guarantee future performance.
Use this tool at your own risk. The author assumes no responsibility or liability for any trading losses or damages incurred in connection with the use of this script. Always consult with a qualified financial advisor and practice proper risk management.

Advanced ICC Multi-Timeframe 1.0Advanced ICC Multi-Timeframe Trading System
A comprehensive implementation and interpretation of the Indication, Correction, Continuation (ICC) trading methodology made popular by Trades by Sci, enhanced with advanced multi-timeframe analysis and automation features.
⚠️ CRITICAL TRADING WARNINGS:
DO NOT blindly follow BUY/SELL signals from this indicator
This indicator shows potential entry points but YOU must validate each trade
PAPER TRADE EXTENSIVELY before risking real capital
BACKTEST THOROUGHLY on your chosen instruments and timeframes
The ICC methodology requires understanding and discretion - automated signals are guidance only
This tool aids analysis but does not replace proper trade planning, risk management, or trader judgment
⚠️ Important Disclaimers:
This indicator is not endorsed by or affiliated with Trades by Sci
This is an early implementation and interpretation of the ICC methodology
May not work exactly as Trades by Sci executes his trades and entries
Requires further debugging, backtesting, and real-world validation
Completely free to use - no purchase required
I'm just one person obsessed with this method and wanted some better visualization of the chart/entries
About ICC:
The ICC method identifies complete market cycles through three phases: Indication (breakout), Correction (pullback), and Continuation (entry). This indicator automates the identification of these phases and adds powerful features for modern traders.
Key Features:
Multi-Timeframe Capabilities:
Automatic timeframe detection with optimized settings for 5m, 15m, 30m, 1H, 4H, and Daily charts
Higher timeframe overlay to view HTF ICC levels on lower timeframe charts for precise entry timing
Smart defaults that adjust swing length and consolidation detection based on your timeframe
Advanced Phase Tracking:
Complete ICC cycle tracking: Indication, Correction, Consolidation, Continuation, and No Setup phases
Live structure detection shows potential peaks/troughs before full confirmation
Intelligent invalidation logic detects failed setups when market structure reverses
Dynamic phase backgrounds for instant visual confirmation
Three Types of Entry Signals:
Traditional Entries - Price crosses back through the original indication level (strongest signals)
"BUY" (green) / "SELL" (red)
Breakout Entries - Price breaks out of consolidation range in the same direction
"BUY" (green) / "SELL" (red)
Reversal Entries (Optional, can be toggled off) - Price breaks consolidation in opposite direction, indicating failed setup
"⚠ BUY" (yellow) / "⚠ SELL" (orange)
More aggressive, counter-trend signals
Can be disabled for more conservative trading
Professional Features:
Volatility-based support/resistance zones (ATR-adjusted) that adapt to market conditions
Historical zone tracking (0-3 configurable) with visual hierarchy
Comprehensive real-time info table displaying all key metrics
Full alert system for entries, indications, and consolidation detection
Visual distinction between high-confidence trend entries and cautionary reversal entries
📖 USAGE GUIDE
Entry Signal Types:
The indicator provides three types of entry signals with visual distinction:
Strong Entries (High Confidence):
"BUY" (bright green) / "SELL" (bright red)
Includes traditional entries (crossing back through indication level) and breakout entries (breaking consolidation in trend direction)
These are trend continuation or breakout signals with higher probability
Recommended for all traders
Reversal Entries (Caution - Counter-Trend):
"⚠ BUY" (yellow) / "⚠ SELL" (orange)
Triggered when price breaks out of correction/consolidation in the OPPOSITE direction
Indicates a failed setup and potential trend reversal
More aggressive, counter-trend plays
Can be toggled off in settings for more conservative trading
Recommended only for experienced traders or after thorough backtesting
Swing Length Settings:
The swing length determines how many bars on each side are needed to confirm a swing high/low. This is the most important setting for tuning the indicator to your style.
Auto Mode (Recommended for beginners): Toggle "Use Auto Timeframe Settings" ON
5-minute: 30 bars
15-minute: 20 bars
30-minute: 12 bars
1-hour: 7 bars
4-hour: 5 bars
Daily: 3 bars
Manual Mode: Toggle "Use Auto Timeframe Settings" OFF
Lower values (3-7): More aggressive, detects smaller swings
Pros: More signals, faster entries, catches smaller moves
Cons: More noise, more false signals, requires tighter stops
Best for: Scalping, active day trading, volatile markets
Higher values (12-20): More conservative, only major swings
Pros: More reliable signals, fewer false breakouts, clearer structure
Cons: Fewer signals, delayed entries, might miss smaller opportunities
Best for: Swing trading, position trading, trending markets
Default Manual Setting: 7 bars (balanced for 1H charts)
Minimum: 3 bars
Consolidation Bars Setting:
Determines how many bars without new structure are needed before flagging consolidation.
Lower values (3-10): Faster detection, catches brief pauses, more sensitive
Best for: Lower timeframes, volatile markets, avoiding any chop
Higher values (20-40): More reliable, only flags true extended consolidation
Best for: Higher timeframes, trending markets, patient traders
Current defaults scale with timeframe (more bars needed on shorter timeframes)
Historical S/R Zones:
Shows previous support and resistance levels to provide context.
Default: 2 historical zones (shows current + 2 previous)
Range: 0-3 zones
Visual Hierarchy: Older zones are more transparent with dashed borders
Usage: Higher numbers (2-3) show more historical context but can clutter the chart. Start with 2 and adjust based on your preference.
Live Structure Feature (Yellow Warning ⚠):
Provides early warning of potential structure changes before full confirmation.
What it does: Detects potential swing highs/lows after just 2 bars instead of waiting for full swing_length confirmation
Live Peak: Shows when a high is followed by 2 lower closes (potential top forming)
Live Trough: Shows when a low is followed by 2 higher closes (potential bottom forming)
Important: These are UNCONFIRMED - they may be invalidated if price reverses
Use case: Get early awareness of potential reversals while waiting for confirmation
Displayed in: Info table only (no visual markers on chart to reduce clutter)
Only shows: Peaks higher than last swing high, or troughs lower than last swing low (filters out noise)
Higher Timeframe (HTF) Analysis:
View higher timeframe ICC structure while trading on lower timeframes.
How to enable: Toggle "Show Higher Timeframe ICC" ON
Setup: Set "Higher Timeframe" to your reference timeframe
Example: Trading on 15-minute? Set HTF to 240 (4-hour) or 60 (1-hour)
Example: Trading on 5-minute? Set HTF to 60 (1-hour) or 15 (15-minute)
What it shows:
HTF indication levels displayed as dashed lines
Blue = HTF Bullish Indication
Purple = HTF Bearish Indication
HTF phase and levels shown in info table
Trading workflow:
Check HTF phase for overall market direction
Wait for HTF correction phase
Drop to lower timeframe to find precise entries
Enter when lower TF shows continuation in alignment with HTF
Best practice: HTF should be 3-4x your trading timeframe for best results
Reversal Entries Toggle:
Default: ON (shows all signal types)
Toggle OFF for more conservative trading (only trend continuation signals)
Recommended: Backtest with both settings to see which works better for your style
New traders should consider disabling reversal entries initially
Volatility-Based Zones:
When enabled, support/resistance zones automatically adjust their height based on ATR (Average True Range).
More volatile = wider zones
Less volatile = tighter zones
Toggle OFF for fixed-width zones
Community Feedback Welcome:
This is an evolving project and your input is valuable! Please share:
Bug reports and issues you encounter
Feature requests and suggestions for improvement
Results from your backtesting and live trading experience
Feedback on the reversal entry feature (too aggressive? working well?)
Ideas for better aligning with the ICC methodology
Perfect for traders learning or implementing the ICC methodology with the benefit of modern automation, multi-timeframe analysis, and flexible entry signal options.

RSI Risk | AlgoFy TraderRSI Risk | AlgoFy Trader
Overview
The RSI Risk | AlgoFy Trader is a trading system that combines RSI-based entry signals with automated capital management. This strategy identifies potential momentum shifts while controlling risk through calculated position sizing.
Key Features
Dynamic Risk Management:
Fixed Risk Per Trade: Users set maximum risk percentage per trade.
Automatic Position Sizing: Calculates position size based on stop-loss distance.
Capital Protection: Limits each trade's risk to user-defined percentage.
RSI Entry System:
Momentum Detection: Uses RSI crossovers above/below defined thresholds.
Clear Signals: Provides long/short entries on momentum transitions.
Multiple Exit Layers:
Dynamic Stop Loss: Stop based on recent price structure.
Fixed Safety Stop: Optional percentage-based stop loss.
Partial Take Profit: Optional early profit-taking.
Trailing Stop: Optional dynamic profit protection.
Performance Tracking:
Trade Statistics: Tracks win/loss streaks and performance metrics.
Monthly Dashboard: Shows monthly/yearly P&L with equity views.
Trade Details: Displays risk percentage and position size.
How It Works
Signal Detection: Monitors RSI for crossover events.
Risk Calculation: Determines stop-loss based on recent volatility.
Position Sizing: Calculates exact position to match risk percentage.
Example:
Account: $10,000 | Risk: 2% ($200 max)
Stop loss at 4% distance
Position size: $5,000
Result: 4% loss on $5,000 = $200 (2% of account)
Recommended Settings
Risk: 1-2% per trade
Enable fixed stop at 3-4%
Consider trailing stop activation
This script provides disciplined RSI trading with automated risk control, adjusting exposure while maintaining strict risk limits.

OrbifyOrbify is a professional Opening Range Break (ORB) trading indicator that identifies key breakout opportunities during market sessions. Designed for both 5-minute and 15-minute timeframes, this tool visualizes the opening range, tracks breakouts with real-time alerts, and provides automated risk management with customizable take-profit and stop-loss levels.
🎯 Opening Range Detection
Customizable Session Times: Set your preferred ORB session (default: 09:30-09:35 EST)
Visual Range Box: Clear visualization of high/low range during the opening session
Extended Lines: Option to extend range boundaries throughout the trading day
⚡ Breakout Identification
Real-time Break Alerts: Instant visual labels when price breaks above/below the ORB
Session-Based Tracking: Automatically resets at 18:00 EST for new trading days
Smart Break Detection: Prevents duplicate signals within the same session
🛡️ Integrated Risk Management
Automated TP/SL Calculation: Calculates take-profit and stop-loss based on ORB range
Customizable Risk-Reward: Adjust TP/SL as percentage of ORB range (default: 50%)
Visual Zones: Colored boxes showing TP/SL areas for quick reference
Price Labels: Optional display of exact TP/SL price levels

[Yorsh] BJN iFVG Model RC1 BJN iFVG Model - Mechanical Trading System
Description:
The BJN iFVG Model is not just an indicator; it is a full-scale, semi-automated trading architecture designed to mechanically execute the specific "BJN" Inverted FVG strategy.
Designed for precision traders operating on Lower Timeframes (1m to 5m), this script eliminates the cognitive load of manual analysis. It automates every single step of the mechanical model—from Higher Timeframe narrative building to tick-perfect structural validation and risk calculation.
This tool transforms your chart into a professional trading cockpit, split into three intelligent engines:
1. The Matrix (Context Engine)
Before looking for an entry, you must understand the narrative. The Matrix handles the heavy lifting of multi-timeframe analysis without cluttering your chart:
Real-Time Delivery State: Automatically detects if price is reacting from valid HTF PD Arrays (1H, 4H, Daily) to confirm a "Delivery" state.
Liquidity Sweeps: Tracks Fractals across three dimensions (1H, 15m, and Micro-Structure) to identify liquidity raids instantly.
Advanced SMT Divergence: A built-in, multi-mode SMT engine scans for correlation breaks (Pivot SMT, Adjacent Wick SMT, and FVG SMT) between NQ/ES (or custom tickers) in real-time.
Time & Macro Tracking: Automatically visualizes Killzones and highlights high-probability Macro windows.
2. The Executioner (Entry Engine)
Once the context is set, the Executioner handles the specific Inverted FVG (iFVG) entry model with strict mechanical rules:
Structural Integrity: Automatically identifies the Invalidation Point (IP), Floor/Ceiling, and Break-Even levels for every setup.
Hazard Detection: The script proactively scans the "Trading Leg" for opposing unmitigated FVGs (Hazards). If the path isn't clean, the trade is flagged or invalidated.
Composite Logic: Intelligently merges "noisy" price action into Composite FVGs to reduce false signals.
Integrated Position Sizer: When a trade is confirmed, a visual box appears showing your precise Entry, Stop Loss, Hard Stop, and Take Profit levels, along with a calculated Contract Quantity based on your risk tolerance.
3. The Ranking System (Quality Control)
Not all trades are created equal. This system grades every single confirmed setup in real-time based on confluence factors:
Grades: Ranges from A++ (Perfect Confluence) to C (Low Probability).
Confluence Check: Checks for Delivery, Sweeps (HTF/LTF), SMT, and Macro alignment at the exact moment of the trigger.
Live Status Panel: A dashboard on your chart displays the current live trade status (Armed, Triggered, Confirmed) and its Rank, so you never miss a beat.
Optimization & Performance
Trading on the 1-minute timeframe requires speed. This script has been rigorously optimized for high-frequency environments:
Smart Garbage Collection: The script manages its own memory, cleaning up old data arrays to prevent lag, ensuring the chart remains fluid even after days of data accumulation.
Tunnel Vision: Calculations are strictly focused on the relevant trading leg, ignoring historical noise to maximize execution speed.
Zero-Repaint: All historical analysis is strictly non-repainting to ensure backtesting reliability.
How to Use
Timeframes: Optimized for 1m, 2m, 3m, 4m, 5m execution.
Alerts: Configure the robust alert system to notify you only when setups meet your standards (e.g., "Alert only on Rank B+ or higher").
Strategy: Wait for the Status Panel to show a "CONFIRMED" signal. Use the on-screen Position Sizer to execute the trade with the displayed risk parameters.
Stop analyzing; start executing. Welcome to mechanical trading.
----------------------------------------------------------------------------------------------------------------
RISK DISCLAIMER:
The content, tools, and signals generated by this script are strictly for educational and informational purposes only. This script does not constitute financial advice, investment recommendations, or a solicitation to buy or sell any securities, futures, or other financial instruments.
Trading financial markets involves a high degree of risk and is not suitable for all investors. The "Position Sizer" and "Trade Setups" displayed are hypothetical simulations designed to demonstrate the mechanics of the BJN methodology; they do not guarantee future performance.
Use this tool at your own risk. The author assumes no responsibility or liability for any trading losses or damages incurred in connection with the use of this script. Always consult with a qualified financial advisor and practice proper risk management.
RCV Essentials════════════════════════════════════════════
RCV ESSENTIALS - MULTI-TIMEFRAME & SESSION ANALYSIS TOOL
════════════════════════════════════════════
📊 WHAT THIS INDICATOR DOES
This professional-grade indicator combines two powerful analysis modules:
1. TRADING SESSION TRACKER - Visualizes high/low ranges for major global market sessions (NY Open, London Open, Asian Session, etc.)
2. MULTI-TIMEFRAME CANDLE DISPLAY - Shows up to 8 higher timeframes simultaneously on your chart (15m, 30m, 1H, 4H, 1D, 1W, 1M, 3M)
════════════════════════════════════════════
🎯 KEY FEATURES
════════════════════════════════════════════
TRADING SESSIONS MODULE:
✓ Track up to 6 custom trading sessions simultaneously
✓ Real-time high/low range detection during active sessions
✓ Pre-configured for NYO (7-9am), LNO (2-3am), Asian Session (4:30pm-12am)
✓ 60+ global timezone options
✓ Customizable colors, labels, and transparency
✓ Daily divider lines (optional Sunday skip for traditional markets)
✓ Only displays on ≤30m timeframes for optimal clarity
MULTI-TIMEFRAME CANDLES MODULE:
✓ Display 1-8 higher timeframes with up to 10 candles each
✓ Real-time candle updates (non-repainting)
✓ Fully customizable colors (separate bullish/bearish for body/border/wick)
✓ Adjustable candle width, spacing, and positioning
✓ Smart label system (top/bottom/both, aligned or follow candles)
✓ Automatic timeframe validation (only shows TFs higher than chart)
✓ Memory-optimized with automatic cleanup
════════════════════════════════════════════
🔧 HOW IT WORKS
════════════════════════════════════════════
TECHNICAL IMPLEMENTATION:
Session Tracking Algorithm:
• Detects session start/end using time() function with timezone support
• Continuously monitors and updates high/low during active session
• Finalizes range when session ends using var persistence
• Draws boxes using real-time bar_index positioning
• Maintains session ranges across multiple days for reference
Multi-Timeframe System:
• Uses ta.change(time()) detection to identify new MTF candle formation
• Constructs candles using custom Type definitions (Candle, CandleSet, Config)
• Stores OHLC data in arrays with automatic size management
• Renders using box objects (bodies) and line objects (wicks)
• Updates current candle every tick; historical candles remain static
• Calculates dynamic positioning based on user settings (offset, spacing, width)
Object-Oriented Architecture:
• Custom Type "Candle" - Stores OHLC values, timestamps, visual elements
• Custom Type "CandleSet" - Manages arrays of candles + settings per timeframe
• Custom Type "Config" - Centralizes all display configuration
• Efficient memory management via unshift() for new candles, pop() for old
Performance Optimizations:
• var declarations minimize recalculation overhead
• Conditional execution (sessions only on short timeframes)
• Maximum display limits prevent excessive object creation
• Timeframe validation at barstate.isfirst reduces redundant checks
════════════════════════════════════════════
📈 HOW TO USE
════════════════════════════════════════════
SETUP:
1. Add indicator to chart (works best on 1m-30m timeframes)
2. Open Settings → "Trading Sessions" group
- Enable desired sessions (NYO, LNO, AS, or custom)
- Select your timezone from 60+ options
- Adjust colors and transparency
3. Open Settings → "Multi-TF Candles" group
- Enable timeframes (TF1-TF8)
- Configure each timeframe and display count
- Customize colors and layout
READING THE CHART:
• Session boxes show high/low ranges during active sessions
• MTF candles display to the right of current price
• Labels identify each timeframe (15m, 1H, 4H, etc.)
• Real-time updates on the most recent MTF candle
TRADING APPLICATIONS:
Session Breakout Strategy:
→ Identify session high/low (e.g., Asian session 16:30-00:00)
→ Wait for break above/below range
→ Confirm with higher timeframe candle close
→ Enter in breakout direction, stop at opposite side of range
Multi-Timeframe Confirmation:
→ Spot setup on primary chart (e.g., 5m)
→ Verify 15m, 1H, 4H candles align with trade direction
→ Only take trades where higher TFs confirm
→ Exit when higher TF candles show reversal
Combined Session + MTF:
→ Asian session establishes range overnight
→ London Open breaks Asian high
→ Confirm with bullish 15m + 1H candles
→ Enter long with stop below Asian high
════════════════════════════════════════════
🎨 ORIGINALITY & INNOVATION
════════════════════════════════════════════
What makes this indicator original:
1. INTEGRATED DUAL-MODULE DESIGN
Unlike separate session or MTF indicators, this combines both in a single performance-optimized script, enabling powerful correlation analysis between session behavior and timeframe structure.
2. ADVANCED RENDERING SYSTEM
Uses custom Pine Script v5 Types with dynamic box/line object management instead of basic plot functions. This enables:
• Precise visual control over positioning and spacing
• Real-time updates without repainting
• Efficient memory handling via automatic cleanup
• Support for 8 simultaneous timeframes with independent settings
3. INTELLIGENT SESSION TRACKING
The algorithm continuously recalculates ranges bar-by-bar during active sessions, then preserves the final range. This differs from static zone indicators that simply draw fixed boxes at predefined levels.
4. MODULAR ARCHITECTURE
Custom Type definitions (Candle, CandleSet, Config) create extensible, maintainable code structure while supporting complex multi-timeframe operations with minimal performance impact.
5. PROFESSIONAL FLEXIBILITY
Extensive customization: 6 configurable sessions, 8 timeframe slots, 60+ timezones, granular color/sizing/spacing controls, multiple label positioning modes—adaptable to any market or trading style.
6. SMART VISUAL DESIGN
Automatic timeframe validation, dynamic label alignment options, and intelligent spacing calculations ensure clarity even with multiple timeframes displayed simultaneously.
════════════════════════════════════════════
⚙️ CONFIGURATION OPTIONS
════════════════════════════════════════════
TRADING SESSIONS:
• Session 1-6: On/Off toggles
• Time Ranges: Custom start-end times
• Labels: Custom text for each session
• Colors: Individual color per session
• Timezone: 60+ options (Americas, Europe, Asia, Pacific, Africa)
• Range Transparency: 0-100%
• Outline: Optional border
• Label Display: Show/hide session names
• Daily Divider: Dotted lines at day changes
• Skip Sunday: For traditional markets vs 24/7 crypto
MULTI-TF CANDLES:
• Timeframes 1-8: Enable/disable individually
• Timeframe Selection: Any TF (seconds to months)
• Display Count: 1-10 candles per timeframe
• Bullish Colors: Body/Border/Wick (independent)
• Bearish Colors: Body/Border/Wick (independent)
• Candle Width: 1-10+ bars
• Right Margin: 0-200+ bars from edge
• TF Spacing: Gap between timeframe groups
• Label Color: Any color
• Label Size: Tiny/Small/Normal/Large/Huge
• Label Position: Top/Bottom/Both
• Label Alignment: Follow Candles or Align
════════════════════════════════════════════
📋 TECHNICAL SPECIFICATIONS
════════════════════════════════════════════
• Pine Script Version: v5
• Chart Overlay: True
• Max Boxes: 500
• Max Lines: 500
• Max Labels: 500
• Max Bars Back: 5000
• Update Frequency: Real-time (every tick)
• Timeframe Compatibility: Chart TF must be lower than selected MTFs
• Session Display: Activates only on ≤30 minute timeframes
• Memory Management: Automatic cleanup via array operations

Multi-Ticker Anchored CandlesMulti-Ticker Anchored Candles (MTAC) is a simple tool for overlaying up to 3 tickers onto the same chart. This is achieved by interpreting each symbol's OHLC data as percentages, then plotting their candle points relative to the main chart's open. This allows for a simple comparison of tickers to track performance or locate relationships between them.
> Background
The concept of multi-ticker analysis is not new, this type of analysis can be extremely helpful to get a gauge of the over all market, and it's sentiment. By analyzing more than one ticker at a time, relationships can often be observed between tickers as time progresses.
While seeing multiple charts on top of each other sounds like a good idea...each ticker has its own price scale, with some being only cents while others are thousands of dollars.
Directly overlaying these charts is not possible without modification to their sources.
By using a fixed point in time (Period Open) and percentage performance relative to that point for each ticker, we are able to directly overlay symbols regardless of their price scale differences.
The entire process used to make this indicator can be summed up into 2 keywords, "Scaling & Anchoring".
> Scaling
First, we start by determining a frame of reference for our analysis. The indicator uses timeframe inputs to determine sessions which are used, by default this is set to 1 day.
With this in place, we then determine our point of reference for scaling. While this could be any point in time, the most sensible for our application is the daily (or session) open.
Each symbol shares time, therefore, we can take a price point from a specified time (Opening Price) and use it to sync our analysis over each period.
Over the day, we track the percentage performance of each ticker's OHLC values relative to its daily open (% change from open).
Since each ticker's data is now tracked based on its opening price, all data is now using the same scale.
The scale is simply "% change from open".
> Anchoring
Now that we have our scaled data, we need to put it onto the chart.
Since each point of data is relative to it's daily open (anchor point), relatively speaking, all daily opens are now equal to each other.
By adding the scaled ticker data to the main chart's daily open, each of our resulting series will be properly scaled to the main chart's data based on percentages.
Congratulations, We have now accurately scaled multiple tickers onto one chart.
> Display
The indicator shows each requested ticker as different colored candlesticks plotted on top of the main chart.
Each ticker has an associated label in front of the current bar, each component of this label can be toggled on or off to allow only the desired information to be displayed.
To retain relevance, at the start of each session, a "Session Break" line is drawn, as well as the opening price for the session. These can also be toggled.
Note: The opening price is the opening price for ALL tickers, when a ticker crosses the open on the main chart, it is crossing its own opening price as well.
> Examples
In the chart below, we can see NYSE:MCD NASDAQ:WEN and NASDAQ:JACK overlaid on a NASDAQ:SBUX chart.
From this, we can see NASDAQ:JACK was the top gainer on the day. While this was the case, it also fell roughly 4% from its peak near lunchtime. Unlike the top gainer, we can see the other 3 tickers ended their day near their daily high.
In the explanations above, the daily timeframe is used since it is the default; however, the analysis is not constrained to only days. The anchoring period can be set to any timeframe period.
In the chart below, you can observe the Daily, Weekly, and Monthly anchored charts side-by-side.
This can be used on all tickers, timeframes, and markets. While a typical application may be comparing relevant assets... the script is not limited.
Below we have a chart tracking COMEX:GCV2026 , FX:EURUSD , and COINBASE:DOGEUSD on the AMEX:SPY chart.
While these tickers are not typically compared side-by-side, here it is simply a display of the capabilities of the script.
Enjoy!

Change in State of Delivery CISD [AlgoAlpha]🟠 OVERVIEW
This script tracks how price “changes delivery” after failed attempts to push in one direction. It builds swing levels from pivots, watches for those levels to be wicked, and then checks if price delivers cleanly in the opposite direction. When the pattern meets the script’s tolerance rules, it marks a Change in State of Delivery (CISD). These CISD levels are drawn as origin lines and are used to spot shifts in intent, failed pushes, and continuation attempts. A CISD becomes stronger when it forms after opposing liquidity is swept within a defined lookback.
🟠 CONCEPTS
The script first defines structure using swing highs/lows. These levels act as potential liquidity points. When price wicks through a swing, the script registers a mitigation event. After this, it looks for a reversal-style candle sequence: a failed push, followed by a counter-move strong enough to pass a tolerance ratio. This ratio compares how far price expanded away from the failed attempt versus the counter-move that followed. If the ratio is high enough, this becomes a CISD. The idea is simple: liquidity interaction sets context , and the tolerance logic identifies actual intent . CISD levels and sweep markers combine these two ideas into a clean map of where delivery flipped.
🟠 FEATURES
Liquidity tracking: marks swing highs/lows and updates them until expiry
Liquidity sweep confirmation when CISD aligns with recent mitigations
Alert conditions for all key events: mitigations, CISDs, and strong CISDs
🟠 USAGE
Setup : Add the script to your chart. Use it on any timeframe where swing behavior matters. Set the Swing Period for how wide a pivot must be. Set Noise Filter to control how strict the CISD detection is. Liquidity Lookback defines how recent a wick must be to confirm a sweep.
Read the chart : Origin lines mark where the CISD began. A green line signals bullish intent; a red line signals bearish intent. ▲ and ▼ shapes show CISDs that form after liquidity is swept, these mark strong signals for potential entry. Swing dots show recent swing highs/lows. Candle colors follow the latest CISD trend.
Settings that matter : Increasing Swing Period produces fewer but stronger swings. Raising Noise Filter requires cleaner counter-moves and reduces false CISDs. Liquidity Lookback controls how strict the sweep confirmation is. Expiry Bars decides how long swing levels remain active.

Choch Pattern Levels WITH ALERTS [credit to: @BigBeluga]🔵 OVERVIEW
The Choch Pattern Levels WITH ALERTS indicator automatically detects Change of Character (CHoCH) shifts in market structure — crucial moments that often signal early trend reversals or major directional transitions. It plots the structural break level, visualizes the pattern zone with triangle overlays, and tracks delta volume to help traders assess the strength behind each move. Now, an additional feature of alerts have been included!
🔵 CONCEPTS
CHoCH Pattern: A bullish CHoCH forms when price breaks a previous swing high after a swing low, while a bearish CHoCH appears when price breaks a swing low after a prior swing high.
snapshot
Break Level Mapping: The indicator identifies the highest or lowest point between the pivot and the breakout, marking it with a clean horizontal level where price often reacts.
snapshot
Delta Volume Tracking: Net bullish or bearish volume is accumulated between the pivot and the breakout, revealing the momentum and conviction behind each CHoCH.
snapshot
Chart Clean-Up: If price later closes through the CHoCH level, the zone is automatically removed to maintain clarity and focus on active setups only.
🔵 FEATURES
Automatic CHoCH pattern detection using pivot-based logic.
Triangle shapes show structure break: pivot → breakout → internal high/low.
snapshot
snapshot
Horizontal level marks the structural zone with a ◯ symbol.
snapshot
Optional delta volume label with directional sign (+/−).
Green visuals for bullish CHoCHs, red for bearish.
Fully auto-cleaning invalidated levels to reduce clutter.
Clean organization of all lines, labels, and overlays.
User-defined Length input to adjust pivot sensitivity.
snapshot
NEW! - alert system inserted to Pinescript for either: any triangle forms or whether a bullish "green" triangle or bearish "red" triangle forms - providing real-time alerts for whenever timeframe chart you've selected while creating the alert.
🔵 HOW TO USE
Use CHoCH levels as early trend reversal zones or confirmation signals.
Treat bullish CHoCHs as support zones, bearish CHoCHs as resistance.
Look for high delta volume to validate the strength behind each CHoCH.
Combine with other BigBeluga tools like supply/demand, FVGs, or liquidity maps for confluence.
Adjust pivot Length based on your strategy — shorter for intraday, longer for swing trading.
🔵 CONCLUSION
Choch Pattern Levels WITH ALERTS highlights key structural breaks that can mark the start of new trends. By combining precise break detection with volume analytics and automatic cleanup, it provides actionable insights into the true intent behind price moves — giving traders a clean edge in spotting early reversals and key reaction zones with real-time alerts for precision to evaluate and enter markets.

IFVG [#]ICT Concepts by shulktrades
Beginner Concept
IFVG — Inverse Fair Value Gap
Description:
The IFVG indicator identifies and displays Inverse Fair Value Gaps (IFVGs) — price imbalances that have been traded through and closed, representing a complete rebalancing of a prior Fair Value Gap (FVG).
It is designed for traders studying ICT-based market structure and algorithmic delivery concepts, offering a consistent, precise way to visualize these “flipped” gaps directly on their charts.
This indicator does not generate trading signals, alerts, or entries. It serves as a visual confluence and analytical tool, helping traders recognize when a fair value gap has been invalidated and transformed into an IFVG.
How It Works (Conceptually)
Gap Detection
The script tracks consecutive candle structures to identify FVGs — three-candle formations where a price void exists between the first and third candles.
Inverse Confirmation
When price fully closes through a detected FVG (meaning both gap boundaries have been traded and settled), the imbalance is flagged as neutralized, and the script converts it into an Inverse Fair Value Gap (IFVG).
Box Drawing Logic
Each IFVG is displayed as a visual box drawn from the displacement range of the candle that confirmed the closure.
Boxes extend either to the current bar or a user-defined candle limit, providing flexibility for how long historical IFVGs remain visible.
This ensures chart clarity while maintaining accurate visual context of algorithmic rebalancing.
Unique Implementation Features
The IFVG indicator differs from typical open-source FVG tools through its structural logic and visualization method:
Higher-Timeframe Candle Tracking
It can reference higher-timeframe (HTF) candle data to display IFVGs originating from larger structures (for example, showing H1 or H4 inverse gaps on a lower timeframe).
This alignment with HTF context gives traders a broader view of algorithmic delivery behavior.
Specific Timeframe Tracking (Future Integration)
The underlying framework supports selectable timeframe inputs for future updates, allowing users to define which candle data to track for IFVG formation — ensuring full adaptability across multiple timeframe models.
Dynamic End Conditions
Unlike static or persistent zone indicators, each IFVG box can end at the current time or after a custom candle limit.
This avoids overcrowding the chart while maintaining accurate historical context.
Accurate Visual Rendering
The drawing logic ensures that every IFVG box is aligned precisely to candle bodies and wicks, scaling correctly across all chart resolutions.
This eliminates overlap, offset, or visual drift common in generic FVG/IFVG implementations.
How to Use It
Apply the indicator to visualize confirmed Inverse Fair Value Gaps on your chart.
Use the highlighted zones as contextual confluence, not entry triggers.
Adjust settings for box duration and visibility according to your preferred analysis depth.
Integrate with other ICT-based concepts such as liquidity sweeps, order blocks, and displacement analysis for deeper structural insight.
Originality and Purpose
The IFVG indicator is original in its:
Strict focus on confirmed, traded-through FVGs only.
Use of HTF candle tracking for broader algorithmic context.
Dynamic end-of-zone control, determined by user preference or real-time progression.
Accurate visual construction of zones directly tied to candle confirmation logic.
These design choices make it distinct from generic FVG/IFVG indicators and justify its closed-source status, as its logic, rendering precision, and adaptive framework go beyond simple stylistic replication of public scripts.
Important Notes
For educational and analytical use only.
Does not issue alerts, entries, or trade recommendations.
Best suited for traders familiar with ICT delivery and structure concepts.
Always apply personal risk management and confirm bias independently.

LucciThis indicator identifies trade setups based on session liquidity levels and price structure analysis during New York trading sessions.
Unlike basic support/resistance indicators, this system tracks untested session extremes and monitors their interaction with price. It combines break-and-retest mechanics with bounce detection at key liquidity zones, providing multiple entry methodologies within a single framework.
METHODOLOGY:
The system maps high/low points from each trading session (Asia: 6PM-3AM, London: 3AM-8AM, NY: 8AM-5PM EST) and monitors price behavior around these levels. It identifies two primary setup types: momentum continuation after level breaks and reversal bounces at untested extremes. Visual differentiation shows which levels remain untested (darker) versus swept levels (lighter).
SETUP IDENTIFICATION:
Break & Retest Signals:
- Detects breaks of NY Open range (15-minute candle at 8:00 AM EST)
- Waits minimum bars after break before validating retest
- Triggers when price returns to level within tolerance zone
Bounce Signals:
- Identifies approaches to untested session highs/lows
- Optional wick confirmation for reversal validation
- Signals when price rejects from liquidity zone
CONFIGURATION OPTIONS:
Entry Parameters:
- Min Bars After Break: 1-10 (delay before retest valid)
- Retest Tolerance: 0.1-10 points (precision of level test)
- Bounce Zone: 0.5-5 points (distance from level)
- Wick Confirmation: On/off reversal filter
Risk Management:
- Risk Reward Options: 1:3, 1:5, or Custom (1:1 to 1:10)
- Stop Loss: Configurable in points
- Max Daily Signals: 1-5 trade limiter
- Trading Hours: Customizable active window
Visual Elements:
- Session Levels: Orange (Asian), Yellow (London), Blue (NY)
- Signal Markers: Triangles (B&R), Diamonds (Bounce)
- TP/SL Lines: Automatic calculation and display
- Info Table: Shows bias, untested levels, daily signals
OPTIMAL USAGE:
Trading Windows:
- 9:30-11:00 AM EST: Primary trading window
- First touch of untested levels: Highest probability
- 15-minute timeframe: Recommended for futures
- Volume filter: Optional quality enhancement
Signal Prioritization:
- Untested levels provide stronger reactions
- Multiple confirmations increase probability
- Respect market structure and session context
- Combine with volume for filtering
TECHNICAL SPECIFICATIONS:
- Multi-timeframe: Uses 15-minute data for NY Open
- Session-based: Resets levels at session transitions
- Alert system: Detailed messages with levels
- Position tracking: Manages active trades visually
IMPORTANT NOTES:
This tool maps liquidity zones based on session extremes and price structure. No trading system guarantees profits. Combine with market context and proper risk management. Designed for active intraday trading on liquid instruments.
The indicator provides objective level identification while requiring trader discretion for optimal results.

Inflection Nexus - SPAInflection Nexus - SPA: Self-Adapting Trend Reversal System
Overview
Inflection Nexus - SPA (Shadow Portfolio Adaptation) is an adaptive trend-following indicator that automatically optimizes its parameters in real-time through a unique shadow testing methodology. Unlike traditional static indicators that use fixed ATR periods and multipliers, this system continuously evaluates multiple parameter combinations in the background and dynamically adjusts to current market conditions without manual intervention.
What Makes This Original
The core innovation is the Shadow Portfolio Adaptation (SPA) engine, which runs parallel virtual portfolios in the background to test different ATR period and multiplier combinations. The system tracks the performance of these shadow portfolios over rolling windows and automatically switches to the best-performing parameter set. This creates a self-improving indicator that adapts to changing volatility regimes, trending vs. ranging markets, and shifting market dynamics without requiring user reconfiguration.
This is not simply a combination of existing indicators. The SPA engine is a novel approach that transforms the traditional Supertrend methodology from a static tool into an adaptive system with built-in machine learning principles.
Core Components and How They Work Together
1. Adaptive Supertrend Foundation
The base trend detection uses an ATR-based Supertrend calculation with your chosen source (default: hlcc4 for smoothness). Rather than using fixed parameters, the system starts with your configured ATR Period and Multiplier as baseline values.
2. Shadow Portfolio Adaptation Engine
This is where the innovation happens. The system simultaneously tests multiple parameter variations in the background:
- Creates shadow portfolios with different ATR periods (spanning from your base period minus a range to plus a range)
- Tests different ATR multipliers for each period
- Each shadow portfolio tracks virtual trade performance over a configurable lookback window
- Calculates a confidence score based on win rate, profit factor, and trade frequency
- Automatically switches to the best-performing parameter combination
- Implements smooth transitions to prevent whipsaw from parameter changes
The adaptation happens continuously, allowing the system to shift from tight, responsive settings during low volatility to wider, more conservative settings during high volatility periods.
3. Signal Generation Logic
The system offers two complementary signal modes:
Reversal Mode (default): Identifies potential trend exhaustion points. A sell signal requires price to make a new structural high while the trend is bullish, then flip bearish. This captures the exact moment a trend runs out of momentum. The "Require New High/Low During Trend" filter ensures signals only occur at genuine extremes, not mid-range noise.
Breakout Mode (optional): Identifies trend continuation. Signals occur when price breaks to new highs/lows in the direction of the current trend, confirming momentum rather than reversing it.
4. Multi-Layer Confirmation Filters
Each signal passes through optional quality filters:
- RSI Momentum Filter : Ensures buy signals occur after RSI has been oversold (preventing buying into exhaustion) and sell signals occur after RSI has been overbought
- Volume Spike Confirmation : Requires increased volume relative to recent average, confirming conviction behind the move
- Major Level Filter : Ensures signals only occur after significant price moves (measured in ATR multiples), filtering out minor fluctuations
5. Risk Management Integration
The dashboard displays real-time metrics including:
- Current regime classification (Trending, Volatile, Ranging)
- Shadow portfolio performance tracking
- Adaptive confidence scores
- Parameter evolution log
- Market heat map showing probability zones
How to Use This Indicator
Setup:
1. Apply the indicator to your chart
2. Start with default settings for your first session
3. The SPA engine requires a warm-up period (controlled by "Learning Window") to gather sufficient data - expect optimal adaptation after 100-200 bars
4. Enable the dashboard to monitor the adaptation process and current market regime
Signal Interpretation:
- Long signals (green triangles below price): Enter long when the system detects a potential bullish reversal or breakout
- Short signals (red triangles above price): Enter short when the system detects a potential bearish reversal or breakout
- Dashboard color coding : Green regime = favorable for trend-following, Yellow = volatile (use caution), Red = choppy (consider reducing position size)
Best Practices:
- Use Reversal Mode in swing trading environments where you want to catch major turning points
- Use Breakout Mode in strong trending markets where you want confirmation entries
- Enable both modes for comprehensive coverage, but filter by the regime indicator
- The "Min Bars Between Signals" setting prevents over-trading - start at 10-12 bars for most timeframes
- Pay attention to the "Map Heat" metric - higher active cells indicate more defined market structure
Parameter Optimization:
The system is designed to self-optimize, but you can guide it:
- Sensitivity : Lower values (15-25) for intraday scalping, higher values (40-60) for swing trading
- ATR Period : Your baseline starting point - the SPA engine will explore around this value
- Multiplier : Your baseline band width - the engine tests variations of this
- Learning Window : How many bars of data the shadow portfolios evaluate (200-500 for most markets)
- Adaptation Frequency : How often the system checks for better parameters (30-50 bars balances responsiveness and stability)
Dashboard Insights:
The three-panel dashboard provides real-time intelligence:
- Panel A shows current signal state, trend direction, and overall market regime
- Panel B displays shadow portfolio statistics, confidence scores, and the adaptation log
- The regime classification helps you understand if current market conditions favor trending strategies or if you should reduce exposure
Calculation Methodology
The system operates in three phases:
Phase 1 - Base Calculation:
- Calculates ATR using your specified period and method (RMA for smoothness)
- Identifies structural highs/lows using the sensitivity parameter
- Computes initial Supertrend bands: Price ± (ATR × Multiplier)
Phase 2 - Shadow Testing:
- Creates a grid of parameter combinations (ATR periods from base-5 to base+15, multipliers from base-0.5 to base+1.0)
- For each combination, simulates trade entries and exits over the learning window
- Tracks metrics: win rate, profit factor, max drawdown, trade count
- Calculates a confidence score using weighted metrics (win rate × 0.4 + profit factor × 0.3 + normalized trade frequency × 0.3)
Phase 3 - Adaptive Selection:
- Every N bars (adaptation frequency), ranks all shadow portfolios by confidence score
- Selects the highest-scoring parameter set
- Implements parameter change with transition smoothing to prevent signal disruption
- Logs the change and updates the dashboard
This creates a continuous feedback loop where the indicator learns from recent market behavior and adjusts its sensitivity accordingly.
Ideal Market Conditions
Best Performance:
- Markets with clear swing structure (forex majors, liquid stocks, major indices)
- Timeframes from 5-minute to daily (indicator adapts across timeframes)
- Trending markets with periodic consolidations (where reversals are meaningful)
Challenging Conditions:
- Extremely low liquidity assets (insufficient price action for adaptation)
- Very low timeframes (1-minute or below) where noise dominates
- Markets in deep consolidation for extended periods (the system will reduce signal frequency appropriately)
Technical Notes
- The indicator uses lookback functions with a 5000-bar maximum, ensuring sufficient historical context
- Shadow portfolios are lightweight - they don't execute actual trades, only track hypothetical P&L
- The confidence-based selection prevents the system from chasing random variations
- The minimum bars between signals prevents over-fitting to short-term fluctuations
- All calculations are performed on closed bars to prevent repainting
Recommended Settings by Trading Style
Day Trading (5-15 min charts):
- Sensitivity: 20-30
- ATR Period: 14-20
- Multiplier: 1.2-1.5
- Min Bars Between Signals: 8-12
- Enable RSI Filter: Yes
Swing Trading (1H-4H charts):
- Sensitivity: 30-50
- ATR Period: 20-30
- Multiplier: 1.5-2.0
- Min Bars Between Signals: 10-15
- Enable Major Levels Only: Optional
Position Trading (Daily charts):
- Sensitivity: 50-80
- ATR Period: 30-40
- Multiplier: 2.0-2.5
- Min Bars Between Signals: 5-10
- Enable Breakout Mode: Consider
The SPA engine will refine these starting points automatically based on actual market performance.
Important Disclaimers
This indicator is a technical analysis tool designed to identify potential trend changes and continuation points. It should not be used as a standalone trading system. Always combine with proper risk management, position sizing, and additional confirmation methods. Past performance of the adaptation engine does not guarantee future results. The shadow portfolio system is designed to improve parameter selection, but no indicator can predict market movements with certainty.
— Dskyz, Trade with insight. Trade with anticipation.

VOLUME PROFILE WITH FOOTPRINT AND IMBALANCEVOLUME PROFILE WITH FOOTPRINT AND IMBALANCE
A professional-grade market structure analysis tool that combines three powerful trading concepts into one comprehensive indicator: Volume Profile, Footprint Charts, and Imbalance detection. This script provides optimum-level market analysis for trading.
KEY FEATURES
1. Multi-Day Volume Profile
Customizable Row Density: Adjust price level granularity for precise volume distribution analysis
Point of Control (POC): Automatically identifies the price level with highest traded volume
Value Area Calculation: Highlights the price range containing 70% of the day's volume (customizable percentage)
Value Area High (VAH) & Low (VAL): Clear demarcation of institutional acceptance zones
Horizontal Volume Bars: Visual representation of buying vs. selling pressure at each price level
Color-Coded Volume: Distinguishes between value area volume and outlier volume for better visual clarity
2. Previous Day Reference Levels
Previous Day High/Low (PDH/PDL): Critical support/resistance levels from prior session
Previous Day POC: Yesterday's highest volume node - often acts as magnetic price level
Previous Day VAH/VAL: Prior session's value boundaries for gap analysis and mean reversion setups
All previous day levels extend into current session with customizable colors and line styles
3. Virgin Point of Control (VPOC)
Untouched POC Identification: Automatically tracks POC levels that haven't been revisited by price
Real-time Validation: Monitors whether subsequent price action has tested each historical POC
Multi-Day Tracking: Maintains VPOC levels across multiple sessions until filled
High-Probability Targets: Virgin POCs often act as magnets for future price action
4. Footprint Zone Analysis
Footprint Zone Detection: Identifies price levels touched only once during the session
Automated Ribbon Consolidation: Groups consecutive Footprint Zone into visual zones
Price Range Sensitivity: Automatically adjusts granularity based on instrument price
Historical Persistence: Consolidates previous day's footprint zones for multi-day context
Auction Failure Zones: Footprint Zone often indicate areas of poor liquidity and potential reversal points
5. Three-Candle Imbalance Detection
Bullish Imbalance
Bearish Imbalance
Visual Markers: Clear circular indicators on all three candles forming the imbalance
Customizable Colors: Separate colors for bullish and bearish imbalances
Gap Validation: Ensures meaningful price displacement before flagging imbalance

Asian, UK & NY SessionTimes and Day Highs and LowsWhat It Does
The Asian, UK & NY Sessions indicator automatically identifies and highlights the three major global trading sessions on your chart.
For each session, it:
Detects session time in its local timezone.
Tracks the session’s highest and lowest prices.
Plots colored horizontal lines to show those levels throughout the trading day.
Optionally shades each session’s background in its signature color for instant visual context:
🟡 Asian Session: Yellow background
🔴 London Session: Red background
🔵 New York Session: Blue background
This helps traders see how price reacts within and between sessions — spotting overlaps, liquidity zones, and daily ranges.
⚙️ Inputs and Variables
Input Description
Extend lines until next session start (extendLines) Extends each session’s high/low lines forward until the next session begins.
Show prices in scale column (showScaleValues) Controls whether the price labels for session highs/lows appear on the chart’s right-hand price scale.
Show All Session Highs & Lows (showAllHighsLows) Master switch — turn this off to hide all session lines instantly, keeping the chart clean.
Show Session Backgrounds (showBackgrounds) Turns all background shading on or off. When off, all session colors disappear.
Background Opacity (bgOpacityAll) Adjusts the transparency for all session backgrounds (0 = solid, 100 = fully transparent).
🎨 Visual Color Scheme
Session Background High/Low Line
Asian Yellow Green
London Red Red
New York Blue Blue
Each color has a consistent role — making it easy to distinguish sessions even in replay or live view.
Price Tracking:
For each session, the indicator resets High and Low when the new session starts, then updates them as bars print.
Display Control:
If lines or backgrounds are disabled via settings, they’re completely hidden (no clutter, no partial transparency).
💡 How Traders Use It
Identify daily ranges in each global session.
Compare volatility between markets.
Align entries or exits with session transitions.
Observe how price respects previous session highs/lows.
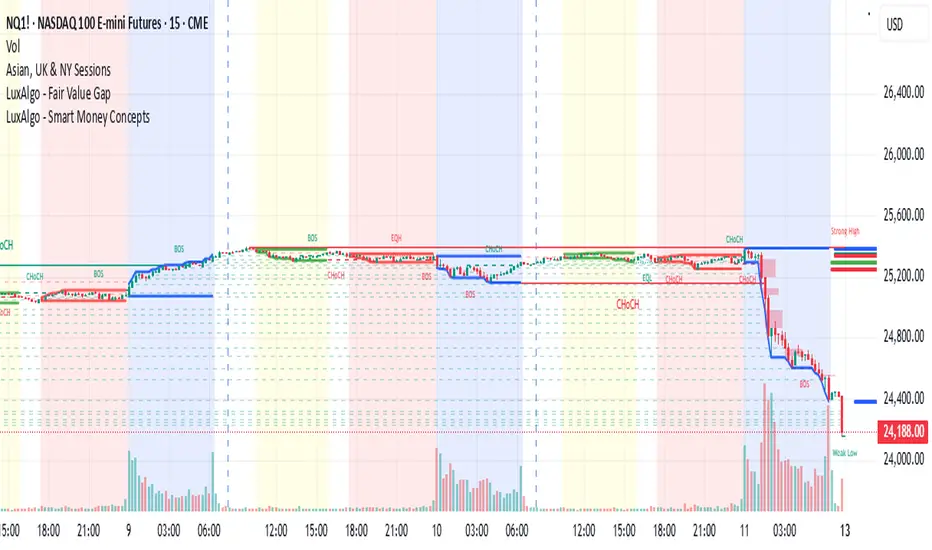
BTC TOPperThe BTC TOPper indicator is a sophisticated technical analysis tool designed to identify critical price levels where Bitcoin's weekly Simple Moving Average (SMA) intersects with historically significant All-Time High (ATH) levels. This indicator is particularly valuable for long-term trend analysis and identifying potential reversal zones in Bitcoin's price action.
Key Features:
🔹 Weekly SMA Analysis: Uses a 200-period Simple Moving Average on weekly timeframe to smooth out short-term volatility and focus on long-term trends
🔹 Persistent Historical ATH Tracking: Automatically detects and "freezes" ATH levels that have been held for more than one year, creating persistent reference levels
🔹 Multi-Level Cross Detection: Tracks up to 10 different frozen ATH levels simultaneously, providing comprehensive historical context
🔹 Visual Cross Alerts: Highlights entire weeks with red background when the weekly SMA crosses any frozen ATH level, making signals impossible to miss
🔹 Advanced Smoothing Options: Includes optional secondary moving averages (SMA, EMA, SMMA, WMA, VWMA) with Bollinger Bands for enhanced analysis
🔹 Customizable Parameters: Adjustable SMA length, offset, and smoothing settings to fit different trading strategies
How It Works:
ATH Detection: Continuously monitors for new all-time highs
Level Freezing: After an ATH is held for 1+ year, it becomes a "frozen" historical level
Cross Monitoring: Watches for intersections between the 200-week SMA and any frozen ATH level
Signal Generation: Highlights the entire week when a cross occurs, providing clear visual alerts
Trading Applications:
Long-term Trend Analysis: Identify when Bitcoin approaches historically significant resistance levels
Reversal Zone Detection: Spot potential areas where price might reverse based on historical context
Support/Resistance Confirmation: Use frozen ATH levels as dynamic support and resistance zones
Market Structure Analysis: Understand how current price relates to historical market cycles
Best Practices:
Use on weekly timeframe for optimal results
Combine with other technical indicators for confirmation
Pay attention to multiple frozen levels clustering in the same price range
Consider market context and fundamentals alongside technical signals
Settings:
Length: 200 (default) - SMA period
Source: Close price
Smoothing: Optional secondary MA with multiple types available
Bollinger Bands: Optional volatility bands around secondary MA
This indicator is ideal for Bitcoin traders and analysts who want to understand the relationship between current price action and historical market structure, particularly useful for identifying potential major reversal zones based on historical ATH levels.

ATR SPREADThis is a comprehensive ATR SPREAD indicator for TradingView that combines volatility monitoring with spread analysis. Here's what it does and why it's useful:
Core Functionality
ATR Progress Tracking:
Monitors how much of the daily ATR (Average True Range) has been "consumed" during the current trading day
Calculates progress from two reference points: day's open and previous day's close
Displays progress as percentages or absolute values
Provides color-coded visual feedback (green → yellow → orange → red) based on ATR consumption levels
Spread Monitoring with Advanced Filtering:
Tracks current market spreads using multiple methods (minute high-low ranges, tick-to-tick differences)
Calculates rolling average spread to establish baseline conditions
Implements sophisticated filtering to exclude anomalous spread readings that could skew analysis
Key Features
Smart Filtering System:
Automatically filters out abnormal spreads during session opens
Excludes spreads that are too large relative to price or ATR
Removes outliers that exceed normal spread multiples
Maintains data quality for accurate analysis
Multi-Level Alert System:
ATR threshold alerts (50%, 80%, 100% consumption)
Customizable warning threshold (default 70%)
Spread expansion warnings and alerts
Session start notifications
Professional Dashboard:
Customizable information panel showing real-time metrics
Multiple positioning options and visual themes
Displays ATR status, progress percentages, current/average spreads
Color-coded status indicators for quick assessment
Trading Applications
Risk Management:
Helps traders understand how much daily volatility has been used up
Assists in position sizing based on remaining expected movement
Identifies periods of unusual market conditions
Market Condition Assessment:
Monitors liquidity conditions through spread analysis
Detects when spreads widen beyond normal levels
Filters out unreliable data during volatile periods
Entry/Exit Timing:
High ATR consumption may suggest limited further movement
Low ATR consumption early in the day might indicate potential for larger moves
Spread conditions help assess execution quality expectations
This indicator is particularly valuable for intraday traders, scalpers, and anyone who needs to monitor market microstructure conditions alongside volatility metrics. It provides a comprehensive view of both price movement potential (ATR) and execution environment quality (spreads) in a single, professional-grade tool.
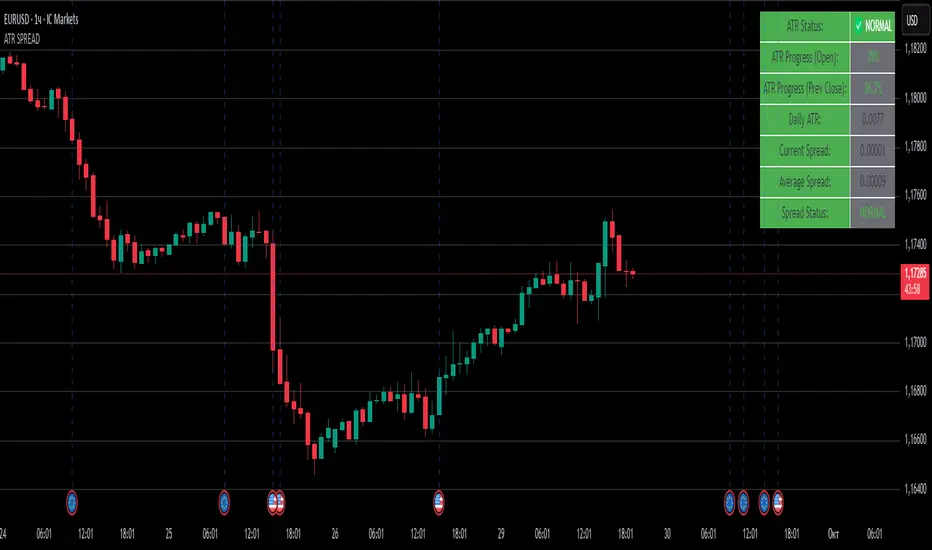
Special Red & Green CandlesCore Concept
The strategy identifies potential reversal points by looking for candles that show strong rejection (engulfing behavior) at key technical levels across multiple timeframes, combined with specific Fibonacci and volatility conditions.
Key Components
Multi-Timeframe Pivot System
Calculates Daily, Weekly, and Monthly pivot points (Standard & CPR methods)
Tracks traditional pivots (PP, R1-R4, S1-S4) and Central Pivot Range (CPR) values
Includes VWAPs (VWAP, 50-period, 250-period SMAs)
Dynamic Volatility Filter
Uses timeframe-based multipliers to adapt to different chart resolutions:
dynamicMultiplier: Defines minimum candle size requirement (0.015%-0.4% of close)
dynamicMultiplierS: Defines maximum candle size filter (0.025%-0.55% of close)
Special Candle Conditions
For Special Red Candles (Bearish Reversal):
Red candle (close < open)
Open below at least one pivot point (any timeframe)
High touches at least one pivot point
Close below 38.2% Fibonacci level of candle range
Current high is 5-bar highest but low isn't 8-bar lowest
Meets volatility conditions (absolute gap > 0.7% of close)
For Special Green Candles (Bullish Reversal):
Green candle (close > open)
Open above at least one pivot point
Low touches at least one pivot point
Close above 61.8% Fibonacci level
Current low is 5-bar lowest but high isn't 8-bar highest
Meets same volatility requirement
Additional Features
Gap Analysis Table: Shows relationships between key daily/weekly levels
Visual Indicators: Colors background, plots labels, and Fibonacci levels
Comprehensive Level Tracking: Monitors 30+ different pivot points across all timeframes
Trading Logic
This is essentially a fade-the-extreme-move strategy that identifies:
Candles that have significant range (volatility filter)
That show clear rejection at important technical levels
Across multiple timeframes simultaneously
With Fibonacci confluence for additional confirmation
Potential Use Cases
Swing Trading: Identifying reversal points in larger moves
Day Trading: Using lower timeframe signals for intraday reversals
Position Sizing: The strength of confluence could determine trade size
Risk Management
The strategy includes inherent risk controls through:
Multiple confirmation requirements (reduces false signals)
Volatility filters (avoids choppy market conditions)
Multi-timeframe confluence (increases signal reliability)
This is a sophisticated institutional-grade approach that combines traditional pivot analysis with modern volatility-based filtering and Fibonacci theory.
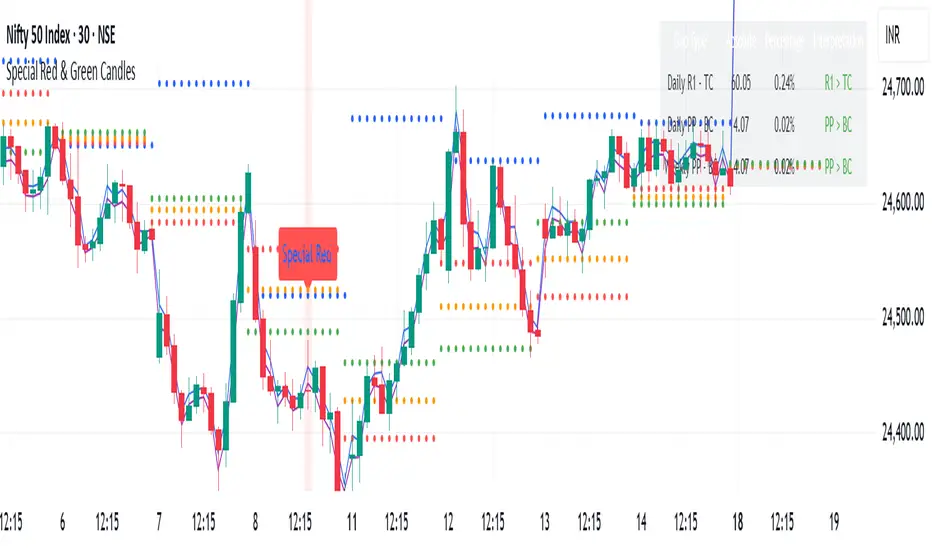
Consecutive Close ScannerOverview
Continuous Close Scanner (CCS) highlights and quantifies runs of consecutive bullish or bearish closes. The indicator draws boxes around qualifying runs (configurable minimum consecutive closes), optionally displays the percent move for each run, counts run starts inside a configurable lookback window, and can show the immediate reverse move until two confirming bars on the opposite side.
Key features
• Detects runs of N consecutive closes (input Consecutive bars).
• Shades active runs with colored boxes and optionally prints percent move.
• Counts how many qualifying runs started within the lookback window (table).
• Optional reverse-move tracker: shows live and final reverse move after a run ends (stops when two confirming opposite closes occur).
• Configurable colors, transparency, table position, and lookback.
• Built in safeguards for TradingView limits (box/label caps configured).
How it works (brief)
When the number of consecutive bullish (close>open) or bearish (close