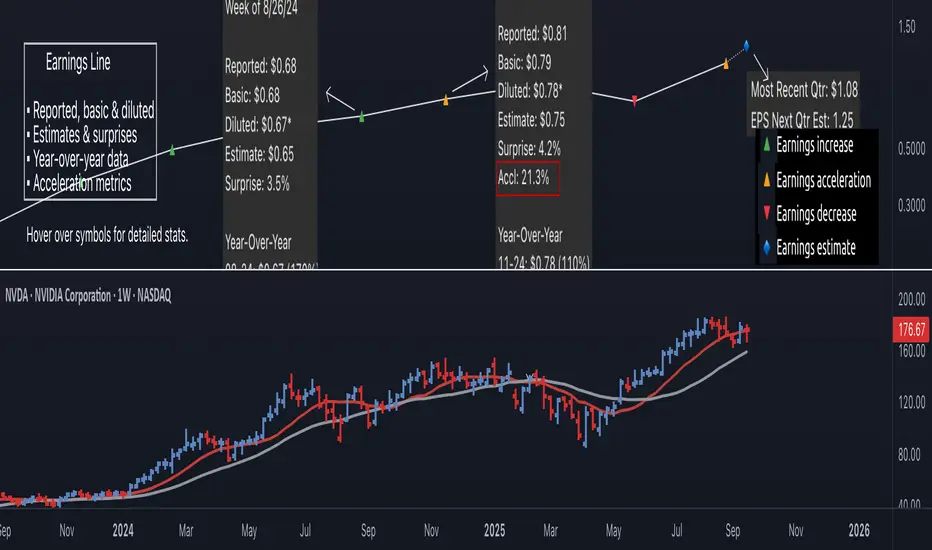
MACD Liquidity Tracker SystemMACD Liquidity Tracker System
🔹 Enhanced MACD with candle coloring, entry markers, and customizable signal logic.
🧠 Features:
This tool combines a color-coded MACD histogram with signal-based candle colors and small shape markers (🔼🔽) for clear market momentum and entry visualization.
📊 Visuals:
MACD Histogram (Sub-panel):
4 dynamic colors to show momentum direction:
🔹 Bright Blue = MACD > 0 & rising (strong bullish)
🔹 Dark Blue = MACD > 0 & falling (weakening bullish)
🔹 Bright Magenta = MACD < 0 & falling (strong bearish)
🔹 Dark Magenta = MACD < 0 & rising (weakening bearish)
Price Candles (Main Chart):
🔹 Bright Blue = Active Long signal
🔹 Bright Magenta = Active Short signal
Entry Markers:
🔼 Blue triangle (below candle) = Start of Long
🔽 Magenta triangle (above candle) = Start of Short
⚙️ System Types (select in settings):
Normal:
🔹 Long = MACD > 0
🔹 Short = MACD < 0
Fast: (Based on histogram color)
🔹 Long = Bright Blue OR Dark Magenta
🔹 Short = Dark Blue OR Bright Magenta
Safe:
🔹 Long = Only Bright Blue
🔹 Short = All other colors
🔔 Alerts:
Alerts trigger only on the first bar of a new Long/Short signal.
Easy to set up using TradingView’s alert system.
📌 How to Use:
Add the indicator to your chart
Open settings and select a System Type
Adjust MACD parameters if needed
Use histogram color + candle color for momentum and signal confirmation
Set alerts for clean entries if desired
💡 Ideal for traders seeking visual clarity and flexible MACD-based strategies.
Cerca negli script per "track"
Volume & ATR Projection Tracker w/ Table & Alerts# README: Volume & ATR Projection Tracker (Pine Script Indicator)
## Overview
This Pine Script indicator for TradingView is designed to help traders analyze volume activity and potential short-term price volatility. It plots volume bars, calculates a moving average of volume, highlights unusual volume spikes (differentiating between up and down bars), and projects potential price ranges for upcoming hours based on Average True Range (ATR). It also provides a status table and configurable alerts.
**Disclaimer:** This indicator provides informational analysis and projections based on historical data and volatility. It does **not** provide guaranteed price predictions or financial advice. Trading involves substantial risk. Always do your own research and consult with a qualified financial advisor.
## Features
* **Volume Plotting:** Displays volume as a histogram in a separate panel.
* **Volume Moving Average:** Calculates and plots a configurable MA (SMA, EMA, WMA) of volume.
* **Unusual Volume Detection:** Identifies bars where volume significantly exceeds its moving average (based on a user-defined multiplier).
* **Differentiated Volume Analysis:**
* Colors volume bars differently based on whether unusual volume occurred on an up-bar (Close > Open), down-bar (Close < Open), or neutral bar (Close == Open).
* Plots different spike markers (up/down triangles) on the price chart for unusual volume on up/down bars.
* **ATR Volatility Projections:**
* Calculates the Average True Range (ATR) as a measure of recent volatility.
* Projects a potential price range (Close +/- ATR \* Multiplier) for a specified number of future hours.
* Plots these ranges as dashed lines and labels on the price chart.
* **Important:** These are volatility-based *ranges*, not directional predictions.
* **Status Table:** Displays a concise summary table on the chart including:
* Current Volume Status (Normal, High (Up), High (Down), High (Neut)).
* Current Volume compared to its MA (as a percentage).
* The projected ATR range for the next hour.
* **Configurable Alerts:** Provides alert conditions for:
* Unusual Volume detection.
* Volume crossing above its MA.
* Volume crossing below its MA.
* **Customizable Inputs:** Allows users to configure MA settings, volume threshold, ATR settings, projection hours, trading session times, and colors.
## How it Works
1. **Volume Analysis:**
* Calculates a Moving Average (SMA, EMA, or WMA) of the volume over a specified length (`MA Length`).
* Compares the current bar's volume to this MA. If `Volume > MA * Unusual Vol Multiplier`, the volume is flagged as "unusual".
* Checks if the unusual volume occurred on a bar where `Close > Open` (Up), `Close < Open` (Down), or `Close == Open` (Neutral).
* Colors the volume bars and plots spike markers based on this differentiated status.
2. **ATR Projections:**
* Calculates the ATR over a specified length (`ATR Length`).
* At the start of each hour *within the defined Trading Session*:
* Calculates an upper projection level: `Current Close + (Current ATR * ATR Multiplier)`.
* Calculates a lower projection level: `Current Close - (Current ATR * ATR Multiplier)`.
* Stores these levels for the specified number of `Projection Hours Ahead`.
* Draws dashed lines and labels on the price chart representing these hourly ranges for the future, but only if they are within TradingView's 500-bar drawing limit from the current bar.
3. **Status Table:**
* Updates on the last bar of the chart.
* Displays the current differentiated volume status, the percentage difference between current volume and its MA, and the calculated ATR range for the *next* hour.
4. **Alerts:**
* Uses `alertcondition()` to create trigger conditions based on `unusualVolumeBase`, `vol_cross_above`, and `vol_cross_below`. Users can create alerts based on these conditions in the TradingView UI.
## Input Settings
The indicator settings are organized into groups:
**Group 1: Volume Analysis Settings**
* **MA Length:** (Default: 20) Number of bars for the volume MA calculation.
* **MA Type:** (Default: SMA) Type of moving average (SMA, EMA, WMA).
* **Unusual Vol Multiplier:** (Default: 2.0) Threshold for detecting unusual volume (Volume > MA * Multiplier).
* **Show Volume Spikes:** (Default: true) Toggle visibility of triangle markers on the price chart.
* **Show Volume MA:** (Default: true) Toggle visibility of the MA line on the volume panel.
**Group 2: ATR Projection Settings**
* **ATR Length:** (Default: 14) Number of bars for the ATR calculation.
* **ATR Multiplier:** (Default: 1.5) Factor applied to ATR to determine the projection range width. Higher values create wider ranges.
* **Projection Hours Ahead:** (Default: 8) How many hours forward to calculate and display projections.
* **Show Projections:** (Default: true) Toggle visibility of projection lines and labels on the price chart.
**Group 3: Session & Colors**
* **Trading Session:** (Default: "0930-1600") Defines the hours during which projections are calculated. **Crucial:** Format is HHMM-HHMM based on the exchange timezone (see Timezone Note below).
* **Normal Vol Color:** (Default: blue) Color for volume bars when volume is not unusual.
* **Volume MA Color:** (Default: yellow) Color of the volume MA line.
* **Unusual Vol (Up Bar) Color:** (Default: light green) Color for unusual volume bars where Close > Open.
* **Unusual Vol (Down Bar) Color:** (Default: light red) Color for unusual volume bars where Close < Open.
* **Unusual Vol (Neutral Bar) Color:** (Default: light gray) Color for unusual volume bars where Close == Open.
* **Projection Line Color:** (Default: orange) Color of the dashed projection range lines.
* **Proj Label Bg Color:** (Default: semi-transparent gray) Background color for projection labels.
* **Proj Label Text Color:** (Default: white) Text color for projection labels.
## Timezone Note
The `Trading Session` input relies on a timezone setting within the `is_in_session` function in the code (currently hardcoded to `"UTC-4"` as an example for US Eastern Time). **You may need to edit the script code** to change this timezone string (e.g., `"America/New_York"`, `"Europe/London"`, `"Asia/Tokyo"`) to match the exchange time of the instrument you are trading. Consult Pine Script documentation for valid timezone strings.
## Limitations
* **Drawing Limit:** TradingView limits drawing objects (lines, labels) to a maximum of ~500 bars into the future from the current bar. On lower timeframes, the script automatically stops drawing projections that exceed this limit.
* **Projection vs. Prediction:** The ATR ranges are based on past volatility and are *not* price predictions. The market can easily move outside these projected ranges.
* **Alerts:** Alerts for price crossing the projected future levels are not implemented due to technical complexity in Pine Script.
## Disclaimer
Trading financial markets involves substantial risk of loss and is not suitable for all investors. The information provided by this indicator is for educational and informational purposes only and does not constitute financial advice, investment advice, trading advice, or any other sort of advice. You should not make any investment decision based solely on the information provided by this indicator. Past performance is not indicative of future results.
ATH & 52-Week High Tracker### **Indicator Name: ATH & 52-Week High Tracker**
📌 **Description:**
This indicator provides a **real-time table** displaying key stock statistics to help traders analyze price levels relative to historical highs. It includes:
✔️ **All-Time High (ATH)** price
✔️ **% Change from ATH**
✔️ **52-Week High** price
✔️ **% Change from 52-Week High**
By using this indicator, traders can quickly identify how far a stock has retraced from its **historical peaks**, which can be useful for momentum trading, breakout strategies, and trend analysis.
📊 **What You Get with This Indicator:**
✅ A clear **visual table** with important stock data
✅ Quick reference to **historical price levels**
✅ Helps in identifying potential **breakout or recovery zones**
✅ Useful for both **intraday and swing traders**
⚠️ **Disclaimer:**
This indicator is for **informational purposes only** and should not be considered **financial advice, a trading strategy, or a buy/sell signal.** Always conduct your own analysis and risk management before making trading decisions. 🚀📈
Let me know if you need any refinements! 😊
Mongoose Market Tracker
**Mongoose Market Tracker**
The **Mongoose Market Sentinel** script is a custom indicator designed to help traders identify unusual market activity that may indicate potential manipulation. This script uses dynamic volume and price action analysis to highlight areas where sudden spikes in volume or irregular candle structures occur.
### Features:
- **Volume Spike Detection**: Flags areas where trading volume significantly deviates from the average, potentially signaling manipulation or abnormal market behavior.
- **Wick-to-Body Ratio Analysis**: Detects candles with disproportionate wicks compared to their bodies, which may indicate price manipulation or liquidity hunting.
- **Auto-Adjusting Thresholds**: Automatically optimizes detection parameters based on the selected time frame, making it suitable for both short-term and long-term analysis.
- **Visual Alerts**: Highlights suspicious activity directly on the chart with clear labels and background coloring, designed for easy readability in dark mode.
- **Customizable Alerts**: Allows users to set notifications for flagged events, ensuring timely awareness of potential risks.
### Intended Use:
This script is a tool for monitoring market behavior and is not a standalone trading strategy. Traders should use it as a supplementary analysis tool alongside other indicators and market knowledge. Always conduct your own research and practice risk management when making trading decisions.
Bitcoin Pi Cycle TrackerThe Bitcoin Pi Cycle Tracker is based on the widely recognized Pi Cycle Top Indicator, a concept used to identify potential market cycle tops in Bitcoin's price. This implementation combines the 111-day Simple Moving Average (SMA) and the 350-day SMA (multiplied by 2) to detect key crossover points. When the 111-day SMA crosses above the 350-day SMA x2, it signals a potential market peak.
Key Features:
Plots the 111-day SMA (blue) and the 350-day SMA x2 (red) for clear visualization.
Displays visual markers and vertical lines at crossover points to highlight key moments.
Sends alerts for crossovers, helping traders stay ahead of market movements.
This tool is an implementation of the Pi Cycle concept originally popularized by Bitcoin market analysts. Use it to analyze historical price cycles and prepare for significant market events. Please note that while the Pi Cycle Indicator has been historically effective, it should be used alongside other tools for a comprehensive trading strategy.
MultiSector Performance Tracker [LuxAlgo]The MultiSector Performance Tracker tool shows the overall performance of different crypto market sectors within a selected time frame, overlaid on a single chart for easy comparison.
Users can customize the time frame to suit their specific needs, whether daily, weekly, monthly, or yearly.
🔶 USAGE
The tool displays the performance of up to 6 crypto sectors within a selected time period, such as each day, week, month or year, or from the beginning of the year for any of the last 4 years.
The sectors and tickers within each sector are as follows:
Layer 1: CRYPTOCAP:ETH CRYPTOCAP:SOL CRYPTOCAP:TON
Layer 2: SEED_DONKEYDAN_MARKET_CAP:MATIC TSX:MNT AMEX:ARB
CEX: CRYPTOCAP:BNB CRYPTOCAP:OKB NYSE:BGB
DEX: CRYPTOCAP:UNI LSE:JUP CRYPTOCAP:RUNE
AI: CRYPTOCAP:NEAR GETTEX:TAO CRYPTOCAP:ICP
Ethereum Memes: CRYPTOCAP:PEPE CRYPTOCAP:SHIB CRYPTOCAP:FLOKI
Traders can compare the relative performance of a custom ticker against the sector of their choice and view the average of all sectors.
The tool is fully customizable, allowing traders to enable or disable any of the features or sectors.
🔹 Dashboard
The tool also displays the data in an ascending or descending sector performance dashboard, allowing traders to see at a glance which sectors are overperforming or underperforming.
Other dashboard features include custom ticker vs. sector comparison and sectors average, and traders can choose the location and size of the dashboard.
🔶 SETTINGS
Period: View all data by time period, daily, weekly, etc. Or view data from last year, last 2 years, etc.
Relative Performance Against: Enable/Disable relative performance comparison against a sector.
Use chart ticker: Enable the use of the chart ticker or a custom ticker for relative performance comparison.
🔹 Dashboard
Show Dashboard: Enable / disable Dashboard display.
Order: Choose between ascending and descending order.
Position: Selection of dashboard location.
Size: Selection of dashboard size.
🔹 Style
Show Sectors Labels: Enable / disable sector labels
Layer 1: Enable / disable Layer 1 sector
Layer 2: Enable / disable Layer 2 sector
CEX: Enable / disable CEX sector
DEX: Enable / disable DEX sector
AI: Enable / disable AI sector
Ethereum Memes: Enable / disable Ethereum Memes sector
Average: Enable / disable sectors average display
Custom Ticker: Enable / disable custom ticker display
Indices Tracker and VOLD-Market BreadthThis is an overlay displaying DOW, Nasdaq and S&P performance for the day in real-time along with NQ and NYSE market breadth display.
Overview of the Script:
The Dow, Nasdaq, S&P Tracker section is at the top, displaying the current index values, changes, and colors.
The VOLD-Market Breadth section is below, providing the market breadth information.
Helpful to get a market view while trading stocks or options directionally.
DAILY CANDLE SIZE TRACKERDAILY CANDLE SIZE TRACKER
The daily candle size Indicator is a versatile tool designed to measure and analyze the length of candlesticks on your TradingView chart. This indicator helps traders gain insights into market volatility and price movement by displaying the relative size of particular size of candle in terms of its range (open to close) of particular day of week.
Key Features:
Visual Representation: Displays the length of every qualified candle directly on the chart, allowing for immediate visual assessment.
Historical Analysis: View the lengths of past candles to identify patterns or changes in market volatility over time of certain size of candle.
Usage:
• Probability analysis : It help to analyze candles based on candle size on particular days of the week.
• Volatility Assessment: Large candles may indicate higher market volatility, while smaller candles can suggest periods of consolidation or lower volatility.
• Trade Confirmation: Use candle length information in conjunction with other technical indicators to confirm trade signals and refine entry and exit points.
USER INPUTS
• DAY LABEL: Select Particular day of week or all days of week.
• START DATE : Select the prefer date from where you want to calculate.
• CANDLE LENGTH : Define length of candle on the basis of open to close.
******************* THIS INDICATOR ONLY WORKS ON DAILY TIMEFRAME**************
F.B_Double Hull Moving Average Trend TrackerThe F.B_Double Hull Moving Average Trend Tracker indicator is designed to identify market trends and is based on two Hull Moving Averages.
The "Hull Moving Average" (HMA) is a fast and smooth moving average that exhibits a rather unique behavior. The HMA attempts to completely remove lag while simultaneously presenting smoother results.
The first derivative is calculated for each HMA 1 and HMA 2.
If HMA 1 derivative > 0 and HMA 2 derivative > 0, then color the HMA lines and bar color green.
If HMA 1 derivative < 0 and HMA 2 derivative < 0, then color the HMA lines and bar color red.
If the slope of the derivative is different between HMA 1 and HMA 2, then color the HMA lines and bar color gray.
Meaning of colors:
Green ⇒ Uptrend
Gray ⇒ Price consolidation, trend weakness, or correction
Red ⇒ Downtrend
Best used in conjunction with additional indicators.
Dynamic Pivot Tracker Multi-Period - TradingEDThe "Dynamic Pivot Tracker Multi-Period" is an advanced tool designed for traders who require a detailed, multi-layered view of pivot levels across multiple time frames from a single chart. This indicator uses dynamic calculations to identify and connect high and low pivot points, aiding traders in pinpointing potential support and resistance areas and making informed decisions based on significant market structural changes.
Key Features:
Flexibility of Periods: Users can define pivot lengths for up to four different periods, ranging from as short as minutes to as long as days, allowing complete customization based on the trader's needs.
Dynamic Pivot Length Calculation: Utilizes a specialized function to adjust pivot length based on the selected time unit, ensuring pivot detection is relevant to the current time context.
Pivot Point Detection: Calculates and plots high and low pivots for each defined period using the pivothigh and pivotlow function for optimum accuracy.
Dynamic Line Management: The indicator dynamically manages the lines connecting pivots, removing old ones before plotting new to keep the chart clean and up-to-date.
Crossover Alerts: Set up automatic alerts to notify users when the price crosses above or below a pivot level, which may be indicative of an entry or exit opportunity.
Customizable Display Options:
Show Fractals: Option to visualize or hide fractals, which can indicate price reversal points.
Show Lines: Toggle the display of lines connecting the pivots, making it easier to visualize trends and ranges.
Show Pivots: Allows users to choose whether or not to see pivot points marked directly on the chart.
Practical Applications:
Trend Analysis: By observing how the price interacts with pivots across different periods, traders can gain a deeper understanding of market direction.
Support and Resistance Identification: Pivot levels can act as zones of support or resistance, providing key points for stop placement or profit taking.
Optimization of Entries/Exits: Crossover alerts provide timely signals to enter or exit positions based on significant price movements.
This indicator is ideal for day traders, swing traders, and technical traders looking to integrate pivot analysis into their trading methodology, offering a robust and customizable tool to enhance market decision-making.
Peak and Trough Tracker by Mustafa KAPUZPeak and Trough Tracker
This indicator identifies the highest and lowest prices reached in two user-defined time periods. It then draws two lines connecting these peak and trough points. The purple line represents the connection between the highest prices, while the aqua line represents the relationship between the lowest prices. Both lines extend into the future and past, providing insights into potential support and resistance levels.
How to Use:
Add the indicator to your chart.
Enter two time periods.
Analyze the lines connecting peak and trough points.
This tool helps visually understand the market's key turning points and adjust your investment strategy based on these insights.
Zirve ve Dip Noktaları İzleyici
Bu indikatör, kullanıcı tarafından belirlenen iki zaman periyodunda piyasanın ulaştığı en yüksek ve en düşük fiyatları tespit eder. Ardından, bu zirve ve dip noktalarını birleştiren iki çizgi çizer. Mor çizgi, en yüksek fiyatlar arasındaki bağlantıyı gösterirken; aqua çizgi, en düşük fiyatlar arasındaki ilişkiyi temsil eder. Her iki çizgi de geleceğe ve geçmişe doğru uzanarak, potansiyel destek ve direnç seviyeleri hakkında fikir verir.
Kullanımı:
İndikatörü grafik üzerine ekleyin.
İki zaman periyodu girin.
Zirve ve dip noktalarını birleştiren çizgilerin analizini yapın.
Bu araç, piyasanın önemli dönüm noktalarını görsel olarak anlamanıza ve yatırım stratejinizi bu bilgilere göre ayarlamanıza yardımcı olur.
Progressive Trend TrackerProgressive Trend Tracker (PTT) is a development combining Bollinger Bands with Highest Highs and Lowest Lows by K.Hasan Alpay & Anıl Özekşi.
Bollinger Bands have originally 3 lines: Simple Moving Average (Middle Line), Upper Band and Lower Band.
PTT concentrates on the upper and lower Bollinger band lines.
First, it calculates the bands using the Highest & Lowest prices in a period of time (Faster period and period) instead of closing prices.
Then, PTT takes the lowest values of the calculated upper band and, conversely, the highest values of the calculated lower band in a Slower period.
Default values:
Faster Period: 5
Period: 5
Bollinger Band Moving Average Period: 2
Slower Period: 10
These values are designed for daily time frame, so they have to be optimized in other timeframes by the user. (Ex: Higher values can be considered in lower time frames)
One more significant difference considering original Bollinger Bands is that PTT uses VIDYA (Variable Dynamic Moving Average = VAR) in the calculation instead of a Simple Moving Average.
Bollinger Bands cannot create significant BUY & SELL signals considering their original logic, but the primary purpose of PTT is to have substantial trading signals:
BUY when the price crosses above the PTT Lower line (cyan line)
STOP when the price crosses back below the PTT Lower line (cyan line)
SELL when the price crosses below the PTT Upper line (cyan line)
STOP when the price crosses back above the PTT Upper line (cyan line)
Developer Anıl Özekşi advises that traders may have more accurate signals when using a short-period moving average instead of closing prices, so I added the VIDYA moving average with the same default length ( 2 ), which is used in Bollinger Bands calculation. You can check the "SHOW MOVING AVERAGE?" box on the settings tab of the indicator.
FlexiMA Variance Tracker [presentTrading]🔶 Introduction and How it is Different
The FlexiMA Variance Tracker (FlexiMA-VT) represents a novel approach in technical analysis, distinctively standing out in the realm of financial market indicators. It leverages the concept of a variable Length Moving Average (MA) to create a versatile and dynamic oscillator. Unlike traditional oscillators that rely on a fixed-length MA, the FlexiMA-VT adapts to market conditions by varying the length of the MA, offering a more responsive and nuanced view of market trends. (*The achieved method took reference from SuperTrend Polyfactor Oscillator)
This innovative design allows the FlexiMA-VT to capture a broader spectrum of market movements, making it highly effective in diverse trading environments. Whether in stable or volatile markets, its adaptability ensures consistent relevance, providing traders with deeper insights into potential market swings.
The proposed oscillator accentuates several key aspects through a distinctive mesh of bars, which are derived from the differences between the price and a set of 20 Moving Averages, each altered by varying factors. The intensity of the mesh's colors serves as an indicator, with brighter hues signifying a greater convergence of Moving Average signals.
Starting Length = 5
Starting Length = 40
🔶 Strategy, How it Works: Detailed Explanation
1. Core Concept:
The FlexiMA-VT operates by comparing the price or an average value (indicator source) against a set of moving averages with varying lengths.
These lengths are dynamically adjusted through a starting factor and multiple increment factors, ensuring a comprehensive analysis over different time scales.
2. Normalization and Standard Deviation Calculation:
Once deviations are calculated, they undergo a normalization process, which can be set to 'None', 'Max-Min', or 'Absolute Sum'.
This step is crucial as it standardizes the deviations, allowing for a consistent scale of comparison.
The standard deviation of these normalized deviations is then calculated, offering insights into the market’s volatility and potential trend strength.
🔹Normalization
3. Median Value and Oscillator Creation:
The median of the normalized deviations forms the core of the FlexiMA-VT oscillator.
This median value provides a balanced central point, reflecting the consensus of various MA lengths.
The standard deviation bands plotted around the median enhance the interpretative power of the oscillator, indicating potential overbought or oversold conditions.
4. Multi-Factor Analysis:
The FlexiMA-VT uses multiple increment factors to generate a range of MAs, each factor representing a different scale of trend analysis.
By averaging the results from these different scales, the FlexiMA-VT forms a more comprehensive and reliable oscillator.
🔹Consensus
5. Practical Application:
Traders can use the FlexiMA-VT for various purposes, including identifying trend reversals, gauging market momentum, and determining overbought or oversold conditions.
Its dynamic nature makes it adaptable to different trading strategies, from short-term scalping to long-term position trading.
🔶 Settings
1. Indicator Source (indicatorSource): Determines the base data for calculations, typically a price average (HLC3).
2. Indicator Length (indicatorLength): Sets the base length for Moving Averages, influencing initial calculations.
3. Starting Factor (startingFactor): Initial multiplier for MA length, impacting the starting point of analysis.
4. Increment Factors (incrementFactor_1, incrementFactor_2, incrementFactor_3): Modulate the rate of change in MA lengths, adding variability.
5. Normalization Method (normalizeMethod): Standardizes deviations, with methods like 'Max-Min' and 'Absolute Sum' for comparability.
Trade Manager & Position Size Tool & PnL Tracker [AlgoScopes] V1Position size tool, leverage calculator, trade tracker, money management, trade presentation, risk reward management, margin position, live profit and loss, that's all in this one Trade Manager indicator.
The idea for this indicator comes from two years ago when I was helping a friend who, at the request of 15-20 members from our telegram group, wanted to create a paid group and share our ideas for trade with them (it started as an experiment for just a month or two and ended with 15 months with over 500 trading ideas and signals, with a complete TA chart). If I had time to create this indicator back then for members, it would have been much easier for them to be able to understand and follow the trade idea that was presented through a classic chart, with all the things that a TA must have:
Entry (as well as the reason for entry),
Stop (where the idea for the trade is no longer valid),
Target (with the reason why it is the target for that trade),
Take profits (taking part of the profit on the way to the target).
The majority of members still did not understand how much position to trade, what is the possible profit or loss, if the margin trade is how much leverage to use, in one word “money management”. The most important rule that every trader must follow is "Plan your trade and trade your plan". Learn money management and you are halfway there to becoming a successful trader. It is only after all that, you learn to use some of the "holy grail" indicators. When you have mastered those first two rules, find and master your favorite indicator or trading style (the most important thing is to stick to those two rules). The margin | leverage is also included in the script, for which there are so many dilemmas, arguments and discussions. (that many who still do not understand margin, would trade that it is not passionate if it is controlled). Too much for an introduction, especially since this indicator has so much to explain.
Most importantly, this is an invite-only indicator, and there are so many free indicators on tradingview that can also serve you very well. As far as I know, all exchanges have a calculator tool to calculate the possible profit and loss for each trade you plan to take.
*This indicator is not recommended for scalping on a 1min chart because the script, as you will see, is very complex, so the loading time is longer than with simpler indicators.
💠 ABOUT THE SCRIPT
This script is made to help manage trade. In this one indicator you have the possibility to do technical analysis, calculation for trade (four types: account size risk, trade investment, maximum to lose or position size), monitor 'PnL' (profit and loss in real time) do the calculation in the second, maybe local currency, and set an alert (from entry to any other change in trade). As the script is made for general use, some slight differences are possible for real time 'PnL' or 'ROI'. Always do a test before you start trading with larger amounts. The script is recommended for intra day trading and above. The script is not recommended for scalping on the 1min chart
💎 PROCESS TO ADD SCRIPT TO CHART
Possible trade on break example trade
As this script is invite-only, to add it to the chart you need to click on Indicators and find it under the 'Invite-Only' section. When you add the script to the chart (as it is interactive), you will be asked to do 4 steps.
🔸 'SET TRADE TIME'
Click on the chart where the last vertical bar is.
If you are already in the trade, then find the bar|time where the trade started
(you want to follow trade or trade presentation)
🔸 1) 'SET ENTRY'
Click on the horizontal level where you want to place the Entry
🔸 2) 'SET STOP'
Click on the horizontal level where you want to set the Stop
🔸 3) 'SET TARGET
Click on the horizontal level where you want to place the Target
💎 CONFIRM INPUTS
After you have done those 4 steps, a popup will appear with the relevant inputs for the trade.
You will see that some inputs are already filled (done in those 4 steps before, Entry, Stop and Target). You can correct them if you want (you will sometimes notice a longer 'space decimal' for the trade ticker, but this will not affect the calculator or other parts of the script). You can do the rest of the inputs for trade or finish it later when the script is loaded on the chart (it is recommended to fill in 'Trade Type' and 'Amount'. Don't forget to click on the "Apply" button to load the script on the chart.
💎 INDICATOR LOADED ON CHART
• When the indicator is loaded on the chart (regardless of whether it is a new trade or a trade that has already started), the following items are displayed by default:
🔸 ' Trade Table ' shows all relevant information for the trade
🔸 ' Trade Box ' with lines for Entry, Stop and Target (Take Profits if enabled)
🔸 ' Trade Box Labels ' with relevant data
• The Entry label is also the trade status label, and if the trade is not active, by default it is the Entry color
If the trade is active or when a new trade reached Entry, several new things are noticeable:
• Entry|Status label as well as status row in table will change color as well as 'Entry Reached' text
• Several extra columns relative to trade will be added to the Entry|Status label
• 3 new columns will also appear on the Trade Table (Live PnL, Live min PnL and Live ROI)
• If Trail Stop is enabled, the label will change the text to T.Stop and change color depending on whether it is in loss or profit.
• If Trail Stop is enabled, inside Trade Box trail line it will follow price action inside the box, while the label will always be fixed at the initial level
• A vertical colored line will appear on the right side of the Trade Box (depending on whether the trade is in profit or loss) which shows as in the Trade Table like Live PnL
⚪ SETTINGS
💎 Trade Account Setup
🔸 ‘Trade Type’
• 'Account Capital' or portfolio (with combination '% Capital Risk')
• 'Investment' (how much you want to invest in the trade)
• 'Risk To Lose' (how much you want to risk losing)
• 'Position Size' (exact position size, units|share for trade)
🔸 ‘Account Type’
• If the account is in another currency or you want to see possible profit | loss in local currency
• Around 150 world and local currencies supported by ICE exchange
🔸 ‘Amount’
• Amount for ‘Trade Type’
🔸 ‘% Capital Risk’
• Only for ‘Account Capital’ trade type
(i.e. 10.000 account capital with ‘% Capital Risk’ 4 is 10.000 x 4% = maximum loss 400)
🔸 ‘Leverage’
• Enable|Disable for margin trade i size of leverage (maximum 125x)
(be sure to study how and when to use margin trade through the tutorial, because margin trade can be very dangerous. If you have not perfected margin trade, there is a great possibility of losing most or even all of your account capital).
💎 TRADE ENTRY & TARGET & STOP & T.STOP & DATE | TIME
🔸 ‘Trade Date & Time’
🔸 ‘Entry’
🔸 ‘Stop’
🔸 ‘Target’
• (all was set in the previous step but can be correct/adjusted if needed)
🔸 ‘Market Entry’
• Enabled will move Entry on that bar close
🔸 ‘Liquidation’ (enabled by default)
• Show ‘Warning’ if trade Stop is close or invalid (trade will hit liquidation before reached Stop level)
🔸 ‘Trailing Type’ (4 trailing stop type)
• ‘Disabled’ (Stop will stay the entire time at the initial stop level)
• ‘Continuous’ (I.Stop follow price by distance or percent when price reached Trail start level)
• ‘Stepped’ (I.Stop moves to previous level when price reached Trail start level)
• ‘Breakeven’ (I.Stop moves to Entry when price reached Trail start level)*
* (least one Take Profit enabled)
🔸 ‘Trailing Active’ (Entry, TP1, TP2 and TP3)
• Trailing stop starts level if ‘Trailing Type’ is enabled
🔸 ‘Trailing by’ (distance or percent)
• ‘Distance’ (T.Stop will follow price action by distance)
• ‘Percent’ (T.Stop will follow price action by percent)
(this is a good example to see the difference between trailing by initial distance and initial percentage)
🔸 ‘T.Stop Distance & Percent’ (initial distance and percent for table trade only)
• Useful for bot or exchange
🔸 ‘Stop, T.Stop, Target and TP’s in PIP’s’
• Distance in PIP’s
💎 TAKE PROFIT
🔸 ‘Split Target’ (enabled by default to three take profits (TP) with auto split)
🔸 ‘Number of Take Profits’ (up to three take profits)
🔸 ‘Type’ (auto or manual)
• For manual type fill all prices to preferred level. TP percent (TP1%, TP2% and TP3% ) and Target% is how much profit you want to take on a specific level.
• PLEASE NOTE sum of all enabled ‘TP’ and targets = 100 (e.g. two TP and sets TP1% to 25 and TP2% to 35, then Target% should be 40% i.e. 25 + 35 + 40 = 100)
💎 TRADE BOX & LINES
🔸 ‘Target Line’ (color for target line and trade table ‘direction’)
🔸 ‘Stop Line’ (color for initial line and trail line)
🔸 ‘Entry Line’ (color for entry line and label & table status)
🔸 ‘To Trade Time’ (‘trade box’ left vertical line)
• By default is set to trade date and time
• Unchecked will be moved to the last bar (live time)
🔸 ‘Extended Left’ (extend Entry, Stop, Target and TP’s lines to left)
• To check for possible support|resistance
🔸 ‘Size’ (Entry, Stop, Target and TP’s lines size)
🔸 ‘PnL Box Size’ (line size for vertical box lines)
🔸 ‘Offset’ (right vertical line offset from last bar)
🔸 ‘PnL Box Color’ (right vertical line and trail fill color)
• Color changes for profit & loss
🔸 ‘Box Line Color’ (box base color)
💎 LABELS
🔸 ‘Stop & Target Labels’ (enable|disable stop and target labels)
• By default is set to small (tiny, small, normal, large, huge and auto option)
• Disabled will move all information on Entry|Status label
🔸 ‘Offset’ (label offset from trade box)
🔸 ‘Target Label’ (label color for target and all enabled tp’s)
🔸 ‘Stop Label’ (label color for initial stop and enabled trailing stop)
🔸 ‘Label Text’ (color for label text)
🔸 ‘Status Label Color’ (label table entry|status color when trade is not active)
🔸 ‘PnL’ (entry|status color for profit and loss)
🔸 ‘Size’ (by default set to normal, option tiny, small, normal, large, huge and auto)
🔸 ‘Risk to Reward’ (show risk to reward on labels)
🔸 ‘Extra Info’ (by default disabled, show extra related info for trade on labels)
• Useful if Trade Table disabled
🔸 ‘Close Trade Stats’ (by default disabled, show all info when trade is closed)
• By default is white text color for close trade stats label
💎 ALERTS
🔸 ‘Failed Trade’ (alert if price reached Stop before is active, reached Entry)
• Useful if trade need adjustment but it can also be left as it is
and alert is just warning
🔸 ‘New & Update Alert’ (alert when price reached Entry or change status to enabled Take Profits)
🔸 ‘Trade Closure Alert’ (alert when trade closed, reached Stop, Target or enabled Trail Stop)
• Alert can be in modified or default preset jSon format as well as in plain text format
• Place holders for creating alerts are :
{type}, {symbol}, {exchange}, {ticker}, {base}, {quote}, {timeframe}, {price}, {direction}, {entry}, {stop}, {tstop}, {tp1}, {tp2}, {tp3}, {target}, {tstopstatus}, {status}, {result}
* {type} placeholder is set to ‘Trade Active’, ‘Trade Update’ and ‘Trade Closed’
💎 TABLE DISPLAY
🔸 ‘Trade Table’ (enable|disable trade table)
🔸 ‘Position’ (by default set to bottom right with option bottom, middle and top with left, center and right)
🔸 ‘Size’ (by default set to normal, option tiny, small, normal, large, huge and auto)
🔸 ‘Full Table’ (by default enabled, disabled show small table without some info*)
* check picture for reference
🔸 ‘Presentation’ (by default disabled, hide all info related to PnL in trade currency)
• Useful if trade shared for presentation, hidden trade fiat|currency info)
🔸 ‘Header’ (color for trade table first row)
🔸 ‘Stats’ (color for trade table statistics row)
🔸 ‘Text’ (color for trade table text)
🔸 ‘Error’ (color for all errors if is made when trade is setup)
• Color for errors is for trade table and trade labels
🔸 ‘Fiat Price’ (by default enabled, show info for second fiat*
* if trade is in crypto and ‘quoted’ currency is not stable coin, like ETHBTC, or ‘Account Type’ is set to different currency
🔸 ‘Live Fiat Price’ (if ‘quoted’ currency enabled will show live exchange conversion)
🔸 ‘All Errors’ (enabled by default, show all error if trade setup is wrong)
• When error shows on trade, disabled this to see what|where is error
• Check below for more details
🔸 ‘Tool Tip (chart)’ (enabled show all tooltip on chart)
• Check below for more details
• When you are familiar with indicator, disable popup tooltip
💎 TOOLTIP
All possible tooltips have been added for easier understanding, especially for traders who are just learning how to place a trade. (when you perfect this indicator, you can turn off the tooltip in settings, and you can also normally use the lite version of this indicator, which does not contain all these futures)
🔸 ' Settings Tooltips’
🔸 ‘Chart Tooltips’
🔸 ‘Table Tooltips’
🔴 ERRORS
When you setup trade, not only a novice in trading, but also experienced traders can make a mistake and for this reason all possible errors are included in the indicator which will be shown on the chart by changing the color of the labels as well as on the trade table and in most of the cases and error text.
If the tooltip is enabled in the settings, you can see the reason for the error as well as the solution.
Here are some examples of possible errors.
Stay safe
PLAN YOUR TRADE AND TRADE YOUR PLAN
Position TrackerEnter your purchase price & the quantity.
It'll display a line at that value, with a label indicating the current gain/loss
Volatility Gap TrackerThe Volatility Gap Tracker ( *VGT ) indicator calculates the historical volatility of an asset using the standard deviation of the natural logarithm of the closing price relative to the previous period's closing price. *VGT visualizes the HV with gap lines to highlight when the current HV has increased or decreased significantly compared to the previous period, and adds labels to show the HV value for each of those bars.
Low HV calculated by *VGT can potentially signify a potential move up or down in the price of an asset. When HV is low, it indicates that the price of the asset has been relatively stable or range-bound over the specified period of time. This can sometimes be a precursor to a significant move in either direction, as the price may be building up energy to break out of its range.
*VGT can be used for any market that TradingView supports, including stocks, forex, and cryptocurrencies. It is especially useful for traders who want to identify periods of high volatility or sudden changes in volatility , which can indicate potential trading opportunities or risks. However, it's important to note that HV is a historical measure and may not always accurately predict future volatility .
The indicator can be used under various market conditions, but is especially useful during periods of high volatility , such as market crashes or major news events. It can also be useful for traders who want to monitor the volatility of specific stocks or assets over a longer period of time.
*VGT is provided for informational purposes only and is not a guarantee of future performance or accuracy. Traders should use multiple indicators and analysis methods to make informed trading decisions. Trading involves risks and traders should always conduct their own research and analysis before making any investment decisions.
Volatility Trackerhi there, fellows.
this is a very simple and quite straightforward indicator.
so far the simplest we've built.
on what it does
in regard to current chart and timeframe it plots
a. Open - Close as a percentage of the Open (we regard open as more relevant than close, for as you can use latest estimates in current candle) in daily change coloring (so one may have an idea if there is a trend or sideways move unfolding)
b. High - Low as a percentage of the Open, so one may compare extreme moves with final ones in the period
c. Volume as a percentage distance from its WMA200 (always this one, a way better reference for normalcy). (e. g. a positive value x means Volume is x% above its WMA200)
on what it means
to the best of our imperfect and incomplete understanding, we believe that low volatility periods lead to high volatility periods, so one might want to enter the market in low volatility periods to enjoy wild rides afterwards. such a trade of course would be, for the sake of making sense, a long volatility one.
the timing for entrance could be once that the volatility waves fades to chart minimums.
we're open to critics, suggestions and comments.
best regards.
STD Stepped Ehlers Optimal Tracking Filter MTF w/ Alerts [Loxx]STD Stepped Ehlers Optimal Tracking Filter MTF w/ Alerts is the traditional Ehlers Optimal Tracking Filter but with stepped price levels, access to multiple time frames, and alerts.
What is Ehlers Optimal Tracking Filter?
From "OPTIMAL TRACKING FILTERS" by John Ehlers:
"Dr. R.E. Kalman introduced his concept of optimum estimation in 1960. Since that time, his technique has proven to be a powerful and practical tool. The approach is particularly well suited for optimizing the performance of modern terrestrial and space navigation systems. Many traders not directly involved in system analysis have heard about Kalman filtering and have expressed an interest in learning more about it for market applications. Although attempts have been made to provide simple, intuitive explanations, none has been completely successful. Almost without exception, descriptions have become mired in the jargon and state-space notation of the “cult”.
Surprisingly, in spite of the obscure-looking mathematics (the most impenetrable of which can be found in Dr. Kalman’s original paper), Kalman filtering is a fairly direct and simple concept. In the spirit of being pragmatic, we will not deal with the full-blown matrix equations in this description and we will be less than rigorous in the application to trading. Rigorous application requires knowledge of the probability distributions of the statistics. Nonetheless we end with practically useful results. We will depart from the classical approach by working backwards from Exponential Moving Averages. In this process, we introduce a way to create a nearly zero lag moving average. From there, we will use the concept of a Tracking Index that optimizes the filter tracking for the given uncertainty in price movement and the uncertainty in our ability to measure it."
Included:
-Standard deviation stepping filter, price is required to exceed XX deviations before the moving average line shifts direction
-Selection of filtering based on source price, the moving average, or both; you can also set the Filter deviations to 0 for no filtering at all
-Toggle on/off bar coloring
-Toggle on/off signals
-Long/Short alerts
Profit Loss TrackerIt's a simple profit loss tracker for up to 10 symbols. A concise panel displays all your positions, whether if they're in profit or loss, and what percentage.
Text size and box position can be adjustable.
BenTrading bullish trend continuation trackerThis script uses simple features to indicate where a trend may continue.
It uses market structures and monitors breaks of swing highs and swing lows.
If there is a break upwards, the alert will give signal when swing points forms (see chart - alert 1) or when sweeps form (see chart - alert 2).
For it to send alerts you must right click the indicator and apply alert - "once per bar".
This indicator only shows bullish signals, while there is another indicator that can be used alongside it to indicate berish trend continuation with the same features.
Stochastic Optimized Trend Tracker *Strategy*Stochastic OTT is Anıl Özekşi's latest derived version of Optimized Trend Tracker on Stochastic Oscillator.
He tried to solve the fake signals of Stochastic Oscillator by adopting OTT on the indicator.
He advised users to set the stochastic smoothing parameters to 500 and 200 on his latest video about SOTT.
He personally uses 1 min charts on stock market so the parameters of the indicator might have to be optimized for other time frames nad markets.
He exaggerated the Stochastic to 1000's to have better signals of percent values of OTT .
Also hes used VIDYA in both calculations of OTT and Stochastic smoothing.
Said, Kıvanç Özbilgiç.
I just made a Strategy version of the script so that we lads can backtest it. The codes for that are yet again from Kıvanç Özbilgiç :) I just copy-pasted a few and did some adjustments. Hope you enjoy!
#betonyetmez
Position Tracker by KrisWatersPosition tracker helps you to know "Stop" and "Take Profit" prices with provided "Entry Price" data. You can use on Long and Short setups.
Optimized Trend Tracker BandsDerived from Anıl Özekşi's Optimized trend tracker Indicator OTT:
by himself on his last youtube video with subtitles.
OTT Bands tries to determine accurate support and resistance levels after users manually set the 2 optimization coefficients (for UPPER AND LOWER BANDS) just by having the highest and lowest price levels inside the OTT Bands.
After that user can enjoy the fibonacci coefficiented levels just by selecting from indicator settings.
A message from the developer Anıl Özekşi to all traders:
"Hope you are always on the winning side ..."
Kıvanç Özbilgiç