Gartley Pattern ULTRA V6[NXT2017]+VolumeProfile+POC+SignalCountsGartley Pattern ULTRA V6 is a professional harmonic scanner designed to automatically detect and visualize valid Gartley patterns across multiple pivot lengths. Unlike standard indicators, this script includes advanced institutional tools like Volume Profile integration per pattern and a statistical dashboard.
Key Features: Multi-Pivot Scanning: Scans for patterns simultaneously across 9 different pivot lengths (from 5 to 233) to find structures on micro and macro levels. Volume Profile Integration: Automatically draws a Volume Profile (VP) covering the range from Point X to the current bar to analyze supply and demand within the pattern structure. POC Indication: Highlights the Point of Control (POC) to identify key support/resistance levels within the pattern. Statistics Dashboard: A table displaying the number of Bullish and Bearish patterns found for each pivot size. Customizable: Full control over colors, tolerance levels, and display options.
The Gartley Pattern Rules Used: This script strictly follows the classic ratios for the Gartley pattern: B Point: Strictly a 0.618 retracement of the XA leg. C Point: Retracement of AB (0.382 – 0.886). Crucially, Point C must not exceed Point A. D Point (Entry): The defining characteristic is the 0.786 retracement of the XA leg . Point D must not exceed Point X.
Settings & Inputs: Deviation Tolerance: Adjust the strictness of the ratio matching (default 30% allows for market noise). Volume Profile: Toggle the VP on/off, adjust resolution (rows), and transparency. Filter & History: Prevents duplicate signals for the same price structure.
How to use: Add the indicator to your chart. Bullish Gartleys are highlighted in Green and Bearish Gartleys in Fuchsia. The pattern completes at the D-point (78.6% of XA). Use the Volume Profile to confirm if the reversal is happening at a high-volume node.
This is a update of v1:
Indicatori e strategie

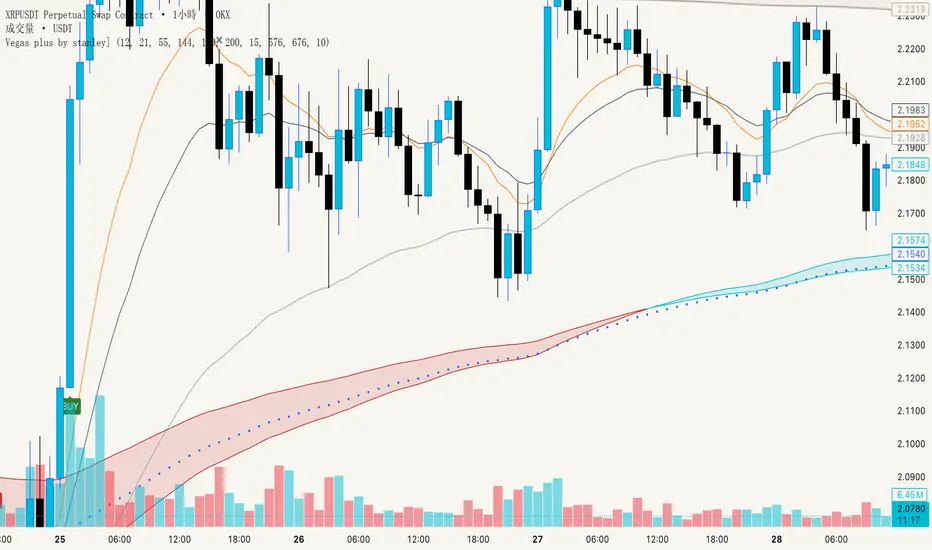
Vegas plus by stanleyThis Pine Script implements a comprehensive trend-following strategy known popularly as the **Vegas Tunnel Method**. It combines multiple Exponential Moving Averages (EMAs) to define trends, pullbacks, and breakouts.
Here is a step-by-step walkthrough of how the code works, broken down by its components and logic.
---
### 1. The Anatomy (The Indicators)
The script uses three distinct groups of Moving Averages to define the market structure.
#### A. The Fast EMAs (The Trigger & Exit)
* **EMA 12 (Signal):** The fastest line. It is used to trigger entries (crossing the tunnel).
* **EMA 21 (Exit):** Used as a trailing stop. If the price crosses this line against your trade, the script signals an exit.
* **EMA 55 (Filter):** A medium-term filter, often used visually to gauge trend health.
#### B. The "Hero" Tunnel (The Action Zone)
* **EMAs 144 & 169 & 200:** These creates the main "Tunnel."
* **Function:** This acts as dynamic Support and Resistance.
* **Bullish:** If the 144 (Top) is above the 200 (Bottom), the tunnel is painted Blue.
* **Bearish:** If the 144 is below the 200, it is painted Red.
#### C. The "Anchor" Tunnel (The Deep Trend)
* **EMAs 576 & 676:** This creates a massive, slow-moving background tunnel.
* **Function:** It tells you the long-term trend. Generally, you only want to take Buy signals if price is above this Anchor, though the script logic focuses primarily on the Hero tunnel for triggers.
---
### 2. State Memory (`var` Variables)
This is a sophisticated part of the script. It uses `var` variables to "remember" where the price was in the past.
* `originPrice`: Remembers if the price was last seen **Above** (1) or **Below** (-1) the tunnel.
* `originEMA`: Remembers if the EMA 12 was last seen **Above** (1) or **Below** (-1) the tunnel.
**Why is this needed?**
To distinguish between a **Breakout** (crossing from Bear to Bull) and a **Pullback** (already Bull, dipped into tunnel, and coming back out).
---
### 3. The Four Entry Triggers
The script looks for four specific scenarios to generate a Buy or Sell signal. You can turn these on/off in the settings.
#### Trigger 1: Price U-Turn (Trend Continuation)
* **Logic:** The Price was *already* above the tunnel (`originPrice == 1`), dipped down, and is now crossing back up (`crossover`).
* **Meaning:** This is a classic "Buy the Dip" signal within an existing trend.
#### Trigger 2: EMA U-Turn (Lagging Confirmation)
* **Logic:** Similar to Trigger 1, but uses the **EMA 12** line instead of the Price candle.
* **Meaning:** This is safer but slower. It waits for the average price to curl back out of the tunnel.
#### Trigger 3: Breakthrough (Momentum Shift)
* **Logic:** The EMA 12 was previously *below* the tunnel (`originEMA == -1`) and has just crossed *above* it (`crossover`).
* **Meaning:** This is a Trend Reversal signal. The market has shifted from Bearish to Bullish.
#### Trigger 4: Wick Rejection (Touch & Go)
* **Logic:**
1. Price is generally above the tunnel.
2. The `Low` of the current candle touches the tunnel.
3. The `Low` of the *previous* candle did NOT touch the tunnel.
4. The candle closes *outside* (above) the tunnel.
* **Meaning:** The price tested the support zone and was immediately rejected (bounced off), leaving a wick.
---
### 4. Trade Management (State Machine)
The script uses a variable called `tradeState` to manage signals so they don't spam your chart.
* `tradeState = 0`: Flat (No position).
* `tradeState = 1`: Long.
* `tradeState = -1`: Short.
**The Rules:**
1. **Entry:** If `validLong` is triggered AND `tradeState` is not already 1 -> Change state to 1 (Long) and plot a **BUY** label.
2. **Holding:** If you are already in State 1, the script ignores new Buy signals.
3. **Exit:** If `tradeState` is 1 AND price closes below EMA 21 -> Change state to 0 (Flat) and plot an **Exit L** label.
---
### 5. Visual Summary
* **Green Label:** Buy Signal (Long Entry).
* **Red Label:** Sell Signal (Short Entry).
* **Grey X:** Exit Signal (Close the position).
* **Blue/Red Tunnel:** The "Hero" tunnel (144/169/200).
* **Grey Background Tunnel:** The "Anchor" tunnel (576/676).
### How to read the signals:
You are looking for the price to interact with the **Hero Tunnel** (the thinner, brighter one).
1. **Trend:** Look at the slope of the Anchor (thick grey) tunnel.
2. **Setup:** Wait for price to come back to the Hero Tunnel.
3. **Trigger:** Wait for a **Green Label**. This means the price dipped into the tunnel and is now blasting out (U-Turn), or has rejected the tunnel (Wick), or has broken through a new trend (Breakthrough).
4. **Exit:** Close the trade when the **Grey X** appears (Price crosses the EMA 21).

CypherPattern ULTRA V6 [NXT2017]+VolumeProfile+POC +SignalCountsCypher Pattern ULTRA V6 is a comprehensive harmonic scanner designed to automatically detect and visualize valid Cypher patterns across multiple pivot lengths. Unlike standard harmonic indicators, this script includes advanced features like Volume Profile integration per pattern and a statistical dashboard.
Key Features: Multi-Pivot Scanning: Scans for patterns simultaneously across 9 different pivot lengths (from 5 to 233) to find structures on micro and macro levels. Volume Profile Integration: Automatically draws a Volume Profile (VP) covering the range from Point X to the current bar to analyze supply and demand within the pattern structure. POC Indication: Highlights the Point of Control (POC) to identify key support/resistance levels within the pattern. Statistics Dashboard: A table displaying the number of Bullish and Bearish patterns found for each pivot size. Customizable: Full control over colors, tolerance levels, and display options.
The Cypher Pattern Rules Used: This script strictly follows the specific ratios for the Cypher pattern: B Point: 0.382 – 0.618 retracement of the XA leg. C Point: 1.13 – 1.414 extension of the AB leg (C projects beyond A). D Point (Entry): The unique characteristic of the Cypher is that the D point is the 0.786 retracement of the XC leg (not XA).
Settings & Inputs: Deviation Tolerance: Adjust the strictness of the ratio matching (default 30%). Volume Profile: Toggle the VP on/off, adjust resolution (rows), and transparency. Filter & History: Prevents duplicate signals for the same price structure.
How to use: Add the indicator to your chart. Bullish patterns are highlighted in Green (default) and Bearish patterns in Pink/Fuchsia. Look for the D-point completion for potential reversal entries. Use the Volume Profile to confirm if the reversal is happening at a high-volume node.

Madrid Ribbon with ST/TEMA Filter + Hourly Trend
Madrid Moving Average Ribbon with SuperTrend/TEMA Filter + Hourly Trend Open Line
This advanced technical indicator combines three powerful trading tools into one comprehensive system for identifying trend direction, momentum, and key support/resistance levels.
📊 What's Included:
1. Madrid Moving Average Ribbon (18 EMAs/SMAs)
Displays 18 configurable moving averages (5-100 periods) creating a visual "ribbon" effect
Color-coded system: LIME (strong bullish), GREEN (bullish), MAROON (weak bearish), RED (strong bearish), GRAY (neutral/filtered)
Choose between Exponential (EMA) or Simple (SMA) moving averages
The ribbon helps identify trend strength, direction, and potential reversals
2. SuperTrend/TEMA Filter System
Zero-lag Triple Exponential Moving Average (TEMA) for fast trend detection
SuperTrend indicator using ATR-based volatility bands
Combined filter logic: Only displays ribbon colors when BOTH SuperTrend AND TEMA confirm the trend direction
Reduces false signals and whipsaw during choppy market conditions
Fully customizable parameters (Fast/Slow TEMA periods, ATR multiplier, MA length)
Can be toggled ON/OFF to see unfiltered Madrid Ribbon
3. Hourly Trend Open Line
Plots the opening price of your selected higher timeframe (default: 1-hour)
Acts as dynamic support/resistance and trend bias indicator
Background coloring: Green when price is above the line (bullish bias), Red when below (bearish bias)
Customizable timeframe from 1-minute to Daily
Great for multi-timeframe analysis and confirming trade direction
🎯 How to Use:
Trend Following: Enter long when ribbon turns LIME/GREEN, enter short when MAROON/RED
Trend Confirmation: Use the Hourly Trend Open Line to confirm direction - trade longs above the line, shorts below
Filter Noise: Enable SuperTrend/TEMA filter to remove low-probability setups in ranging markets
Exit Signals: Watch for ribbon color changes or price crossing the Hourly Trend Open Line
⚡ Alert System:
Filtered Buy Signal: When trend changes to bullish (confirmed by both SuperTrend and TEMA)
Filtered Sell Signal: When trend changes to bearish (confirmed by both SuperTrend and TEMA)
Filtered Trend Change: Any trend direction change
⚙️ Customization Options:
Toggle SuperTrend/TEMA filter on/off
Adjust TEMA periods (Fast: 22, Slow: 144 default)
Modify SuperTrend settings (ATR multiplier, MA length)
Change Hourly Trend timeframe
Customize all colors and line widths
Choose EMA or SMA for ribbon calculation
💡 Best Practices:
Works on all timeframes and instruments
Use higher timeframe Trend Open Line for swing trading
Combine with volume analysis for confirmation
Best suited for trending markets; consider disabling in tight ranges
Test settings on your specific instrument for optimal performance
📝 Note: This indicator requires the 'loxx/loxxexpandedsourcetypes/4' library for TEMA calculations.
This indicator is ideal for traders who want a comprehensive, all-in-one solution for trend identification, momentum analysis, and multi-timeframe confluence.

VIX + Weekly ATR Hybrid RangeVIX + Weekly ATR Hybrid Range best used for complete range with accuracy


**MACD + RSI + MFI by IspatialResources – Multi-Tool Indicator**
This indicator is a **multi-functional technical analysis tool** that combines the following professional oscillators into a single panel:
* ✅ **Customizable MACD**
* ✅ **Advanced RSI with Moving Average and Bollinger Bands**
* ✅ **Money Flow Index (MFI)**
* ✅ **Module-based enable/disable system**
* ✅ **Fully configurable alerts**
It is designed to help identify **overbought and oversold conditions, trend strength, and momentum shifts**, improving market reading across multiple assets.
---
### 🔹 INCLUDED MODULES
**1️⃣ MACD**
* Fast and slow moving average settings
* Selectable MA type (SMA / EMA)
* Dynamic histogram
* Momentum change alerts
**2️⃣ Advanced RSI**
* Classic RSI with dynamic levels
* Moving average applied to RSI
* Optional **Bollinger Bands on RSI**
* Visual overbought and oversold signals
* Extreme condition alerts
**3️⃣ MFI (Money Flow Index)**
* Buying and selling pressure detection
* Overbought and oversold zones
* Ideal for volume and strength analysis
---
### 🔹 SUPPORTED MARKETS
This indicator can be used on:
* 📈 Cryptocurrencies
* 📊 Stock Indices
* 💱 Forex
* 📉 Stocks
It works on **all timeframes**: intraday, swing trading, and long-term analysis.
---
### 🔹 HOW TO USE IT
* Enable or disable each module from the settings panel.
* Use the **RSI with bands** to detect extreme zones.
* Confirm potential entries with the **MACD**.
* Filter false signals with the **MFI**.
* Combine it with market structure, support, and resistance.
---
### ⚠️ RISK DISCLAIMER
This indicator is **for educational and technical analysis purposes only**.
**It does not constitute financial advice and does not guarantee results.**
Trading involves risk, and each user is responsible for their own decisions.
---
### 👤 AUTHOR
Created by **Ismael** as a personal tool for market analysis and study.
---
🚀 If you find this indicator useful, feel free to support it with a “like” for future updates.

sXSwingssXSwings is a swing point indicator that identifies and plots horizontal lines at swing highs and swing lows on your chart. It operates on two levels:
Historical Swings - Uses a longer pivot length (default: 5) to identify significant swing points from price history. These appear as dotted lines and provide reference levels for major support and resistance zones.
Most Recent Swings - Uses a shorter pivot length (default: 1) to identify the most current swing high and swing low. These appear as solid lines and are more responsive to recent price action, updating dynamically as new pivots form.
The indicator automatically manages line cleanup, removing historical swing lines that exceed the lookback period to keep your chart clean. All visual aspects are fully customizable including line styles, colors, widths, and extension lengths.
Use Case: Traders can use this to quickly identify key swing levels for support/resistance trading, stop-loss placement, or analyzing price structure across different timeframes. The dual-layer approach helps distinguish between major structural levels and immediate price action swings.

5-0 Pattern ULTRA V6 [NXT2017]+Volume Profile +POC +SignalCounts5-0 Pattern ULTRA V6
This script is an advanced harmonic scanner designed specifically to detect the 5-0 Pattern. Unlike standard harmonic indicators, the "ULTRA" version scans across 9 different pivot lengths simultaneously (from 5 up to 233) to ensure no valid structure is missed, regardless of the timeframe.
It includes an integrated Volume Profile feature that automatically analyzes the volume distribution within the pattern to help validate the Point of Control (POC) near the reversal zone.
What is the 5-0 Pattern? The 5-0 is a unique 5-point harmonic structure (X, A, B, C, D) discovered by Scott Carney. It is distinct from other patterns like the Gartley or Bat because it relies heavily on specific reciprocal extensions. The completion point (D) is defined by a 50% retracement of the BC leg.
Pattern Rules used in this indicator:
The AB leg is a 1.13 to 1.618 extension of the XA leg.
The BC leg is a 1.618 to 2.618 extension of the AB leg.
The CD leg (Entry Zone) is a distinct 50% retracement of the BC leg.
Key Features of V6
Multi-Pivot Scanning: The indicator runs 9 separate scanners in the background (Pivot lengths: 5, 8, 13, 21, 34, 55, 89, 144, 233). You can toggle specific lengths on/off in the settings.
Auto Volume Profile: When a pattern is found, the script draws a Volume Profile over the structure and highlights the Point of Control (POC) line. This helps determine if there is volume support/resistance at the trade location.
Statistics Dashboard: A dashboard table displays historical data, showing how many Bullish and Bearish patterns have been detected for each pivot size on the current chart.
Smart History Filtering: Includes a mechanism to prevent duplicate patterns from cluttering the chart.
Interactive Guide: A built-in "Guide Mode" can be activated in the settings to hide signals and display a text tutorial on how to trade the pattern.
Settings & Customization
Tolerance: Adjust the inaccuracy percentage to make the scanner stricter or looser regarding Fibonacci ratios.
Visuals: Fully customizable colors for Bullish/Bearish patterns, Target lines, and Volume Profiles.
Labels: Choose between showing "XABCD" lettering or a simple "5-0" tag with the pattern size.
Alerts: Native alert conditions are set up. You can create alerts to be notified instantly when a new pattern is formed.
Risk Disclaimer: Trading harmonic patterns involves risk. The 5-0 pattern is a reversal setup; always use proper risk management and confirmation before entering a trade.
Made by NXT2017
This is a new creation of v1:

Opening Range ICT 3-Bar FVG + Engulfing Signals (Overlay)Beta testing
open range break out and retest of FVG.
Still working on making it accurate so bear with me

Liquidations (TV Source / Manual / Proxy) Cruz Pro Stack + Liquidations (TV Source / Manual / Proxy) is a high-confluence crypto trading indicator built to merge reversal detection, volatility timing, structure confirmation, and liquidation pressure into one clean decision engine.
This script combines five pro-grade components:
1) RSI Divergence (Regular + Hidden)
Detects early momentum shifts at tops and bottoms to anticipate reversals before price fully reacts.
2) BBWP (Bollinger Band Width Percentile)
Identifies volatility compression and expansion cycles to time breakout conditions and avoid low-quality chop.
3) Market Structure (BOS / CHOCH proxy)
Confirms trend continuation or change-of-character using swing breaks for more reliable directional bias.
4) Liquidations Layer (3 Modes)
Adds liquidation-driven context for where price is likely to squeeze or flush next:
TV Source: Use TradingView’s built-in Liquidations plot when available.
Manual Totals: Paste 12h/24h/48h long/short totals for higher-level regime bias.
Proxy (Volume Shock): A fallback approximation for spot charts using volume + candle direction.
The script automatically converts your chart timeframe into rolling 12/24/48-hour windows, then computes a weighted liquidation bias and a spike detector to flag potential exhaustion moves.
5) Confluence Score + Signals
A simple scoring engine highlights high-probability setups when multiple factors align.
Signals are printed only when divergence + structure + volatility context agree with liquidation pressure.
How to use
Best on BTC/ETH perps across 15m–4H.
For maximum accuracy:
Add TradingView’s Liquidations indicator (if your exchange/symbol supports it).
Set Liquidations Mode = TV Source.
Select the Liquidations plot as the source.
If that plot can’t be selected, switch to Proxy or Manual Totals.
What this indicator is designed to improve
Earlier reversal recognition
Cleaner breakout timing
Structure-confirmed entries
Better risk management around liquidation-driven moves
Fewer low-quality trades during dead volatility

AI ALGO [Ganesh]Core Strategy Components\
1. EMA (Exponential Moving Average) SystemThe strategy uses three EMAs to identify trend direction:
EMA 48 (longer-term trend)
EMA 2 (short-term momentum)
EMA 21 (medium-term trend)
How it works:
Bullish trend: When price is above EMA 21 (green cloud)
Bearish trend: When price is below EMA 21 (red cloud)
EMA Cloud: The area between EMA 2 and EMA 48/21 provides visual trend confirmation
Optional higher timeframe (HTF) analysis for multi-timeframe confirmation
2. DEMA ATR (Double EMA + Average True Range)
This is a dynamic support/resistance indicator that adapts to volatility:Components:
DEMA (Double Exponential Moving Average): Smooths price action with less lag
ATR Bands: Creates upper and lower bands based on volatility (ATR × 1.7 factor)
Signal Generation:
Green line: Uptrend (DEMA ATR rising)
Red line: Downtrend (DEMA ATR falling)
Acts as a trailing stop-loss level that adjusts with market volatility
3. Smart Trail System (Fibonacci-Based)
An advanced trailing stop system using modified true range calculations:Key Features:
Calculates true range using Wilder's smoothing method
Creates Fibonacci retracement levels (61.8%, 78.6%, 88.6%) from the trail line
Adaptive stop-loss: Adjusts based on ATR factor (4.2) and smoothing (4)
Trend Detection:
Bullish: Price > Trailing line (blue zones)
Bearish: Price < Trailing line (red zones)
The Fibonacci zones show potential support/resistance areas
4. ZigZag Indicator Identifies significant swing highs and lows:
Length parameter: 13 (sensitivity control)
Labels: Higher Highs (HH), Lower Lows (LL), etc.
Helps identify trend reversals and key pivot points
5. Support & Resistance Levels
Strength-based S/R: Identifies horizontal support/resistance zones
Zone width: Adjustable percentage-based zones
High/Low zones: Marks significant price levels
Trading LogicEntry Conditions (Implied)The strategy likely enters trades when:Long Entry:
Price crosses above DEMA ATR (green)
Price is above EMA 21 (bullish EMA cloud)
Smart Trail confirms uptrend
Price bounces from Fibonacci support levels
Short Entry:
Price crosses below DEMA ATR (red)
Price is below EMA 21 (bearish EMA cloud)
Smart Trail confirms downtrend
Price rejects from Fibonacci resistance levels
Exit/Stop-Loss Strategy
Trailing stops: Using Smart Trail Fibonacci levels
Dynamic stops: DEMA ATR line acts as a moving stop-loss
Risk management: Position sizing at 50% of equity per trade
Dashboard Features1. Weekly Performance Table
Tracks trades per day of the week
Shows win/loss statistics
Calculates win rate percentage
2. Monthly Performance Table
Monthly P&L breakdown
Yearly performance summary
Color-coded returns (green = profit, red = loss)
Strategy Parameters
Initial Capital: $5,000
Commission: 0.02% per trade
Position Size: 50% of equity
Pyramiding: Disabled (no adding to positions)
Calculation: On bar close (not tick-by-tick)
Visual Elements
EMA clouds: Green (bullish) / Red (bearish)
DEMA ATR line: Dynamic support/resistance
Smart Trail zones: Fibonacci-based colored bands
ZigZag lines: Swing high/low connections
S/R zones: Horizontal support/resistance areas
Strategy Philosophy
This is a trend-following strategy with dynamic risk management that:
Uses multiple timeframes for confirmation
Adapts to volatility through ATR-based indicators
Provides clear visual cues for trend direction
Includes comprehensive performance tracking
Combines momentum (EMAs) with volatility (ATR) for robust signals
The strategy works best in trending markets and uses the Fibonacci trail system to maximize profits while protecting against reversals with adaptive stop-losses.

5-Min Range Breakout (09:30 NY on MNQ)This is a 5 - min orb strat that a youtuber mentioned and i had a manual look for a while and thought it was actually pretty good but my results are bad. Feel free to look yourself with this code.
Basically this strat is using the 5min orb then go down to 1min timeframe and wait for a breakout with FVG confirmation. So candle after breaking candle is our entry only if FVG is formed.
However i do notice if you dump this code onto 5min timefraem and above you start consistently making money but it is a very small amount for me so you all can have it. Good starter strat on 5min or 10min timeframe

Auto Line📌 **《Auto Line》 Overview
Auto Line is a multi-level analytical engine that automatically generates structural price levels based on a variety of frameworks such as:
Moving averages
Upper / Lower band logic
Previous High / Previous Low
Swing pivot highs and lows
Fibonacci Pivot levels
Multi-timeframe (HTF) inputs
Each level is evaluated using a Break Count grading system, which measures how frequently price has crossed the level.
This grading does not produce buy or sell signals—it simply visualizes how often the market has interacted with that price area.
Auto Line is a market structure reference tool, not a prediction or signal generator.
✨ Key Features
1) Nine Independent Level Engines (SET 1–9)
Each of the nine SETs can independently generate levels using one of the following methods:
SMA
Upper band
Lower band
Previous High / Previous Low
Swing Points
Fibonacci Pivot Levels
NONE (disabled)
Each SET has its own:
Length
Multiplier
HTF timeframe
This allows full customization of the level-generation logic.
2) Built-in Multi-Timeframe (HTF) Support
Every SET can request data from any higher timeframe via request.security().
Example usage:
SET1 → Daily
SET3 → Weekly
SET9 → Weekly Fibonacci
Thus, the user can visualize multiple timeframe structures on a single chart.
3) Break-Count Level Strength System
Auto Line evaluates the “strength” of each level using a break-count formula:
breaks = Number of times price crosses above/below the level
grade = 0–100 scale based on breaks
More breaks → higher grade → lower opacity (more faded)
This gives a visual sense of how frequently the market has interacted with a level.
It is not a probability measure and does not imply trade direction or outcome.
4) Swing-Based Structural Levels
The indicator detects swing highs and lows using left/right parameters and converts them into structural levels.
Includes:
Automatic swing labeling
Break-count evaluation
Optional display of all swing points (showPP)
5) Automatic Fibonacci Pivot Levels
When the Fibonacci option is selected:
P
R1 to R5
S1 to S5
are generated automatically and evaluated just like any other level.
6) Selective Output (A–E Pick Slots)
The user can selectively display specific SET outputs using pick slots:
Pick A → choose SET #1 to SET #9
Pick B → choose another SET
… up to five independent visible selections
Each pick can display either:
a single line level
or a full 11-level Fibonacci set (when applicable)
📌 Explanation of User Inputs
Swing Settings
Left / Right: Controls pivot swing sensitivity
Show PP: Option to show all swing labels on chart
SET Parameters (1 to 9)
Each SET contains:
Parameter Description
Method SMA / Upper / Lower / Prev High / Prev Low / Swings / Fibonacci
Length Used for SMA/Band logic
Multiplier Used for Upper/Lower band expansion
HTF Timeframe used for data calculation
Each SET behaves independently.
Display Options (Picks A–E)
Each pick allows selecting one SET to display.
Example:
Pick A = SET3
Pick B = SET5
Fibonacci levels generate up to 11 plots;
other methods produce a single structural line.
📌 How Level Strength Is Calculated (Technical Description)
Auto Line tracks how often price alternates above and below a level:
Determine whether price begins above or below the level
Count each time price crosses it
Convert break count into a grade:
grade = min(100, round((100 / fade) * breaks))
The grade affects opacity only, giving a visual representation of interaction frequency.
This grading does not represent trade probability or outcome.
📌 Repainting Behavior
Auto Line:
Uses confirmed historical bars
Uses security() for HTF data
Does not modify past values once bars are confirmed
Therefore, the indicator does not repaint.
However, structural levels such as:
Swings
Pivot Levels
HTF lines
will naturally update when new bars close, which is expected behavior for this style of indicator.
📌 Purpose of the Indicator
Auto Line is designed for:
Identifying structural price regions
Observing where the market most frequently interacts
Comparing levels across multiple frameworks
Creating a comprehensive multi-timeframe level map
It does not:
❌ predict future price
❌ provide buy/sell signals
❌ guarantee profitable outcomes
It is a supporting tool for market structure analysis.
📌 Notes & Considerations
Swings and pivot levels depend on chart range and may change as new bars appear
Too many SETs may clutter the chart—use pick slots to selectively display
Break-count is purely informational, not directional

Regime Filter [BigBeluga] Modified by Claude to move tableThis is a copy of Regime Filter that has been modified by Anthropic's Claude to move the overlay table to different positions.

KIMATIX VWAP/EMA System (by ASCE)**KIMATIX VWAP/EMA System (by ASCE)**
A precision-built intraday framework for momentum, structure, and liquidity timing.
**Why this indicator exists**
Most traders see movement, but not context. They enter too late, chase momentum, or fade reversals without understanding where institutional players react.
This tool solves that problem by combining two of the most powerful structural concepts in intraday price discovery:
Trend alignment through EMAs
Liquidity reaction zones through VWAPs
Together, they provide directional clarity, timing, and trade location.
**Core Components**
**Three Trend EMAs**
• **EMA 7** – Microtrend and momentum speed
• **EMA 23** – Intraday trend leadership
• **EMA 50** – Higher-timeframe structure anchor
This trio shows how price accelerates, slows, flips bias, or compresses.
**Three Volume-Weighted Average Prices**
• **Daily VWAP** – Primary scalper reference point
• **Weekly VWAP** – Bias filter and intermediate balance zone
• **Monthly VWAP** – High-impact “magnet” where major reactions occur
VWAP represents the fair value where volume is distributed.
When price taps, rejects, or reclaims these levels, liquidity flow shifts — ideal for scalp-to-swing entries.
**What it helps you see**
• When price is aligned with or diverging from trend
• Where momentum will expand or fail
• Which levels larger participants defend
• Where the highest-probability reaction zones form
This is not a signal tool — it is a structure and decision-making framework used by professional intraday traders.
**How to use it**
1. **Trade with VWAP alignment** – expect reactions at daily/weekly/monthly VWAPs
2. **Follow EMA flow** – when EMAs compress or flip, momentum changes
3. **Look for price interaction** – rejection, reclaim, or breakthrough of a VWAP often leads to fast moves
Ideal for scalping, day-trading, futures, FX, indices, crypto, and metals.
**Customization**
Colors for each EMA and each VWAP can be personalized, allowing alignment with your charting workflow.
**Final Notes**
This system gives you the *context* most traders miss — where trend meets liquidity.
Use it as a roadmap to understand where price *should* react and when momentum is likely to shift.

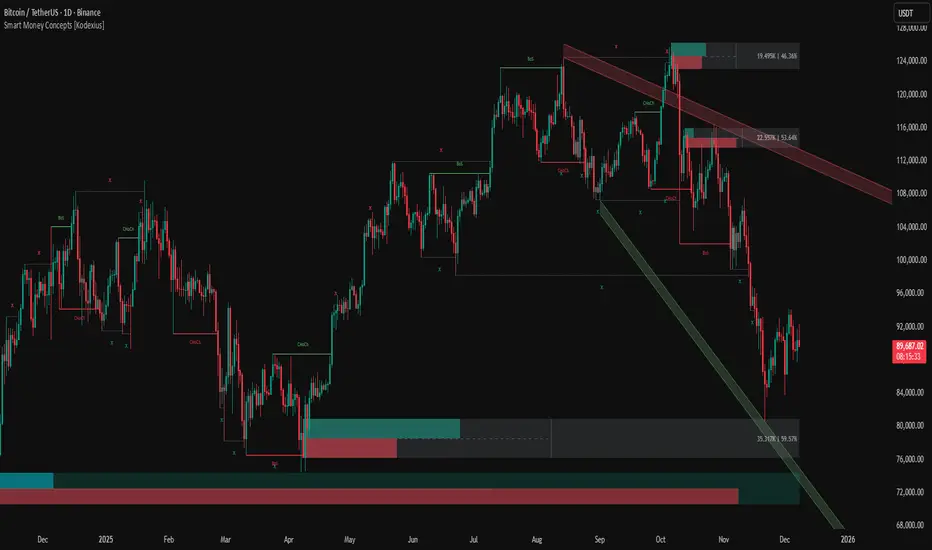
Smart Money Concepts [Kodexius]Smart Money Concepts is a comprehensive price action framework designed to visually organize many of the core ideas behind “smart money” and price action trading concepts. It brings together market structure, order blocks, imbalances, liquidity, premium/discount zones, swing failures and higher timeframe context into a single, coherent overlay on your chart. Instead of jumping between multiple tools, the script aims to give you a structured map of where price has been interacting with liquidity and value, and how that structure is evolving in real time.
All major components are modular and highly configurable, so you can keep only what you care about: from a minimal market structure view to a fully loaded institutional style dashboard. The focus of the script is visual clarity and context highlighting reaction zones, swept levels and structural transitions while letting you decide how to interpret and use that information in your own workflow.
🔹 Features
🔸 Market Structure Engine (CHoCH & BoS)
Change of Character (CHoCH) and Break of Structure (BoS) are complementary smart money market structure concepts that describe two different phases in how a trend evolves.
CHoCH refers to the first meaningful shift in structure that suggests the prevailing trend may be weakening and a new directional bias could be emerging (for example, a market that has been making higher highs and higher lows starts to form lower highs and lower lows).
BoS , on the other hand, is typically used as a confirmation of trend continuation: price extends beyond a key swing high in an uptrend or a key swing low in a downtrend, reinforcing that the existing directional structure remains intact.
Put simply, CHoCH is associated with a potential reversal in market character, while BoS underscores the continuation and extension of the current trend.
Script automatically detects and labels market structure shifts using swing based logic (Change of Character / CHoCH and Break of Structure / BoS).
Bullish Change of Character :
Bearish Change of Character :
Bullish Break of Structure :
Bearish Break of Structure :
Differentiates between first structural flips and continuation breaks, helping you see when the dominant direction is potentially shifting or being reinforced.
Draws structure reference lines at key swing levels so you can visually anchor where those events occurred on the chart.
🔸 Order Blocks with Volumetric Insight
Identifies bullish and bearish order blocks from the most relevant impulsive moves after structure breaks.
Bullish Order Block :
Bearish Order Block :
Each order block is drawn as a zone, with an internal split between “bullish” and “bearish” pressure, based on recent price/volume behavior inside that move.
Displays relative volume and simple volume percentages for the most recent blocks, giving an at a glance sense of which zones carried more activity.
Fully configurable display depth so you can limit the chart to only the last few highest priority blocks.
🔸 Breaker Blocks & Mitigation Tracking
Tracks when previously identified order blocks fail and converts them into breaker blocks, visually marking a change in how price is interacting with that zone.
Bullish Breaker Block :
Bearish Breaker Block :
Separate handling of bullish and bearish breakers with clear color differentiation.
Includes optional “mitigation” logic using either wick or close to determine when a block is considered broken or mitigated.
Breaker blocks are updated and removed dynamically as price trades through them, keeping the chart focused on current, active zones.
🔸 Fair Value Gaps (FVGs), Volume Imbalances & Opening Gaps
Detects imbalances in multiple modes: classic Fair Value Gaps (FVG), volume style imbalances (VI), and opening gaps (OG), with separate options for bullish and bearish sides.
Each imbalance is drawn as a zone, with a mid line reference to quickly locate the “mean” of the gap.
Optional sentiment overlay inside the gap, visually splitting the zone into bullish and bearish “gauge” segments based on recent bar behavior on a chosen timeframe.
Configurable mitigation method (wick or close) and maximum number of visible gaps, so the chart remains readable even on very active instruments.
For both order blocks and FVGs, internal sentiment boxes indicate how bullish or bearish the underlying move or gap has been, using proportional visual splits rather than raw numbers.
This gives an immediate visual cue as to whether a zone was driven more by upward or downward pressure.
🔸 Liquidity Sweeps, EQH/EQL and Volume Filter
Automatically detects areas where liquidity may be resting via swing based pivot highs and lows.
Sellside Liquidity Sweep :
Buyside Liquidity Sweep :
Highlights equal highs (EQH) and equal lows (EQL) when sweeps occur, marking where price probed above/below prior liquidity and then rejected.
Optional volume filter to ignore low volume swings and focus on more meaningful liquidity zones.
Maintains compact arrays of recent liquidity points, clearing them as price decisively trades through or sweeps them.
🔸 Premium / Discount Zones & Equilibrium
Projects premium and discount bands based on a dynamically measured range, offering a simple view of where price is trading relative to that range.
Draws separate Premium and Discount boxes with optional price labels for quick orientation.
Optional mid line (equilibrium) to visualize the “50%” of the current range, often used as a reference for balanced versus extended price.
Zones auto update as the underlying range evolves, with logic to prevent stale levels from cluttering the chart.
In addition script can also project previous session key levels such as open, high, low and equilibrium for a selected timeframe, with optional daily, weekly and monthly references. These levels are extended forward and automatically refreshed as new periods unfold, so you always have clear structural anchors from recent sessions without manually redrawing prior session lines.
🔸 Trend Line/Channel Framework
Detects swing based trendline pivots (uptrends and downtrends) with configurable sensitivity and choice of high/low or close as the source.
Draws trendline “channels” around the detected pivots, shading the area between upper and lower bounds to visualize directional bias zones.
Dynamically updates and deletes prior lines to keep the most recent structure visible, rather than leaving outdated lines on the chart.
Includes basic trendline break detection to highlight when price closes beyond a key diagonal boundary.
🔸 Swing Failure Pattern (SFP) Detector
Scans a chosen timeframe for Swing Failure Patterns (SFPs) using a defined lookback window and minimum separation between events.
Differentiates bullish and bearish SFPs, drawing labels and horizontal reference lines at the swept high or low.
Includes a “lock” period option to pause new SFP detection for a set number of bars after an event, helping to avoid clustering multiple signals in the same area.
🔸 HTF Candle Projection Panel
Projects higher timeframe candles to the right of current price as a compact visual panel, giving you context of higher timeframe structure without switching charts.
Supports both classic candles and Heikin Ashi style, with configurable size, spacing and number of projected candles.
Optionally uses higher timeframe OHLC or blends current timeframe behavior into the projection, depending on how strictly you want to reference HTF data.
Can display projected HTF open/high/low lines and price labels, helping you see where current price is trading within or relative to the larger candle.
🔸 Alert Framework
Built-in alerts for key structural events:
- Market structure changes (BoS, CHoCH) in both directions.
- New order blocks and breaker blocks forming, breaking or being approached.
- New FVGs forming and price moving into or near the latest imbalance zones.
- Liquidity sweeps (highs/lows), EQH/EQL touches and simple liquidity events.
- Price entering premium or discount bands.
- Trendline detection and basic trendline break events.
- Swing Failure Patterns and movements toward previous key levels.
Designed so that you can selectively enable only the conditions you care about and convert them into alerts that match your personal workflow.
Smart Money Concepts is built to function as a unified “map” of structure, liquidity and imbalance on the chart. Each module can be toggled and tuned, allowing you to build anything from a minimal structure only overlay to a fully featured institutional style view of how price interacts with key zones over time.
🔸 Originality & Usefulness
This script is built around a shared price action state, so market structure, order blocks, imbalances and liquidity are not drawn as independent overlays but as parts of the same engine.
At the core is a custom market structure module for CHoCH and BoS. Instead of only comparing the last swing high/low, it maintains an internal directional state and swing history so it can:
treat the first structural flip after an established leg as a Change of Character (CHoCH), and
treat subsequent breaks in the same direction as continuation Breaks of Structure (BoS).
Each event is anchored on the actual swing that defined it, and each swing can only trigger once, reducing repeated labels on minor fluctuations and making structural transitions easier to follow.
Order blocks are implemented with a volumetric profile, not just static rectangles. After a relevant structure event, the script identifies the impulsive move and:
draws the order block as a zone, internally split into “bullish” and “bearish” segments based on how price and volume behaved inside that move,
assigns each block its own traded volume and a relative percentage weight compared to other recent blocks.
The result is an at a glance view of which blocks carried more participation and whether the internal push was dominated by buying or selling, while older or lower priority blocks are automatically pruned to keep the chart clean.
Imbalance handling supports multiple gap types (Fair Value Gaps, volume style imbalances and opening gaps). Each gap is drawn as a zone with a midline, and can optionally be filled with a sentiment gauge: the gap is divided into bullish and bearish portions using recent bar behavior on a chosen timeframe, then updated as new data comes in. This makes it easy to see whether a gap remains one sided or is gradually being balanced out.
Liquidity and Swing Failure Patterns are treated as filtered events. Liquidity pools are detected from swing highs/lows and can pass through a dedicated volume filter: candidate levels are compared to a dynamic volume baseline, and low participation spikes are discarded. Only swings that traded with meaningful activity are tracked as potential liquidity, which are then monitored for sweeps, EQH/EQL tags and subsequent rejection. Once a level is decisively traded through or swept, its internal state is updated so the display does not accumulate stale points.
The SFP module operates on a user defined higher timeframe with a configurable lookback and lock period, so each Swing Failure Pattern is separated in time from the previous one. Combined with the liquidity volume filter, this produces a smaller set of structurally significant SFPs instead of dense clusters around the same area.
Higher timeframe context is further supported by the HTF candle projection panel, which projects compact candles to the right of price. These synthetic candles can reference strict HTF OHLC or blend current lower timeframe behavior into their bodies and wicks, so you can see where current action sits inside the larger structure without switching charts.
All major modules feed into a structured alert layer: market structure events (CHoCH/BoS), new and broken order blocks and breaker blocks, new and approached FVGs, liquidity sweeps, SFPs, moves into premium/discount, trendline events and movements toward key levels. Each alert corresponds to a well defined structural or liquidity update on the chart, rather than a black box trade call.
🔹 How to Use
You can adapt the script to very different workflows, but a common way to use it is:
1. Start from higher timeframe bias
Use the Market Structure Engine (CHoCH & BoS) and the HTF Candle Projection Panel to understand the dominant direction on your reference timeframe (e.g. H4 / Daily).
Combine this with the Premium/Discount Zones and previous session levels (daily/weekly/monthly open, high, low, equilibrium) to see whether price is trading in a relatively extended (premium) or discounted area of the current range.
2. Map your key reaction zones
Turn on Order Blocks with Volumetric Insight and Breaker Blocks to highlight the most relevant impulsive origin zones after structure breaks.
Focus primarily on the most recent blocks (configurable depth) and note their internal volume/sentiment split to prioritize which zones are likely to matter most.
Optionally add Fair Value Gaps / Volume Imbalances / Opening Gaps and, if desired, activate the internal sentiment gauge to see whether the imbalance was driven more by bullish or bearish pressure.
3. Watch how liquidity interacts with those zones
Enable Liquidity Sweeps & EQH/EQL to see where price has run resting liquidity above highs or below lows.
Combine this with the Swing Failure Pattern (SFP) detector to isolate moments where liquidity is taken and immediately rejected back into structure.
You can use the volume filter to ignore small, low volume swings and focus on more meaningful liquidity events.
4. Refine timing with local structure & trendlines
On your execution timeframe, use CHoCH/BoS labels, Trend Line/Channel Framework and SFPs inside or around your chosen OB/FVG zones.
Trendline channels give you diagonal context (where price is riding or breaking a local structure), while CHoCH/BoS marks when that micro structure starts to flip.
5. Use alerts as a monitoring layer, not as standalone signals
Set alerts for the events that matter to you:
– new or broken order blocks / breaker blocks,
– price approaching the latest OB/FVG or breaker zone,
– liquidity sweeps and SFPs,
– fresh CHoCH/BoS events in your key direction,
– entries into premium/discount bands or HTF projection levels.
Treat these alerts as prompts to look at the chart, not as automatic entry/exit rules. The script is designed as a decision support and mapping tool; trade execution, risk management and confirmation remain up to your own plan and discretion.
This tool is intended as a mapping and decision support aid, not as an automated trading system, and should be combined with your own analysis and risk management.
NOVA Breakout Signals v2.5I’m excited to share that version 2.5 includes meaningful upgrades and has backtested well on XAU/USD. The indicator plots LONG/SHORT labels only (no orders, SL/TP) and can shade the background by trend. Signals are de-duplicated with a cooldown and are raised on confirmed bars.
You can also use TradingView Alerts to get early notifications the moment price touches a breakout, without waiting for a candle close—addressing a key limitation of earlier versions.
Notes
• Indicator only (no automated trading).
• Use Alerts to route signals to your preferred workflow.
• For research/education; past performance ≠ future results.
Made by Kenny Nguyen (Vietnam).

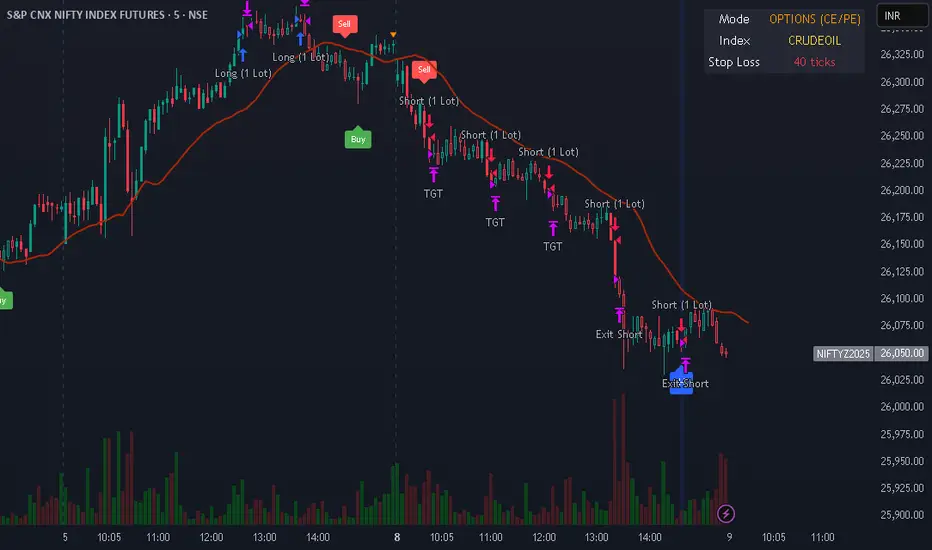
Intraday Options/Futures Naked By TradeEarnIntraday Momentum Strategy (Futures & Options)
Description: This strategy is designed for intraday momentum trading on Indian Indices (Nifty, BankNifty, FinNifty, Sensex) and Crude Oil. It combines Price Action (Impulse Candles) with strictly defined Momentum (RSI) and Trend Strength (ADX) indicators to filter out choppy markets and capture high-probability moves.
Key Features:
Instrument Flexibility: Supports both Futures (Long/Short) and Options Buying (Long CE/PE) modes.
Auto-Lot Sizing: Automatically calculates the correct Lot Size based on the selected Index (e.g., Nifty = 25, BankNifty = 15).
Rupee-Based Risk Management: Define Target, Stop Loss, and Trailing Stop directly in INR (Rupees) rather than points or percentages.
Choppiness Filter: Uses ADX > 20 to avoid trading in sideways markets.
Cooldown Mechanism: Incorporates a "Cooldown" period after every trade exit to prevent over-trading and whipsaws.
⚠️ Disclaimer (As per SEBI & RBI Guidelines)
Educational Purpose Only: This strategy/script is for educational and backtesting purposes only. It does not constitute financial advice, investment recommendations, or a tip to buy or sell any securities.
Risk Disclosure:
Market Risk: Trading in the stock market, especially in Derivatives (Futures & Options), involves a high degree of risk and the potential for significant financial loss. You may lose your entire capital.
No Guarantees: Past performance of this strategy (Backtest results) is not indicative of future results. Market conditions change, and algorithms may fail during live execution.
SEBI Registration: The creator of this script is not a SEBI Registered Investment Advisor (RIA) or Research Analyst (RA).
User Responsibility: By using this script, you acknowledge that you are solely responsible for your own trading decisions. Please consult a SEBI-registered financial advisor before deploying real capital. This script is not compliant with high-frequency trading regulations and is intended for manual or semi-automated analysis only.
美股宽广度指标NH-NLThe NH–NL breadth indicator is used to measure the underlying strength or weakness of the market (Market Breadth).
It tracks how many stocks are making 52-week new highs (New Highs) and 52-week new lows (New Lows), and calculates the difference between them.
This is one of the most widely followed institutional indicators of market health, helping traders observe:
• Whether an uptrend has real breadth support (i.e., whether most stocks are participating in the advance)
• Whether weakness is spreading during pullbacks (e.g., new lows expanding rapidly)
• Whether the medium-term structure is shifting (NH–NL often reveals trend changes earlier than price)
The core purpose of this breadth indicator is to help traders assess whether the market environment is suitable for increasing risk exposure, or whether they should reduce exposure and stay cautious.
NH–NL宽广度指标用于衡量市场内部的强弱结构(Market Breadth)。
它统计市场中有多少股票创 52 周新高(New Highs) 与 52 周新低(New Lows),并计算两者的差值
这是机构最常参考的市场健康度指标之一,用于观察:
• 上涨行情是否具备广度支持(是否多数股票都参与上涨)
• 回调过程中是否有恶化迹象(新低是否快速扩散)
• 中期结构是否变化(NH–NL 案例中最常见的是趋势转折提前出现)
这个宽广度指标核心价值是让交易者判断市场是否适合提高风险敞口或是否需要降低风险并观察。


UDL Matrix: MTF Divergence System [WangBlack]【使用說明 / How to Use】
多頭訊號 (Long Signal):出現綠色「多」標籤。
條件:UDL 進入超賣區 + K線出現反轉型態 + 趨勢過濾通過。
空頭訊號 (Short Signal):出現紅色「空」標籤。
條件:UDL 進入超買區 + K線出現反轉型態 + 趨勢過濾通過。
背離線 (Divergence Lines):
綠色實線:底背離(看漲)。
紅色實線:頂背離(看跌)。
背景色 (Background):
綠色背景:HTF(大級別)處於低位,適合做多。
紅色背景:HTF(大級別)處於高位,適合做空。
【適用市場】 加密貨幣、外匯(黃金 XAUUSD)、指數期貨。適合 1分/5分/15分/1小時 級別操作。
Here is the English translation for the "How to Use" section, optimized for TradingView descriptions:
【How to Use】
Long Signal:
Indicator: A Green label with the text "多" (Long) appears.
Conditions: UDL enters the Oversold zone + Candlestick Reversal Pattern detected + Trend Filter validation passed.
Short Signal:
Indicator: A Red label with the text "空" (Short) appears.
Conditions: UDL enters the Overbought zone + Candlestick Reversal Pattern detected + Trend Filter validation passed.
Divergence Lines:
Green Solid Line: Regular Bullish Divergence (Signal to Buy).
Red Solid Line: Regular Bearish Divergence (Signal to Sell).
Background Color (HTF Context):
Green Background: HTF (Higher Timeframe) is in a low zone; favorable for Long positions.
Red Background: HTF (Higher Timeframe) is in a high zone; favorable for Short positions.
【Applicable Markets】 Cryptocurrencies, Forex (specifically Gold/XAUUSD), and Index Futures. Recommended Timeframes: 1-minute, 5-minute, 15-minute, and 1-hour charts.
