IVX: Institutional Velocity X-Ray [Ash_TheTrader]The Intrabar Liquidity X-Ray: Seeing Institutional Speed Inside the Candle ⚡🐢
Stop getting trapped by standard candlesticks. It’s time to see how fast the money is actually moving.
A standard candlestick tells you four things: Open, High, Low, and Close. It’s the foundation of technical analysis.
But it hides the most important metric of all: Speed.
Two bullish 1-Hour candles can look identical on your chart. Both opened at $100 and closed at $105.
Candle A hit $105 in the first 5 minutes, then spent 55 minutes holding that level.
Candle B ground slowly upwards, finally hitting $105 in the 59th minute.
To a standard indicator, these candles are the same. To a professional trader, they are opposites. One shows aggressive, front-loaded institutional buying; the other shows weak, exhausted retail grinding.
As @Ash_TheTrader, I developed the Intrabar Liquidity X-Ray to solve this problem. It stops looking at the surface of the candle and looks inside it.
🧠 The Concept: Time-To-Form
This indicator uses advanced Pine Script technology to conduct an "X-Ray" scan of the bar you are looking at.
If you are on a 1-Hour chart, the script uses request.security_lower_tf to fetch the data of the 60 individual 1-minute bars hidden inside that single hour bar.
It then asks a critical question: How long did it take for this candle to achieve its ultimate High or Low?
In a Bullish candle, we measure the time it took to hit the specific minute of the bar's High.
In a Bearish candle, we measure the time it took to hit the specific minute of the bar's Low.
By measuring this "Time-To-Form," we can classify the intent behind the move.
⚡ The "Fast" Candle (Institutional Aggression)
When smart money wants to move an asset, they don't wait all day. They execute large block orders that move price rapidly to their desired level, and then they defend it.
The Signal: The indicator identifies a bar as "Fast" if it hits its High (for bulls) or Low (for bears) in the first 20% of the candle's duration.
The Visual: The bar turns Neon Cyan and is marked with a lightning bolt ⚡.
Interpretation by @Ash_TheTrader: This is urgent liquidity. Institutions are front-loading their orders. These levels are often strong zones of support or resistance on retests because the big players showed their hand early.
🐢 The "Slow" Candle (Retail Grind)
Conversely, when a move is driven by retail traders chasing price, or when a trend is exhausted, price struggles to make new extremes. It grinds slowly, taking the entire duration of the candle just to inch slightly higher or lower.
The Signal: The indicator identifies a bar as "Slow" if it takes more than 80% of the candle's duration to finally reach its High or Low.
The Visual: The bar turns Orange and is marked with a turtle 🐢 beneath it.
Interpretation by @Ash_TheTrader: This is "weak" movement. Even if the candle is green, if it took 58 minutes of a 60-minute bar just to make a new high, the buyers are exhausted. Be wary of reversals after seeing a cluster of 🐢 candles.
💻 Features and The Dashboard
To make this data actionable in real-time, I have engineered a clean Heads-Up Display (HUD) directly on the chart.
The On-Chart Dashboard: Located in the top right, the dashboard gives you the live stats of the current forming bar. It tells you exactly what percentage of the time has passed and whether the current structure is considered Institutional ⚡ or a Retail Grind 🐢.
Other Features:
Dual Polarity Logic: Works seamlessly for both bullish trends (tracking speed to Highs) and bearish trends (tracking speed to Lows).
Smart Volume Filtering: The indicator automatically ignores insignificant low-volume "noise" bars, only highlighting speed on candles with above-average volume.
Full Alert Capability: Set alerts for "Fast ⚡" detections to catch sudden institutional activity as it happens.
⚙️ Best Practices for Using This Tool
Because this tool looks inside a bar, it is designed to be used on Higher Timeframes.
Recommended Timeframes: 30-Minute, 1-Hour, 4-Hour, or Daily charts.
Do Not Use On: 1-Minute or 5-Minute charts. (You cannot effectively "X-Ray" a 1-minute bar using 1-minute data; the math doesn't work).
A Final Note from @Ash_TheTrader
Trading is about information asymmetry. The market hides the most valuable data beneath the surface of the Open and Close. Use the Intrabar Liquidity X-Ray to stop guessing the speed of the market and start seeing it.
Trade safe, trade smart.⚡
Indicatori e strategie

The Physics Engine [@Ash_TheTrader]🏛️ Welcome to the Physics of Finance
By @Ash_TheTrader
Traditional technical analysis often relies on "lagging" indicators. Tools like the RSI or moving averages tell you where price has been. While useful, they are like driving a car looking only in the rearview mirror.
The Kinematic Impulse Engine (KIE) is different. It is designed to be a leading indicator of momentum shifts.
It doesn't just look at price; it treats price action like a physical object moving through space to measure its Velocity (Speed), Acceleration (G-Force), and Mass (Volume). By understanding the physics behind a move, we can determine if a trend is a powerful impulse or an exhausted drift waiting to reverse.
⚛️ The Core Concept: Trading with G-Force
If you step on the gas pedal in a car, you feel pushed back into your seat. That is acceleration (positive G-Force). When you slam on the brakes, you are thrown forward. That is deceleration (negative G-Force).
The market works the same way.
Standard momentum indicators only measure speed. The KIE measures how fast that speed is changing.
The Problem with Standard Indicators: Price can be moving higher (high speed), but the rate at which it is moving higher is slowing down (deceleration). A standard indicator will still look bullish right up until the reversal happens.
The KIE Solution: The KIE detects that deceleration instantly, warning you that the "G-Force" pushing the price up has vanished, often before the price peaks.
🎨 Visual Decoder: Reading the Heatmap
We have eliminated the need to stare at complex oscillator lines below your chart. The KIE paints the candles directly based on their "Kinetic Energy."
1. Neon Cyan : The Impulse (High G-Force) 🚀
Physics State: High Velocity + Positive Acceleration.
Meaning: The market has "pedal to the metal." Buyers are aggressive, and the move is speeding up. This is where you want to be in a trade.
Signal: Look for the small triangles (🚀) marking the start of these impulse moves out of the noise.
2. Deep Purple : Exhaustion (Braking) 🛑
Physics State: High Velocity + Negative Acceleration (Deceleration).
Meaning: The car is still moving forward fast, but the driver has taken their foot off the gas or hit the brakes.
Signal: This is a massive warning sign. If you are long and candles turn purple, the trend is running on fumes. Expect consolidation or a reversal soon.
3. Dark Gray : Equilibrium (Chop) 💤
Physics State: Low Velocity.
Meaning: No significant energy present. The market is chopping sideways.
Signal: Stay out of the market or use range-bound strategies.
⚠️ Unique Feature: Gravity Divergence Detection
This is the most powerful feature of the Kinematic Impulse Engine. It detects when price action is defying the laws of physics.
Imagine throwing a ball into the air. As it reaches the very peak of its arc, it is still moving upward, but gravity is decelerating it rapidly just before it falls back down.
The KIE detects this exact moment in the market:
Gravity Sell Signal: Price makes a new high, but Acceleration (G-Force) crashes rapidly. The market is fighting gravity and will likely snap back.
If you see a "GRAVITY" label pop up on a Deep Purple candle at a high, take notice.
🧠 The Engine Room (Under the Hood)
For the technical traders, here is how @Ash_TheTrader designed the engine:
Relative Velocity: Price changes are normalized against Average True Range (ATR) volatility. A $10 move in Bitcoin is not the same as a $10 move in a penny stock; the KIE adjusts for this automatically.
Mass Integration (Volume Weighting): In physics, Force = Mass x Acceleration. The KIE optionally uses relative Volume as "Mass." A move backed by high volume has more "weight" and is harder to stop than a low-volume move.
The HUD: The on-screen dashboard gives you real-time readings of the current Velocity and raw G-Force metrics, along with an instant trend status summary.
🛡️ How to Use This in Your Trading
The Breakout Trader: Wait for gray candles (chop). Enter when the first Neon Cyan candle appears, ideally accompanied by an Impulse Triangle (🚀). Ride the cyan until it turns purple.
The Reversal Trader: Wait for an extended run of cyan candles. When the candles turn Deep Purple and you see a "GRAVITY" warning label, look for shorting opportunities as the momentum is exhausted.
Trade smart. Trade with physics.
Developed by @Ash_TheTrader

VWAP Mean Reversion v2 nice indicator based on volume and price action. it pays attention to RSI ema.VWAP. and many more indicators

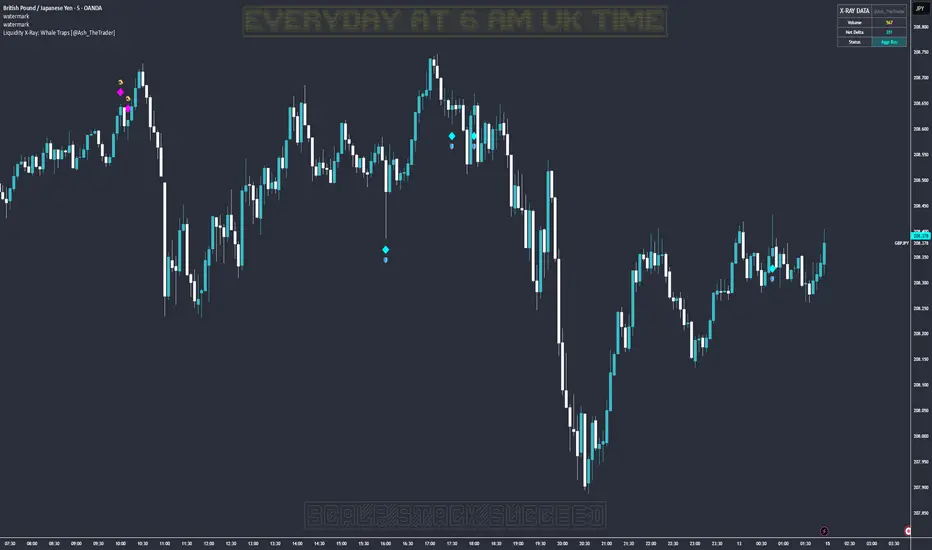
Liquidity X-Ray: Whale Traps [@Ash_TheTrader]👁️ Liquidity X-Ray: The Institutional Edge
Stop Trading Blind. See Inside the Candle.
Ninety percent of retail traders only see the outer shell of a candlestick—the Open, High, Low, and Close. They are trading blind to the actual battle that took place during that candle's formation.
Institutions, however, use expensive Order Flow software to see where aggressive buying or selling is happening in real-time.
The Liquidity X-Ray Strategy, developed by @Ash_TheTrader, levels the playing field. It uses advanced Intrabar Analysis to simulate institutional order flow footprints directly on your TradingView chart, automating powerful reversal signals based on "Absorption."
🧠 The Concept: Intrabar Analysis & Delta
How does it work?
Imagine a single 1-Hour candle. Inside that candle, there are sixty 1-Minute candles hidden from view.
This strategy performs an "X-Ray" scan. It tunnels into the lower timeframes (e.g., 5-minute data inside a 1-hour bar) to calculate the Net Delta—the difference between aggressive buying volume and aggressive selling volume.
Cyan Candles: Indicate that aggressive buyers (hitting the Ask) won the internal battle.
Magenta Candles: Indicate that aggressive sellers (hitting the Bid) won the internal battle.
But knowing who won isn't enough. The real edge comes from identifying Absorption.
🎯 The Signals: Detecting Traps & Shields
The core philosophy of this strategy by @Ash_TheTrader is simple: Identify where high effort yields low results.
When massive volume comes in, but price refuses to move, it means one side is being "absorbed" by a larger player. This is often the precursor to a violent reversal.
1. The Bear Trap (🪤)
What you see: A candle with massive volume and aggressive internal buying (positive Delta), yet the candle body remains small and fails to push price significantly higher.
The Psychology: Retail traders are FOMO-buying aggressively at a high. Institutional "Whales" are sitting on the other side, passively selling into this demand, absorbing all the buy orders without letting price rise.
The Result: Once the buyers are exhausted, the trap snaps shut, and price reverses downward.
Strategy Action: Enters a SHORT position.
2. The Bull Shield (🛡️)
What you see: A candle with massive volume and aggressive internal selling (negative Delta), yet the candle body remains small and fails to push price lower.
The Psychology: A "Stop Run" is occurring. Retail traders are panic-selling. Smart money is stepping in like a shield, absorbing all the sell pressure at a fixed level.
The Result: Once the sellers are exhausted, there is no one left to sell, and price rallies upward.
Strategy Action: Enters a LONG position.
⚡ Strategy Features & The Viral Dashboard
This isn't just an indicator; it's a complete, automated trading system.
Automated Execution: The script takes the trades for you when a Shield or Trap is confirmed upon candle close.
Smart Risk Management: It automatically places Stop Losses beyond the wick of the signal candle and targets a default 2:1 Risk/Reward ratio.
The Live Performance Panel: Look at the top right of your chart. The strategy features a built-in, professional-grade dashboard that displays real-time statistics. You can instantly see the strategy's Win Rate and Net Profit over the current historical data.
"Numbers don't lie. Don't just guess if a setup works; watch the win rate adjust in real-time." — @Ash_TheTrader
🛠️ How to Use This Strategy
For the best results, follow these institutional guidelines:
Timeframe: This strategy is most effective on Higher Timeframes where institutional volume is dominant. We recommend the 1-Hour (1H) or 4-Hour (4H) charts.
Intrabar Resolution (Settings): In the strategy settings, ensure the "Intrabar Resolution" is set lower than your chart timeframe. The default is 5 minutes, which is ideal for scanning inside 1H or 4H candles.
Confluence: While the strategy can be traded standalone, the best signals often occur near major support/resistance zones or key Fibonacci levels.
⚠️ Disclaimer
This strategy uses request.security_lower_tf to perform its calculations. While highly accurate, past performance on the dashboard does not guarantee future results. Always manage your risk responsibly.
Trade smart. See the liquidity.
~ @Ash_TheTrader
S&R Detector by Rakesh SharmaSupport & Resistance Auto-Detector
Automatically identifies key Support and Resistance levels with strength ratings
✨ Key Features:
🎯 Intelligent S/R Detection
Automatically finds Support and Resistance levels based on swing highs/lows
Shows strength rating (Very Strong, Strong, Medium, Weak)
Displays number of touches at each level
📅 Key Time-Based Levels
Previous Day High/Low (PDH/PDL) - Blue lines
Previous Week High/Low (PWH/PWL) - Purple lines
Optional Round Numbers for psychological levels
⚙️ Fully Customizable
Adjust sensitivity (5-20 pivot length)
Filter by minimum touches (1-10)
Control maximum levels displayed (3-20)
Optional S/R zones (shaded areas)
📊 Live Dashboard
Shows nearest Support/Resistance
Distance to key levels
Total S/R levels detected
🔔 Smart Alerts
PDH/PDL breakout signals
Visual markers on chart
Perfect for: Intraday traders, Swing traders, Price action analysis

Hybrid Confluence (RSI,MFI,StochRSI) Two-Tier Momentum Framework
Many traders explore multi-oscillator hybrid confluence approaches that combine momentum and volume signals—most commonly RSI, Money Flow Index (MFI), and Stochastic RSI—to study stretched market conditions. These hybrid concepts are widely used to analyze potential exhaustion zones, cycle extremes, and periods of sustained buying or selling pressure across different timeframes.
This script does not replicate, reverse-engineer, or replace any paid or closed-source indicator.
Instead, it provides a fully transparent framework built exclusively from standard, well-documented technical indicators. All calculations are explicit and configurable, allowing traders to study hybrid momentum behavior without relying on proprietary logic or black-box tools.
What the Script Does
1. Builds a hybrid momentum confluence model
The script combines three widely used oscillators:
• RSI (Relative Strength Index) — price momentum
• MFI (Money Flow Index) — volume-weighted momentum
• Stochastic RSI — momentum relative to its own recent range
Each component operates on a normalized 0–100 scale, allowing meaningful comparison and aggregation.
2. Implements a clear two-tier signal structure
Instead of producing a single binary buy/sell output, the script separates early pressure from extreme conditions:
2-of-3 Confluence (Setups)
When any two of the three oscillators reach oversold or overbought levels:
• Displayed as semi-transparent circles
• Indicates building pressure or a developing condition
• Designed as a heads-up, not a trade signal
3-of-3 Confluence (Signals)
When all three oscillators reach oversold or overbought levels:
• Displayed as prominent vertical bars spanning the oscillator range
• Represents extreme momentum alignment
• Intended to highlight potential exhaustion zones
3. Visualizes sustained pressure using consecutive signal intensity
When 3-of-3 conditions persist across multiple bars:
• Each consecutive bar becomes progressively darker
• Up to six discrete intensity levels
• Darkness reflects duration and persistence, not prediction
This helps visualize scenarios where markets continue pushing higher or lower before a major turning point, rather than assuming a single signal marks the exact top or bottom.
4. Works across markets and timeframes
Because all inputs rely on standard technical indicators:
• Works on crypto, equities, futures, and FX
• Scales naturally from intraday to higher timeframes
• Can be used on Daily and multi-day charts for macro context
Why This Script Is Useful
Traditional oscillators often produce isolated signals that lack context. This framework adds clarity by:
1. Requiring multi-indicator agreement instead of single-signal triggers
2. Separating early pressure from extreme conditions
3. Showing how momentum can persist before a reversal
4. Avoiding binary “buy now / sell now” outputs
5. Remaining transparent and configurable
This makes the tool especially useful for:
• Swing traders
• Macro and cycle-focused traders
• Crypto traders studying extended momentum phases
• Analysts who prefer contextual signals over rigid rules
How to Use
1. Adjust RSI, MFI, and StochRSI lengths to suit your timeframe
2. Observe 2-of-3 circles as early warnings of building pressure
3. Watch 3-of-3 bars for extreme momentum alignment
4. Note increasing bar intensity as pressure persists
5. Combine with structure, trend, volume, or price action for decisions
This script is best used as a contextual tool, not a standalone trading system.
What This Script Is Not
• Not a recreation of any paid or proprietary indicator
• Not affiliated with any trading educator or platform
• Not intended as a predictive or standalone trading system
• Does not claim to identify exact tops or bottoms
All signals are derived solely from openly documented RSI, MFI, and Stochastic RSI calculations.
Important Notes
• This script is original, with a transparent methodology
• All calculations use standard, well-known technical formulas
• No hidden logic or undisclosed weighting is used
• Signal visuals are descriptive, not predictive
Disclaimer
This tool is provided for educational and analytical purposes only.
It does not constitute financial advice or a recommendation to trade.
Always validate settings, test on multiple assets and timeframes, and use proper risk management before trading live.

Order Blocks v2This is a short code script that shows you a REAL Order Blocks.
There is many indicators that show you random blocks on the screen, these are by definition Order Blocks. The code is simple and short.
You can use this indicator as an extra confluence or as a place to put your stop losses or to put your stop losses in profit.
I recommend always keeping the "Consider order block only with following FVG" on, as the best Order Blocks are found with that setting on.
I have a lot more code i can share, use this and let me know how it works for you!
THE SETTINGS I USE ARE:
(NO) Only show on on time levels 3,7,11,14
fractal bars 3
Order blocks on break of Fractal close or HL Close
(YES) Consider order block only with following FVG
Max distance of FVG following Order Blocks 2
Oder Block Height Body
Dotted 13 length and 3 width

E-MasterE-Master v2.5.2 is an internal development build created for structural testing and layout consistency experiments.
This script was not designed for practical trading use and is currently maintained only to observe how different visual components behave under various chart conditions. The calculations, filters, and outputs are incomplete, unoptimized, and may change without notice.
The indicator may produce irregular visuals, unclear states, or seemingly redundant information. Interpretation is intentionally non-intuitive and may not align with standard technical analysis practices.
E-Master does not generate actionable signals, trade recommendations, or reliable confirmations. Any apparent patterns or reactions should be considered coincidental and unsuitable for decision-making.
Due to its experimental nature, this tool may behave inconsistently across symbols, timeframes, or market environments. Users are strongly discouraged from relying on it for analysis, execution, or strategy development.
This script exists solely for testing, debugging, and exploratory purposes during ongoing development.

RSI Multi-TimeFrame [PACHI]This will show a Table with multiple time frames RSI levels.
> 68 the table cell will be red for given timeframe to indicate overbought
< 35 the table cell will be green for given timeframe to indicate oversold
there are few settings you can play with. if you have any suggestions, let me know.
// Pachi

P-MASTER v7.0--(Master Indicator)P-MASTER is a visual analytical tool designed to help traders observe price behavior under varying market conditions, with a particular focus on balance, consolidation, and non-directional movement.
The indicator highlights how price reacts when momentum slows down, compresses, or transitions into sideways structures. This makes it especially useful for identifying periods where the market is no longer trending aggressively and begins to exhibit rotational or range-based characteristics.
Rather than predicting future price direction, P-MASTER emphasizes context. It assists traders in understanding whether price is expanding, stabilizing, or entering a state of equilibrium. This perspective can be valuable when evaluating trade timing, managing expectations, or deciding when not to trade.
The tool is suitable for multiple timeframes and can be applied across different asset classes. It is commonly used as a secondary confirmation layer to complement discretionary price analysis, helping traders stay aligned with the current market environment rather than forcing directional bias.
P-MASTER does not rely on signals or alerts intended for direct trade execution. Instead, it serves as a structural lens, offering insight into how price evolves during low-volatility phases, transitional zones, and sideways regimes.
This indicator is best utilized by traders who prioritize market structure, patience, and situational awareness over aggressive forecasting.
Designed for analytical purposes only.

FLUXO COMPRA E VENDA MGThe “FLUXO COMPRA E VENDA MG” indicator is a scoring-based system designed to evaluate buying and selling pressure by combining trend, volume, order flow, momentum, and Smart Money concepts (liquidity, sweeps, and FVG).
It does not rely on a single condition. Instead, it aggregates multiple weighted factors and only generates buy or sell signa

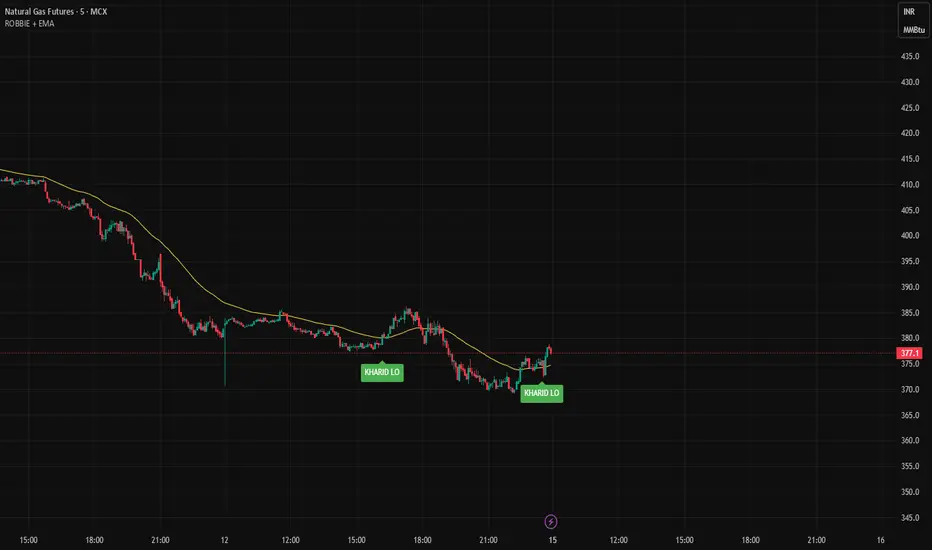
ROBBIE + EMA1️⃣ Purpose
This indicator identifies Knoxville Divergence signals (Rob Booker method) while filtering trades according to trend using an EMA.
Bullish signal: Price shows divergence and is above EMA → buy bias.
Bearish signal: Price shows divergence and is below EMA → sell bias.
It combines price pivots, RSI divergence, momentum, and EMA trend for higher-probability signals.
2️⃣ Key Components
a) Inputs
rsiLength → Period for RSI (default 14)
momLength → Period for Momentum (default 10)
pivotLen → Lookback for pivot detection (default 5)
emaLength → EMA period for trend filter (default 50)
b) Pivot Detection
ta.pivotlow() → detects price and RSI lows
ta.pivothigh() → detects price and RSI highs
Only pivots confirmed after pivotLen bars are used for divergence logic.
c) Knoxville Divergence Logic
Bullish Divergence:
Price forms a lower low
RSI forms a higher low
Momentum > 0
Price above EMA (trend confirmation)
Bearish Divergence:
Price forms a higher high
RSI forms a lower high
Momentum < 0
Price below EMA (trend confirmation)
AlphaWave Band + Tao Trend Start/End (JH) v1.1AlphaWave Band + Tao Trend Start/End (JH)
이 지표는 **“추세구간만 먹는다”**는 철학으로 설계된 트렌드 시각화 & 트리거 도구입니다.
예측하지 않고,
횡보를 피하고,
이미 시작된 추세의 시작과 끝만 명확하게 표시하는 데 집중합니다.
🔹 핵심 개념
AlphaWave Band
→ 변동성 기반으로 기다려야 할 자리를 만들어 줍니다.
TAO RSI
→ 과열/과매도 구간에서 지금 반응해야 할 순간을 정확히 짚어줍니다.
🔹 신호 구조 (단순 · 명확)
START (▲ 아래 표시)
추세가 시작되는 구간
END (▼ 위 표시)
추세가 종료되는 구간
> 중간 매매는 각자의 전략 영역이며,
이 지표는 추세의 시작과 끝을 시각화하는 데 목적이 있습니다.
🔹 시각적 특징
20 HMA 추세선
상승 추세: 노란색
하락 추세: 녹색
횡보 구간: 중립 색상
기존 밴드와 세력 표시를 훼손하지 않고
추세 흐름만 직관적으로 강조
🔹 추천 사용 구간
3분 / 5분 (단타 · 스캘핑)
일봉 (중기 추세 확인)
> “예측하지 말고, 추세를 따라가라.”
---
📌 English Description (TradingView)
AlphaWave Band + Tao Trend Start/End (JH)
This indicator is designed with one clear philosophy:
“Trade only the trend.”
No prediction.
No noise.
No meaningless sideways signals.
It focuses purely on visualizing the START and END of trend phases.
🔹 Core Concept
AlphaWave Band
→ Defines where you should wait based on volatility.
TAO RSI
→ Pinpoints when price reaction actually matters near exhaustion zones.
🔹 Signal Logic (Clean & Minimal)
START (▲ below price)
Marks the beginning of a trend
END (▼ above price)
Marks the end of a trend
> Entries inside the trend are trader-dependent.
This tool is about structure, not over-signaling.
🔹 Visual Design
20 HMA Trend Line
Uptrend: Yellow
Downtrend: Green
Sideways: Neutral
Trend visualization without damaging existing bands or volume context
🔹 Recommended Timeframes
3m / 5m for scalping & intraday
Daily for higher timeframe trend structure
> “Don’t predict. Follow the trend.”

Robbie BhaiyaMy first indicator. I would like to create something which gives you realtime buy and sell signal.

AI Adaptive Supertrend ChannelAI Supertrend Channel – The Adaptive Trend System
Beyond Basic Supertrend: An Intelligent Trading Framework
The AI Adaptive Supertrend Channel transcends traditional trend following indicators by delivering a self-optimizing trading system. Its core innovation is a triple-adaptive engine that automatically adjusts channel width based on real-time market conditions:
Market Efficiency Detection – Widens during clean trends, tightens in choppy ranges
Normalized Volatility – Scales appropriately to any asset's price level
Dynamic Momentum Response – Expands aggressively during powerful directional moves
The Result: A smarter tool that reduces false signals in consolidation while giving trends ample room to run—eliminating the constant parameter tweaking required by static indicators.
Visual Signal Framework & Strategic Applications
Channel Architecture:
Primary Trend Line (Thick Green/Red): Your dynamic trailing stop and core trend indicator. Green signals an uptrend (buying bias), Red signals a downtrend (selling bias).
Upper & Lower Bands: Form a dynamic support/resistance channel around the trend.
Mid-Line: A critical mean reversion level and the trigger for key early signals.
Trading Signals & Strategic Meaning:
Primary Signal: Momentum Diamonds (High Conviction)
💎 Green Diamond (Higher High): Price closes above the Upper Band after making a new high. Signals strong bullish momentum continuation. Ideal for adding to long positions or entering new longs in an established uptrend.
💎 Red Diamond (Lower Low): Price closes below the Lower Band after making a new low. Signals strong bearish momentum continuation. Ideal for adding to short positions or entering new shorts in a downtrend.
Secondary Signal: Mid-Line Crosses (Early Action)
🔼 Green Triangle (Bullish Mid-Line Cross - bullMidCross): Price crosses above the Mid-Line. This is an early bullish pullback signal within a larger uptrend or a potential early reversal sign in a downtrend. Use for early entries or to confirm the end of a bearish pullback.
🔽 Red Triangle (Bearish Mid-Line Cross - bearMidCross): Price crosses below the Mid-Line. This is an early bearish pullback signal within a larger downtrend or a potential early warning of weakness in an uptrend. Use for early short entries or to take profits on longs.
Practical Trading Strategies
Trend Following: Align trades with the Primary Trend Line color. Use the line itself as a dynamic stop-loss. The Momentum Diamonds confirm the trend's strength.
Pullback Trading: Use the Mid-Line Cross triangles (bullMidCross/bearMidCross) to identify high-probability entries during trend retracements. The channel bands provide natural profit targets.
Breakout Confirmation: A Momentum Diamond following a period of consolidation often confirms a genuine breakout, offering a signal to enter with the new momentum.
Optimal Settings Guide
Default (Universal)
For most markets, timeframes
ATR: 13 | ER: 144 | Channel Width: 0.7
Volatility Factor: 100 | Vol MA: HMA | Trend MA: EMA
Day Trading (Fast, Responsive)
*15M-1H charts, scalping*
ATR: 8 | ER: 89 | Channel Width: 0.6
Volatility Factor: 120 | Vol MA: EMA | Trend MA: WMA
*Swing Trading (Smooth, Conservative)*
*Daily-Weekly, position trading*
ATR: 21 | ER: 200 | Channel Width: 0.9
Volatility Factor: 80 | Vol MA: HMA | Trend MA: LINREG
Channel Width × Factor
0.5-0.7 → Tighter (more signals, less room)
0.8-1.2 → Wider (fewer signals, more room to run)
Volatility Regime Factor
50-80 → Less sensitive to volatility (stable markets)
100-150 → More sensitive (volatile markets like crypto)
Base ATR Length
8-13 → Faster signals (lower timeframes)
17-21 → Smoother signals (higher timeframes)
Quick Adjustments:
Whipsaws → Increase Channel Width × Factor
Lagging → Decrease ATR Length
Volatile markets → Increase Volatility Regime Factor
Start with Default, adjust one parameter at a time based on your market and trading style.

AlphaGen ME V.15.12AlphaGen ME V.15.10 is an ATR-based trend-following strategy with dynamic trailing stops and EMA filter, designed for automated Crypto perpetual trading.
Core Logic:
• ATR Trailing Stops: Dynamically adjusts stop-loss using ATR(10) × 3.0 multiplier
• 200 EMA Trend Filter: Optional Only takes longs above EMA, shorts below EMA
• Reversal System: Flips positions when trend changes (filter-aware)
• MACD Acceleration Exit: Optional momentum-based profit taking
Position Sizing Modes:
• Simple % of Equity (default 90%) - Safe leverage control
• Risk % of Equity - Fixed risk per trade
• Fixed Contract Size - Consistent lot sizing
Webhook Integration:
Routes signals directly to AlphaGen-AI for execution on:
• Hyperliquid DEX
• AsterDEX
Requirements:
• AlphaGen-AI Pro subscription for webhook routing
• Hyperliquid or AsterDEX Wallets
• TradingView alerts configured with passphrase
Risk Disclosure: Trading involves substantial risk. Past performance does not guarantee future results. Only trade with capital you can afford to lose.

8.2 PRO @Mavrick8.2 PRO @Mavrick is a professional-grade predictive momentum indicator designed for traders who want early, high-confidence entries.
It intelligently combines trend structure, volume behavior, RSI, MACD, and price velocity to anticipate market moves before they fully develop. The indicator features auto-adaptive targets for BTC, ETH, SOL, and altcoins, advanced fake pump/dump detection, and an early momentum warning system to stay ahead of reversals.
A clean smart signal table displays real-time market strength, confidence levels, and actionable BUY/SELL readiness.
Best performance in strong trends and high-volume environments.

KOBK KILLSHOT PRO V 1.0KOBK KILLSHOT PRO is an advanced trading system that combines multiple layers of technical analysis into one powerful, easy-to-use indicator. Whether you're scalping on lower timeframes or swing trading, this indicator provides crystal-clear entry and exit signals backed by comprehensive market analysis.
## 📝 **TradingView Publication Description**
---
### **Title:**
**KOBK KILLSHOT PRO - Advanced Multi-Timeframe Signal System**
---
### **Short Description:**
Professional-grade trading indicator combining multiple proprietary confirmation layers for high-probability entries and exits. Features intelligent signal quality rating, real-time dashboard, and adaptive exit strategies. Designed for serious traders who demand precision.
---
### **Full Description:**
**KOBK KILLSHOT PRO** is an advanced trading system that combines multiple layers of technical analysis into one powerful, easy-to-use indicator. Whether you're scalping on lower timeframes or swing trading, this indicator provides crystal-clear entry and exit signals backed by comprehensive market analysis.
---
## 🎯 **KEY FEATURES:**
**Smart Signal System:**
- Clear BUY and SELL labels appear directly on your chart
- Quality rating system (★★★★★) shows signal strength
- Early warning dots alert you to potential setups before they trigger
- Color-coded bars show trend direction at a glance
**Real-Time Dashboard:**
- Live ENTRY SIGNAL status (🟢 BUY NOW / 🔴 SELL NOW / ⏳ WAIT)
- Live EXIT SIGNAL status (🟠 EXIT NOW / ✋ HOLD)
- Current position tracking (LONG/SHORT/FLAT)
- Multiple confirmation indicators displayed in real-time
- Trend, momentum, and strength metrics updated every candle
**Flexible Exit Strategies:**
Choose from three exit modes:
- **Flip Mode:** Exit when opposite signal fires (simplest)
- **Momentum Shift:** Exit when momentum changes (faster)
- **Trail Lock:** Trailing stop that locks in profits (let winners run)
**Professional Visuals:**
- Clean, uncluttered chart interface
- Customizable colors and display options
- Toggle individual components on/off
- Works on any timeframe from seconds to daily
---
## 📊 **HOW TO USE IT:**
### **FOR BEGINNERS:**
**Step 1: Add to Chart**
- Apply KOBK KILLSHOT PRO to your chart
- Default settings work great for most traders
- Recommended timeframes: 15-second to 15-minute for active trading
**Step 2: Watch for Signals**
- **GREEN "BUY" label** = Enter LONG position
- **RED "SELL" label** = Enter SHORT position
- **Orange "EXIT" X** = Close your position
- Check the dashboard in top-right corner for confirmation
**Step 3: Follow the Quality Rating**
- **★★★★★ (5 stars)** = Highest probability setup - take these!
- **★★★★☆ (4 stars)** = Strong setup - good to trade
- **★★★☆☆ (3 stars)** = Decent setup - use caution
- **Lower ratings** = Skip unless very experienced
**Step 4: Use the Dashboard**
The live HUD tells you everything you need:
- **Entry Signal:** Shows when to enter (BUY NOW / SELL NOW / WAIT)
- **Exit Signal:** Shows when to exit (EXIT NOW / HOLD)
- **Position:** Tracks if you're LONG, SHORT, or FLAT
- **Quality:** Current signal strength rating
---
### **FOR ADVANCED TRADERS:**
**Customization Options:**
- Adjust signal sensitivity via Key Value parameter
- Control ATR period for different market conditions
- Enable/disable individual filter components
- Choose signal quality threshold (Maximum/High/Medium/Standard)
- Select preferred exit strategy based on trading style
**Filter System:**
The indicator includes multiple proprietary filters that can be toggled individually:
- Trend alignment filters
- Momentum confirmation filters
- Volatility filters
- Flow strength analysis
- Key zone detection
**Signal Quality Control:**
Set minimum quality requirements:
- **Maximum:** Only 5-star signals (very selective)
- **High:** 4-star minimum (recommended for most)
- **Medium:** 3-star minimum (more opportunities)
- **Standard:** 2-star minimum (active trading)
- **All Signals:** Every signal (experienced only)
---
## ⚙️ **RECOMMENDED SETTINGS:**
**For Scalping (15-second to 1-minute charts):**
- Key Value: 1.0
- ATR Period: 10
- Signal Quality: High (4-star minimum)
- Exit Mode: Flip or Momentum Shift
**For Day Trading (5-minute to 15-minute charts):**
- Key Value: 1.0 to 1.5
- ATR Period: 14
- Signal Quality: High
- Exit Mode: Trail Lock
**For Swing Trading (1-hour+ charts):**
- Key Value: 1.5 to 2.0
- ATR Period: 14-20
- Signal Quality: Maximum (5-star only)
- Exit Mode: Trail Lock
---
## 🎮 **SIMPLE TRADING RULES:**
1. **Wait for the signal** - Don't predict, let the indicator tell you
2. **Check the stars** - Higher quality = higher probability
3. **Verify the dashboard** - Make sure Entry Signal shows BUY NOW or SELL NOW
4. **Enter immediately** - When signal fires, don't hesitate
5. **Follow the exit** - When EXIT NOW appears, close the position
6. **Be disciplined** - Trust the system, don't override it
---
## ⚠️ **IMPORTANT NOTES:**
- **Not a holy grail:** No indicator is perfect. Use proper risk management.
- **Backtest first:** Test on demo/paper account before using real money.
- **Position sizing matters:** Never risk more than 1-2% per trade.
- **Market conditions vary:** Some days are better than others.
- **Combine with fundamentals:** Technical signals work best with good market context.
---
## 🔧 **DISPLAY OPTIONS:**
Toggle on/off as needed:
- Live Dashboard (HUD)
- Signal Quality Stars
- Early Warning Signals
- Key Zone Markers
- Trend Lines
- Additional confirmation indicators
---
## 📈 **BEST MARKETS TO USE:**
Works on any liquid market:
- Futures (NQ, ES, YM, etc.)
- Forex pairs (major and minor)
- Crypto (BTC, ETH, etc.)
- Stocks (high volume)
- Indices
---
## 💡 **PRO TIPS:**
1. **Start with higher quality settings** (4-5 stars only) until you're comfortable
2. **Use the early warning dots** to prepare for entries (get your finger ready)
3. **Pay attention to the dashboard trend indicator** - trade with the trend
4. **Don't trade during major news events** - wait for clear market direction
5. **Keep a trading journal** - track which star ratings work best for your style
6. **Adjust Key Value if needed** - higher = fewer signals, lower = more signals
---
## 🎯 **WHAT MAKES THIS DIFFERENT:**
Unlike simple indicators that just draw lines or show one metric, KOBK KILLSHOT PRO combines multiple proprietary analysis layers into one cohesive system. The intelligent filtering ensures you only see high-probability setups, while the real-time dashboard keeps you informed of market conditions every step of the way.
The star rating system is particularly powerful - it instantly tells you how many confirmation factors are aligned, so you can make quick decisions about which signals to take and which to skip.
---
## 📞 **SUPPORT:**
For questions, setup help, or optimization tips, feel free to reach out via TradingView messages. I'm here to help you succeed with this system!
---
**Disclaimer:** This indicator is for educational and informational purposes only. Trading involves substantial risk. Past performance does not guarantee future results. Always use proper risk management and never trade with money you can't afford to lose.
---
## 🏆 **START TRADING SMARTER TODAY**

new takesi_2Step_Screener_MOU_KAKU_FIXED4 (Visible)//@version=5
indicator("MNO_2Step_Screener_MOU_KAKU_FIXED4 (Visible)", overlay=true, max_labels_count=500)
// =========================
// Inputs
// =========================
emaSLen = input.int(5, "EMA Short (5)")
emaMLen = input.int(13, "EMA Mid (13)")
emaLLen = input.int(26, "EMA Long (26)")
macdFast = input.int(12, "MACD Fast")
macdSlow = input.int(26, "MACD Slow")
macdSignal = input.int(9, "MACD Signal")
macdZeroTh = input.float(0.2, "MOU: MACD near-zero threshold", step=0.05)
volLookback = input.int(5, "Volume MA days", minval=1)
volMinRatio = input.float(1.3, "MOU: Volume ratio min", step=0.1)
volStrong = input.float(1.5, "Strong volume ratio (Breakout/KAKU)", step=0.1)
volMaxRatio = input.float(3.0, "Volume ratio max (filter)", step=0.1)
wickBodyMult = input.float(2.0, "Pinbar: lowerWick >= body*x", step=0.1)
pivotLen = input.int(20, "Resistance lookback", minval=5)
pullMinPct = input.float(5.0, "Pullback min (%)", step=0.1)
pullMaxPct = input.float(15.0, "Pullback max (%)", step=0.1)
breakLookbackBars = input.int(5, "Pullback route: valid bars after break", minval=1)
// --- Breakout route (押し目なし初動ブレイク) ---
useBreakoutRoute = input.bool(true, "Enable MOU Breakout Route (no pullback)")
breakConfirmPct = input.float(0.3, "Break confirm: close > R*(1+%)", step=0.1)
bigBodyLookback = input.int(20, "Break candle body MA length", minval=5)
bigBodyMult = input.float(1.2, "Break candle: body >= MA*mult", step=0.1)
requireCloseNearHigh = input.bool(true, "Break candle: close near high")
closeNearHighPct = input.float(25.0, "Close near high threshold (% of range)", step=1.0)
allowMACDAboveZeroInstead = input.bool(true, "Breakout route: allow MACD GC above zero instead")
// 表示
showEMA = input.bool(true, "Plot EMAs")
showMou = input.bool(true, "Show MOU label")
showKaku = input.bool(true, "Show KAKU label")
// ★ここを改善:デバッグ表はデフォルトON
showDebugTbl = input.bool(true, "Show debug table (last bar)")
// ★稼働確認ラベル(最終足に必ず出す)
showStatusLbl = input.bool(true, "Show status label (last bar always)")
locChoice = input.string("Below Bar", "Label location", options= )
lblLoc = locChoice == "Below Bar" ? location.belowbar : location.abovebar
// =========================
// EMA
// =========================
emaS = ta.ema(close, emaSLen)
emaM = ta.ema(close, emaMLen)
emaL = ta.ema(close, emaLLen)
plot(showEMA ? emaS : na, color=color.new(color.yellow, 0), title="EMA 5")
plot(showEMA ? emaM : na, color=color.new(color.blue, 0), title="EMA 13")
plot(showEMA ? emaL : na, color=color.new(color.orange, 0), title="EMA 26")
emaUpS = emaS > emaS
emaUpM = emaM > emaM
emaUpL = emaL > emaL
goldenOrder = emaS > emaM and emaM > emaL
above26_2days = close > emaL and close > emaL
// 勝率維持の土台(緩めない)
baseTrendOK = (emaUpS and emaUpM and emaUpL) and goldenOrder and above26_2days
// =========================
// MACD
// =========================
= ta.macd(close, macdFast, macdSlow, macdSignal)
macdGC = ta.crossover(macdLine, macdSig)
macdUp = macdLine > macdLine
macdNearZero = math.abs(macdLine) <= macdZeroTh
macdGCAboveZero = macdGC and macdLine > 0 and macdSig > 0
macdMouOK = macdGC and macdNearZero and macdUp
macdBreakOK = allowMACDAboveZeroInstead ? (macdMouOK or macdGCAboveZero) : macdMouOK
// =========================
// Volume
// =========================
volMA = ta.sma(volume, volLookback)
volRatio = volMA > 0 ? (volume / volMA) : na
volumeMouOK = volRatio >= volMinRatio and volRatio <= volMaxRatio
volumeStrongOK = volRatio >= volStrong and volRatio <= volMaxRatio
// =========================
// Candle patterns
// =========================
body = math.abs(close - open)
upperWick = high - math.max(open, close)
lowerWick = math.min(open, close) - low
pinbar = (lowerWick >= wickBodyMult * body) and (lowerWick > upperWick) and (close >= open)
bullEngulf =
close > open and close < open and
close >= open and open <= close
bigBull =
close > open and
open < emaM and close > emaS and
(body > ta.sma(body, 20))
candleOK = pinbar or bullEngulf or bigBull
// =========================
// Resistance / Pullback route
// =========================
res = ta.highest(high, pivotLen)
pullbackPct = res > 0 ? (res - close) / res * 100.0 : na
pullbackOK = pullbackPct >= pullMinPct and pullbackPct <= pullMaxPct
brokeRes = ta.crossover(close, res )
barsSinceBreak = ta.barssince(brokeRes)
afterBreakZone = (barsSinceBreak >= 0) and (barsSinceBreak <= breakLookbackBars)
pullbackRouteOK = afterBreakZone and pullbackOK
// =========================
// Breakout route (押し目なし初動ブレイク)
// =========================
breakConfirm = close > res * (1.0 + breakConfirmPct / 100.0)
bullBreak = close > open
bodyMA = ta.sma(body, bigBodyLookback)
bigBodyOK = bodyMA > 0 ? (body >= bodyMA * bigBodyMult) : false
rng = math.max(high - low, syminfo.mintick)
closeNearHighOK = not requireCloseNearHigh ? true : ((high - close) / rng * 100.0 <= closeNearHighPct)
mou_breakout =
useBreakoutRoute and
baseTrendOK and
breakConfirm and
bullBreak and
bigBodyOK and
closeNearHighOK and
volumeStrongOK and
macdBreakOK
mou_pullback = baseTrendOK and volumeMouOK and candleOK and macdMouOK and pullbackRouteOK
mou = mou_pullback or mou_breakout
// =========================
// KAKU (Strict): 8条件 + 最終三点
// =========================
cond1 = emaUpS and emaUpM and emaUpL
cond2 = goldenOrder
cond3 = above26_2days
cond4 = macdGCAboveZero
cond5 = volumeMouOK
cond6 = candleOK
cond7 = pullbackOK
cond8 = pullbackRouteOK
all8_strict = cond1 and cond2 and cond3 and cond4 and cond5 and cond6 and cond7 and cond8
final3 = pinbar and macdGCAboveZero and volumeStrongOK
kaku = all8_strict and final3
// =========================
// Display (猛 / 猛B / 確)
// =========================
showKakuNow = showKaku and kaku
showMouPull = showMou and mou_pullback and not kaku
showMouBrk = showMou and mou_breakout and not kaku
plotshape(showMouPull, title="MOU_PULLBACK", style=shape.labelup, text="猛",
color=color.new(color.lime, 0), textcolor=color.black, location=lblLoc, size=size.tiny)
plotshape(showMouBrk, title="MOU_BREAKOUT", style=shape.labelup, text="猛B",
color=color.new(color.lime, 0), textcolor=color.black, location=lblLoc, size=size.tiny)
plotshape(showKakuNow, title="KAKU", style=shape.labelup, text="確",
color=color.new(color.yellow, 0), textcolor=color.black, location=lblLoc, size=size.small)
// =========================
// ★稼働確認:最終足に必ず出すステータスラベル
// =========================
var label status = na
if showStatusLbl and barstate.islast
label.delete(status)
statusTxt =
"MNO RUNNING " +
"MOU: " + (mou ? "YES" : "no") + " (pull=" + (mou_pullback ? "Y" : "n") + " / brk=" + (mou_breakout ? "Y" : "n") + ") " +
"KAKU: " + (kaku ? "YES" : "no") + " " +
"BaseTrend: " + (baseTrendOK ? "OK" : "NO") + " " +
"MACD(mou): " + (macdMouOK ? "OK" : "NO") + " / MACD(zeroGC): " + (macdGCAboveZero ? "OK" : "NO") + " " +
"Vol: " + (na(volRatio) ? "na" : str.tostring(volRatio, format.mintick)) + " " +
"Pull%: " + (na(pullbackPct) ? "na" : str.tostring(pullbackPct, format.mintick))
status := label.new(bar_index, high, statusTxt, style=label.style_label_left,
textcolor=color.white, color=color.new(color.black, 0))
// =========================
// Alerts
// =========================
alertcondition(mou, title="MNO_MOU", message="MNO: MOU triggered")
alertcondition(mou_breakout, title="MNO_MOU_BREAKOUT", message="MNO: MOU Breakout triggered")
alertcondition(mou_pullback, title="MNO_MOU_PULLBACK", message="MNO: MOU Pullback triggered")
alertcondition(kaku, title="MNO_KAKU", message="MNO: KAKU triggered")
// =========================
// Debug table (optional)
// =========================
var table t = table.new(position.top_right, 2, 14, border_width=1, border_color=color.new(color.white, 60))
fRow(_name, _cond, _r) =>
bg = _cond ? color.new(color.lime, 70) : color.new(color.red, 80)
tx = _cond ? "OK" : "NO"
table.cell(t, 0, _r, _name, text_color=color.white, bgcolor=color.new(color.black, 0))
table.cell(t, 1, _r, tx, text_color=color.white, bgcolor=bg)
if showDebugTbl and barstate.islast
table.cell(t, 0, 0, "MNO Debug", text_color=color.white, bgcolor=color.new(color.black, 0))
table.cell(t, 1, 0, "", text_color=color.white, bgcolor=color.new(color.black, 0))
fRow("BaseTrend", baseTrendOK, 1)
fRow("MOU Pullback", mou_pullback, 2)
fRow("MOU Breakout", mou_breakout, 3)
fRow("Break confirm", breakConfirm, 4)
fRow("Break big body", bigBodyOK, 5)
fRow("Break close high", closeNearHighOK, 6)
fRow("Break vol strong", volumeStrongOK, 7)
fRow("Break MACD", macdBreakOK, 8)
fRow("KAKU all8", all8_strict, 9)
fRow("KAKU final3", final3, 10)
fRow("MOU any", mou, 11)
fRow("KAKU", kaku, 12)

Daily Upper Wick 0.5 (Date Range)Appearance settings modified: Extend lines OFF, level color, Date Range filter, line thickness, Prices labeled and resized tiny, plot lines OFF.
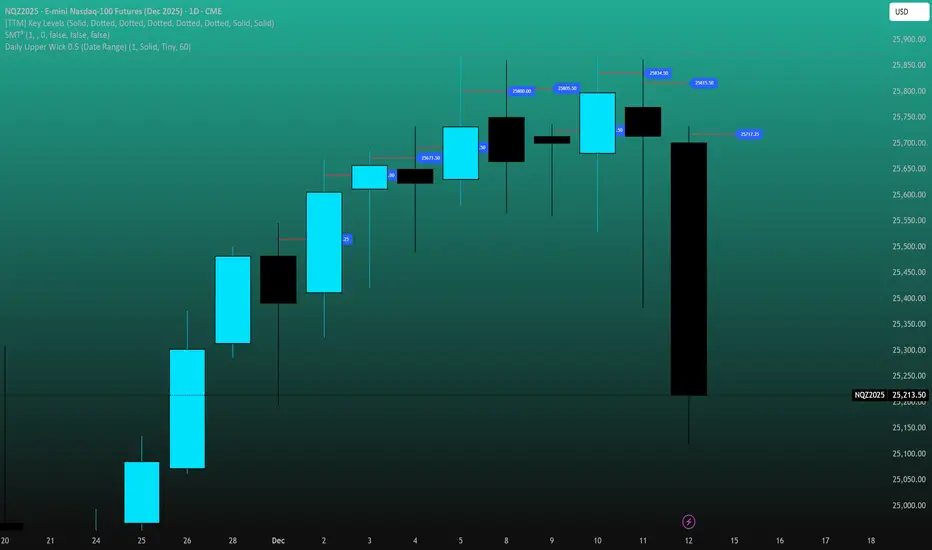
Daily Lower Wick 0.5 (Date Range)Appearance settings modified: Extend lines OFF, level color, Date Range filter, line thickness, Prices labeled and resized tiny, plot lines OFF.

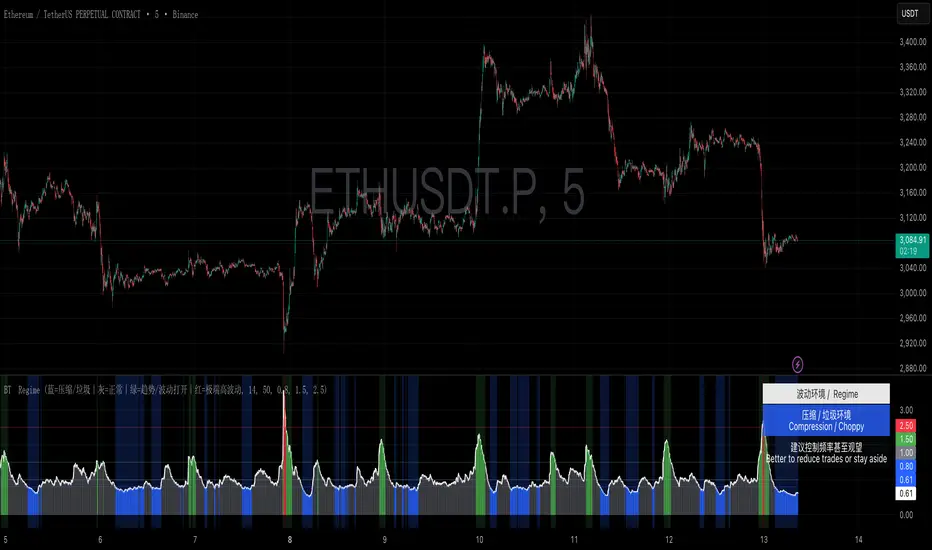
BullTrading Regime FilterBullTrading Regime Filter is an ATR-based volatility regime tool that turns market conditions into a simple color system: Compression/Choppy, Normal, Trend/Vol Open, and Extreme Volatility. It helps you trade when conditions are favorable and stay disciplined when they aren’t—trade less in compression, focus on trend setups, and reduce risk in extremes. Includes background coloring, a live regime label, and an on-chart legend—built for 3m/5m/15m intraday workflows.
BullTrading Regime Filter 是一款基于 ATR 波动比值的市场环境识别工具,用颜色一眼区分「压缩垃圾 / 正常 / 趋势打开 / 极端高波动」。它帮助你在该打的时候出手、在不该打的时候克制:压缩少做,趋势重点做,极端降杠杆控风险。支持背景着色、当前环境标签与固定颜色图例,适配 3m/5m/15m 日内节奏。
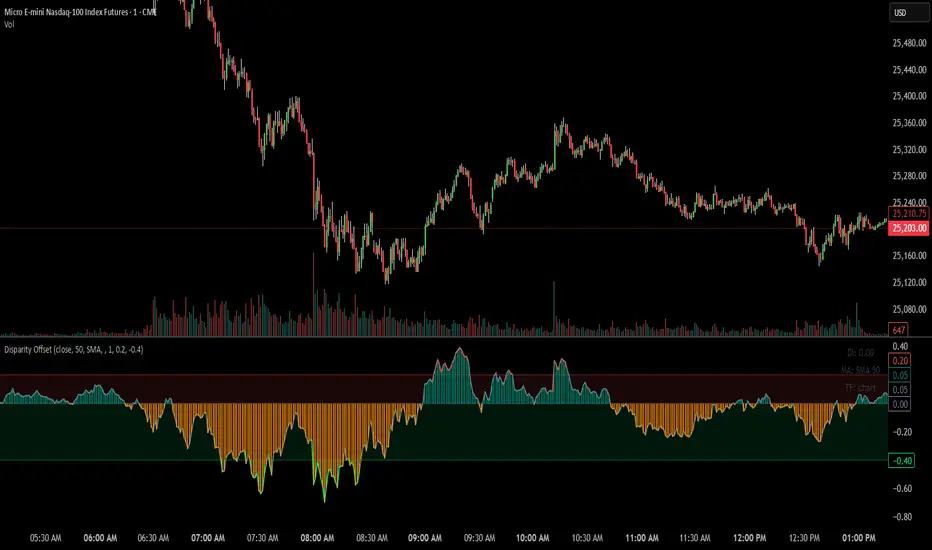
Disparity Offset [WizardTrendsInc]Disparity Offset
Description
Disparity Offset measures how far price is offset from a selected moving average, expressed as a percentage. It shows whether price is trading above or below its average and by how much, helping visualize price extension, balance, and deviation from the mean. The indicator oscillates around a zero line, where zero represents price being aligned with the moving average.
How to Use Disparity Offset
Zero Line (0%)
When the Disparity Offset is near zero, price is close to the moving average, suggesting equilibrium.
Positive Values
Values above zero indicate price is above the moving average. Larger positive readings show stronger upward offset from the average.
Negative Values
Values below zero indicate price is below the moving average. Larger negative readings show stronger downward offset
Upper & Lower Offset Zones
The configurable upper and lower percentage levels highlight when price is relatively far from the moving average. Movement back toward the zero line can be used to study mean-reversion behavior.
Visual Aids
Histogram bars show direction and intensity of the offset
Shaded zones emphasize overextended conditions
Optional markers display crossings of offset levels and the zero line for observation and learning
"Disclaimer: This indicator is intended for educational purposes only and does not constitute financial advice. Trading involves significant risk, and users should perform their own research and consult with a licensed financial advisor before making any trading decisions.