Delta Pressure SpectrumWhat this indicator is (brief)
Delta Pressure Spectrum (DPS-3) is a volume-pressure oscillator that estimates buy vs sell imbalance (a delta proxy), then normalizes it into a robust z-score so “significant” pressure means the same thing across different volatility regimes and market conditions. It visualizes that pressure as delta candles + a histogram, and only “lights up” with three breach tiers (plus an ultra-rare white core) when the move is statistically extreme for the current environment.
How to use it:
1) Read it like a pressure gauge, not an entry signal
-Histogram/candle height = intensity of net pressure (buy-dominant vs sell-dominant).
It’s best at telling you: “Is this move real pressure or just price wiggling?”
2) The 3 tiers tell you “how abnormal” the pressure is
-Tier-1 (weak breach): meaningful but common; “something’s happening.”
-Tier-2 (strong breach): rare enough to care; often aligns with real expansions / squeezes / liquidation events.
-Tier-3 (extreme breach): statistically extreme; often shows climactic behavior (either continuation impulse or blow-off/flush conditions).
-White core: only when Tier-3 overshoots hard—treat as “exceptional event.”
Key idea: tiers are adaptive. Tier-2 on BTC 1m and Tier-2 on ES 1h should both represent “strong for that regime.”
3) Best ways to trade with it (high-signal)
-Trend continuation confirmation: In an uptrend, repeated Tier-2/Tier-3 on the up side = real demand; avoid fading unless structure breaks.
-Exhaustion / climax watch: Tier-3 + white core after an extended run = “crowded pressure.” That can precede either: continuation (if structure holds), or reversal / mean reversion (if structure fails).
So you use it as a warning light, then let price structure confirm.
-Compression → expansion detection:
-Quiet baseline for a while, then sudden Tier-2/Tier-3 = expansion regime shift.
-Divergence (use carefully): Price makes new high, DPS-3 fails to reach prior tier intensity → weakening participation. This is most useful on HTFs or at major levels.
4) What the alerts should mean (how you set them)
-Tier-3 breach alerts: your “something serious just hit the tape” alert.
-Pressure flip alerts: best used as contextual reversal confirmation (it requires strong context in your logic).
-White core alert: extremely rare “event mode” notification—use sparingly.
5) One simple rule that keeps you out of trouble
-Don’t fade Tier-2/Tier-3 pressure just because it’s extreme. Fade only when price structure says the move failed (break of trend / reclaim failure / key level loss). DPS-3 tells you strength, structure tells you directional validity.
Indicatori e strategie

Volume + VWAP + Prior Session Levels DashboardVolume Spike + VWAP + Session Levels Dashboard
This indicator is a real-time market context dashboard designed to help traders quickly understand participation, value, and key reference levels without cluttering the chart with multiple indicators.
Instead of plotting lines or signals, the script summarizes critical intraday information into a compact on-chart table, allowing traders to make faster, more informed decisions based on how active the market is, where fair value is, and where important reference levels exist.
Core Concepts Used
This script is built on three widely used market principles:
Relative Volume Participation
Volume-Weighted Average Price (VWAP)
Prior Session Reference Levels
The indicator does not attempt to predict direction. Its purpose is to provide objective context that traders can combine with their own strategies.
How the Indicator Works
1. Volume Spike Analysis (Relative Volume)
Rather than showing raw volume, the script measures how unusual the current bar’s volume is compared to recent activity.
A moving average of volume is calculated using a user-defined lookback period.
Current volume is divided by this average to produce a volume multiple (for example, 2.0× normal volume).
This multiple is translated into a descriptive strength label, ranging from Below Threshold to Legendary.
This approach helps traders immediately recognize when participation is significantly above normal, which often coincides with institutional activity, breakouts, or important reactions near key levels.
2. Daily VWAP (Current and Prior Day)
VWAP (Volume-Weighted Average Price) represents the average price traded, weighted by volume, and is commonly used as a measure of fair value.
This script calculates VWAP internally by:
Accumulating price × volume throughout the day
Dividing by total volume
Automatically resetting at the start of each new trading day
The dashboard displays:
Current day VWAP – real-time session fair value
Prior day VWAP – an important reference from the previous session
Traders often use these levels to evaluate whether price is trading at a premium, discount, or near equilibrium.
3. Previous Day High and Low
The indicator also displays:
Previous day high
Previous day low
These levels frequently act as liquidity targets, support/resistance zones, or reaction points, especially during intraday trading sessions.
Dashboard Design
All information is presented in a two-column dashboard showing:
Metric name
Current value or status
The dashboard can be positioned in any corner of the chart and updates in real time, allowing traders to maintain awareness without constantly switching indicators or timeframes.
How to Use This Indicator
This script is best used as a decision-support tool, not a standalone trading system.
Typical uses include:
Identifying abnormally high volume near important price levels
Evaluating price position relative to VWAP
Monitoring reactions around prior day highs and lows
Staying oriented during fast market conditions without chart clutter
The indicator works on any timeframe and adapts automatically to the instrument’s trading session.
Customization Options
Users can:
Adjust the volume moving average length to define what “normal” volume means
Choose the price source used for VWAP calculation
Change the dashboard’s on-screen position
Summary
The Volume Spike + VWAP + Session Levels Dashboard provides a clear, objective snapshot of market conditions by combining participation, value, and reference levels into a single visual tool. It is designed to help traders answer a simple but critical question:
“Is the market doing something meaningful right now — and where?”
This indicator focuses on context, clarity, and usability for traders who want insight without unnecessary complexity.

S&D Trend Pullback StrategyThis is simple indicator for myself to alert me when in trend pullback and entry.
Use in M5 chart.
SL put 30-50pips
TP can set 30-90pips

CCI Standard DeviationCCI Standard Deviation – Asymmetric Volatility-Adjusted Trend Filter (CCI SD)
The Commodity Channel Index (CCI), created by Donald Lambert in 1980, measures how far the typical price deviates from its statistical average to identify cyclical momentum and trend strength.
The standard formula is:
CCI = (Typical Price − SMA(Typical Price, n)) / (0.015 × Mean Deviation)
where Typical Price = (High + Low + Close)/3.
CCI is unbounded and centered around zero: sustained readings above zero indicate bullish momentum, below zero bearish. Classic interpretations often use zero-line crosses or fixed levels (±100, ±200, ±250), but these can be unreliable when CCI volatility changes across market regimes.
This indicator was developed to create a more disciplined trend-following tool that aligns with my core risk principle: “always protect to the downside.”
Starting from the standard CCI zero-line concept for trend direction, I experimented with standard deviation bands to make the oscillator volatility-adjusted. I then applied deliberate asymmetry: requiring the lower 1σ envelope (CCI − stdev) to cross above a positive threshold for bullish confirmation (high-probability entry only in robust trends), while exiting immediately on any raw CCI weakness below a negative threshold (quick downside protection). User inputs for both thresholds were added to allow fine-tuning and adaptability across different assets and timeframes.
An optional DEMA-smoothed version of the lower envelope provides additional clarity when desired.
Extreme zones
raw CCI ±240 and lower envelope > 200 or < –200 - are highlighted with background shading to flag rare acceleration or capitulation phases.
How it works
Standard CCI calculated on typical price (default length 38).
Rolling standard deviation of the CCI itself (default length 13) measures the oscillator’s recent volatility.
Lower envelope = CCI − stdev (dn).
Optional DEMA smoothing (default length 12) can be toggled.
Trend logic:
Bullish regime only when lower envelope
→ Long Threshold (default +10)
→ statistical proof of strength
Bearish/neutral immediately when raw CCI
→ Short Threshold (default –25)
→ fast downside protection
Origin and development
The indicator emerged from wanting a cleaner, more reliable CCI for trend direction. After testing volatility-adjusted versions, the asymmetric design proved superior:
it enters only high-conviction uptrends and exits rapidly on weakness, significantly reducing whipsaws while preserving trend capture.
Parameters were optimized through extensive backtests on major assets (BTC, ETH, SOL and many more Cryptos; Magnificent 7 stocks, QQQ, SPX, gold).
The defaults were selected for the best average Sortino ratio and lowest maximum drawdown across this broad universe, ensuring robustness and avoiding single-asset overfitting.
How to use it
Green triangle below bar
→ lower envelope crosses above Long Threshold
→ high-conviction bullish trend confirmed
→ enter or add to longs
Magenta triangle above bar
→ CCI crosses below Short Threshold
→ exit longs or go cash/short
While lower envelope remains above Long Threshold
→ hold bullish positions
Extreme background shading (dn >200 or CCI ±240)
→ rare high-attention zones (potential acceleration or exhaustion)
Recommended defaults
CCI length: 38
SD length: 13
Long threshold: +10
Short threshold: –25
Optional MA length: 12 (DEMA of lower envelope)
All visual elements (bar coloring, signals, background, smoothed line) are toggleable for personal preference.
This indicator is designed as a trend-strength and risk-management filter and is not intended as a standalone trading system.
Disclaimer:
This is not financial advice. Backtests are based on past results and are not indicative of future performance.

Logarithimic Regression Fib Deviation BandsOverview
This indicator builds a logarithmic regression growth curve and wraps it in Fibonacci-scaled deviation bands to create a long-horizon valuation corridor. It is designed for assets where percentage moves matter more than absolute price moves (for example Bitcoin and other crypto assets), and it remains readable thanks to rainbow band colouring and right-offset labels .
What this indicator does
1) Fits a regression midline in log price space
The midline is a best-fit curve for the asset’s long-term trend
Because the regression is performed on log(price) , the trend behaves in percentage terms rather than linear price terms
This makes the curve suitable for multi-cycle and exponential-growth markets
2) Measures deviation around the midline
The indicator calculates the residual distance between price and the regression midline in log space
A single expanding deviation measure is derived from these residuals
Deviation can be calculated using either:
Expanding standard deviation (smoother, more robust)
Expanding maximum deviation (widest possible corridor)
3) Builds Fibonacci-scaled deviation bands
Upper and lower bands are placed at Fibonacci multiples of the deviation
Included levels:
0.236, 0.382, 0.500, 0.618, 0.786
1.000, 1.272, 1.618, 1.786, 2.000
Extended levels above 2.0: 2.272, 2.414, 2.500, 2.618, 2.720, 3.000
Bands are calculated in log space and then converted back to price space for plotting
4) Keeps the chart clean and readable
Upper bands have individual visibility toggles
Lower bands have:
A master enable / disable switch
Individual per-level toggles
Sensible defaults are used (only the most commonly relevant lower levels are enabled by default)
All labels are offset to the right so they do not overlap current price action
Why this indicator is useful
This tool is designed for context, structure, and regime awareness , not short-term entry signals.
Long-term valuation context
Helps visualise where price sits relative to a fitted growth curve
Cycle extremes
Upper Fibonacci deviation bands highlight historically stretched conditions and potential blow-off zones
Mean-reversion and discount zones
Lower bands highlight historically depressed conditions and deep drawdown regions
Consistency across time
Because the model operates in log space, all distances are interpreted as percentages, making behaviour comparable across multiple cycles
How it works (plain English)
Price is converted to log(price)
A regression is fitted to log(price) using an anchored time axis
Two time modes are available:
Days : log(price) vs linear time (exponential curve in price space)
Log(Days) : log(price) vs log(time), which often behaves like a power-law corridor over very long histories
Residuals (distance from the midline) are measured in log space
A deviation width is calculated from those residuals
Fibonacci ratios are applied to that deviation to create the band levels
Bands are converted back to normal price and plotted
Inputs guide
Model timeframe
Regression and deviation are calculated on a chosen timeframe (default Daily) and displayed on all chart timeframes
Time axis mode
Days = exponential-style trend
Log(Days) = power-law-style trend (often better for very long cycles)
Deviation model
Expanding StdDev = smoother, more statistically robust corridor
Expanding MaxAbs = widest possible corridor
Midline shift (%)
Shifts the entire corridor up or down by a constant percentage (useful for centring the model across different assets)
Lower band controls
Master toggle plus per-level toggles allow you to show only the lower levels that are relevant for the current regime
Label offset
Moves labels into the future by a fixed number of bars so they do not interfere with live price action
Typical usage ideas
Use Log(Days) + Expanding StdDev as a default for multi-cycle assets
Treat upper bands as risk or stretch zones , not automatic sell signals
Treat lower bands as discount or stress zones , not automatic buy signals
Enable deeper lower bands only when price action approaches those regions
Notes and limitations
This indicator is not a prediction tool
Bands evolve as more historical data becomes available
Results may vary depending on the amount and quality of historical data for a given symbol

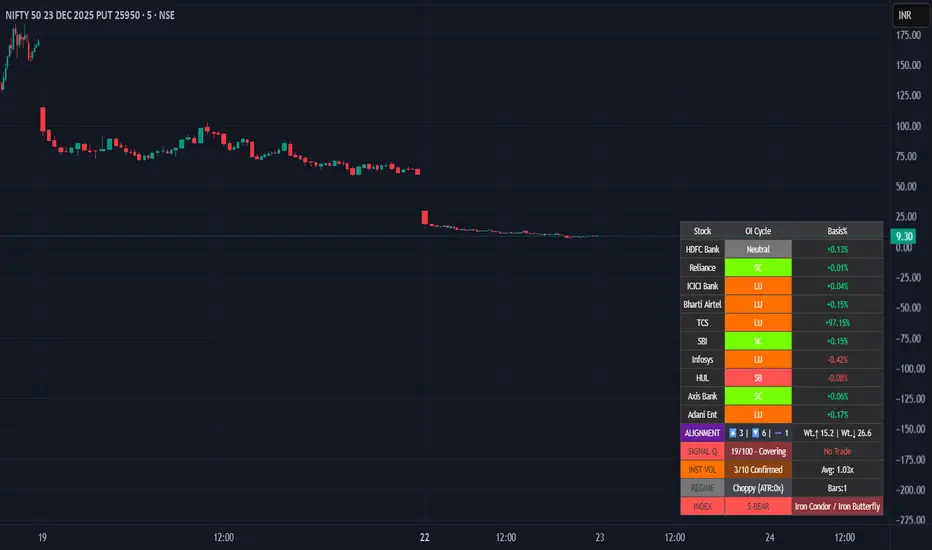
Smart Money Flow - Institutional OI & Volume Analyzer [Pro]# 🎯 Nifty Smart Money Flow - Institutional OI & Volume Analyzer
## What It Does
Professional-grade indicator that tracks **Open Interest (OI) cycles, volume footprints, and basis analysis** across Nifty 50's top 10 heavyweight stocks (representing ~54% of index weight). Identifies institutional accumulation/distribution using **4-quadrant OI analysis** combined with volume surge detection and ATR-based regime filtering.
## 🔥 Key Features
### Institutional-Grade Analytics
- **OI Cycle Detection**: Identifies Long Buildup (LB), Short Covering (SC), Short Buildup (SB), and Long Unwinding (LU) for top 10 Nifty constituents
- **Volume Validation Layer**: Detects institutional footprints via volume spikes >150-200% of 20-period MA
- **Cost of Carry Analysis**: Real-time basis tracking between spot and futures prices
- **Signal Quality Score (0-100)**: 4-component scoring system measuring alignment strength, weighted momentum, trend purity, and basis confirmation
### Advanced Regime Detection
- **Percent-Based ATR Filter**: Normalized volatility comparison prevents false signals across different price levels
- **Consecutive Bar Confirmation**: Requires 3+ bars of sustained signal before regime classification
- **Dynamic Strategy Recommendations**: Suggests optimal option structures (Call/Put Spreads, Iron Condor, Straddle) based on market regime
### Smart Money Divergence Alerts
- **Top Stock Divergence Detection**: Warns when heavyweight stocks (HDFC, Reliance, ICICI) contradict index signal
- **Pareto Principle Application**: Weights top 3 stocks (~30% index weight) for maximum predictive accuracy
## 📊 Visual Dashboard
Clean, dark-theme optimized table displaying:
- Individual stock OI cycles with color coding
- Basis/premium percentages for each heavyweight
- Alignment metrics (Bullish/Bearish/Neutral count)
- Quality score with position sizing guidance (Full Size/Spreads Only/No Trade)
- Institutional volume confirmation count
- Real-time regime status with ATR ratio
## 💡 How To Use
### For Intraday Traders (1m-15m)
1. Enable "Institutional Volume Filter" for noise reduction
2. Wait for Quality Score ≥60 for directional trades
3. Use regime-based structure recommendations (displayed in INDEX row)
### For Swing/Positional Traders (1H-Daily)
1. Focus on consecutive bar count ≥3 for trend confirmation
2. Check for divergence warnings before major positions
3. Use basis analysis to time entries (premium = bullish sentiment)
### For Options Traders
1. **Quality Score 60-100**: Full size directional (Buy Calls/Puts)
2. **Quality Score 30-60**: Spreads only (Call Spread/Put Spread)
3. **Quality Score 0-30**: Avoid directional; use Iron Condor in choppy regime
## ⚙️ Customization Options
- **10 Toggle Switches**: Show/hide individual stocks for cleaner dashboard
- **Volume Threshold**: Adjust institutional detection sensitivity (default 1.5x)
- **Regime ATR Length**: Fine-tune volatility measurement period (default 14)
- **Alignment Thresholds**: Set minimum bullish/bearish stock count for signals (default 5/10)
## 📈 Best For
- Nifty 50 Index traders (Futures & Options)
- Bank Nifty analysis (3 major banks included)
- Institutional flow tracking
- Multi-stock correlation analysis
- Regime-based strategy adaptation
## 🚨 Alerts Included
✅ Strong Bullish Signal (7+ stocks aligned + volume confirmation)
✅ Strong Bearish Signal (7+ stocks aligned + volume confirmation)
✅ Divergence Warning (Top stocks contradict index move)
✅ Institutional Volume Surge (7+ stocks with volume spikes)
## 📚 Technical Foundation
Based on institutional trading principles:
- **Order Flow Analysis**: Price + OI correlation for position identification
- **Smart Money Concepts**: Volume profile + basis analysis for institutional tracking
- **Regime Filtering**: Adaptive strategy selection based on volatility environment
- **Weighted Aggregation**: Pareto principle ensures top stocks drive signal quality
## 🔧 Version History
- v6.0: Initial release with 10-stock coverage
- Optimized request.security() calls: 30 total (3 per stock)
- Dynamic table rendering with barstate.islast efficiency
## 📌 Important Notes
- **Data Source**: NSE India (Spot + Futures + OI)
- **Update Frequency**: Real-time (dependent on chart timeframe)
- **Best Timeframes**: 5m, 15m, 1H, Daily
- **Avoid**: Pre-market hours (OI data may be stale)
---
**Category**: Volume / Order Flow
**Market**: NSE India - Nifty 50
**Timeframe**: Multi-timeframe (1m to Daily)
**Complexity**: Advanced (suitable for intermediate to professional traders)
## Tags (for SEO)
#nifty50 #orderflow #openinterest #institutional #smartmoney #volume #regime #niftyfutures #niftyoptions #oi #banknifty #heavyweights #basis #costofcarry #divergence #qualityscore #nseindia #optionstrading #algorithmic #quantitative
Volume Flow Bubbles [SunnyAlgo]# Volume Flow Bubbles
## What This Indicator Shows
This indicator visualizes **order flow** by displaying buy and sell volume as colored bubbles directly on your chart. It uses Lower Timeframe (LTF) data to show granular volume activity within each candle.
Perfect for **scalping** and **intraday trading** on any timeframe including Range bars.
---
## How to Read the Bubbles
### Colors
- **Green bubbles** = Buying pressure (bulls absorbing at lows)
- **Red bubbles** = Selling pressure (bears distributing at highs)
### Size
Bubble size reflects volume magnitude:
| Size | Volume Level |
|------|--------------|
| Huge | ≥70% of bar's max volume |
| Large | 40-70% |
| Normal | 20-40% |
| Small | 10-20% |
| Tiny | <10% |
### Position
- Buy bubbles appear **near the low** of each LTF candle (where buyers stepped in)
- Sell bubbles appear **near the high** (where sellers distributed)
---
## Entry Signals
### LONG Signal (▲)
Appears when ALL conditions align:
1. **Imbalance** - Price breaking out of consolidation
2. **Bullish trend** - EMA 9 > EMA 21
3. **Big buy print** - Large green bubble (volume > 3x average)
4. **CVD rising** - Cumulative Volume Delta confirms buying
### SHORT Signal (▼)
Appears when ALL conditions align:
1. **Imbalance** - Price breaking down
2. **Bearish trend** - EMA 9 < EMA 21
3. **Big sell print** - Large red bubble
4. **CVD falling** - Cumulative Volume Delta confirms selling
---
## Order Flow Patterns
| Pattern | What You See | Meaning |
|---------|-------------|---------|
| Absorption | Large green bubbles at lows, price holds | Buyers defending level - look for longs |
| Distribution | Large red bubbles at highs, price stalls | Sellers offloading - look for shorts |
| Breakout | Mostly green bubbles, increasing size | Strong buying momentum |
| Breakdown | Mostly red bubbles, increasing size | Strong selling momentum |
| Balance | Mixed small bubbles, no dominant color | Consolidation - wait for breakout |
---
## Settings Guide
### Lower Timeframe Settings
| Your Chart | Recommended LTF |
|------------|-----------------|
| 5 min | 1 min |
| 15 min | 1-3 min |
| 1 hour | 5-15 min |
| Range bars | 1 min |
### Key Parameters
- **Max Bubbles Per Bar** - Increase for more detail, decrease for cleaner charts
- **History Bars** - How many bars back to display bubbles
- **Big Print Threshold** - Sensitivity for detecting large volume (default 3x)
- **Balance Threshold** - ATR multiplier for detecting consolidation
- **Imbalance Multiplier** - ATR multiplier for detecting breakouts
---
## Alerts
6 built-in alerts available:
- Long Entry Signal
- Short Entry Signal
- Bullish Imbalance
- Bearish Imbalance
- Big Buy Print
- Big Sell Print
---
## Tips for Best Results
1. **Look for size clusters** - Multiple large bubbles at same price = institutional interest
2. **Watch color dominance** - More green = buyers winning, more red = sellers winning
3. **Combine with support/resistance** - Bubbles at key levels are more significant
4. **Use on liquid markets** - Works best on high-volume instruments
5. **Enable "Bring to Front"** - In TradingView visual settings for best bubble visibility
---
## How It Works
The indicator fetches lower timeframe candle data and splits each candle's volume into:
- **Buy Volume** = (Close - Low) / (High - Low) x Volume
- **Sell Volume** = (High - Close) / (High - Low) x Volume
This approximates order flow based on where price closed within the candle range.
---
*Created by SunnyAlgo*

Option ScalperUpdate: A good indicator must be able to detect what type of current market is: trending, range bound, or whipsawing. Based upon market type, signals should be either short living, long lasting or avoided at all. This is what this current updated version does best.

Gold ORB Strategy (3/5/15/30 Min)It's a multi-mode Opening Range Breakout system for Gold futures that automates the detection of the 7:20-7:23 AM CT opening range and provides clear visual signals for four different trading styles.
In Plain English:
"It draws a box around gold's first 3 minutes of trading, then alerts you when price breaks out with confirmation from volume, VWAP, and moving averages. It automatically calculates your entry, stop, and target prices based on your chosen strategy style."
What Makes It Unique:
4 Trading Personalities in One Tool:
Aggressive = "I want every breakout, I'll manage the fakeouts"
Confirmed = "Show me only moves that close beyond the range"
Retest = "I want the pullback entry for better R:R"
Fibonacci = "Let me buy the dip after the initial move"
Smart Confluence Filtering:
Doesn't just show every breakout
Checks if VWAP agrees (trend filter)
Verifies EMA alignment (momentum filter)
Flags volume spikes (conviction filter)
Complete Trade Management:
Automatically calculates stops (3 different methods)
Shows profit targets based on your R:R preference
Labels stick to price levels as you scroll
Visual dashboard shows all key info at a glance
What It's NOT:
Not a "buy here, sell there" robot - you still need to read the market
Not foolproof - no strategy works every day
Not optimized yet - you'll need to backtest and adjust settings for your style
The Real Value:
It takes a proven strategy from your research and makes it systematic and repeatable. Instead of manually drawing boxes and calculating stops every morning, it does the math and shows you exactly where the setup is.

MNQ Reversal Signals (HP/MP) + Traffic Light Regime FilterWhat we’re building
A 1-minute MNQ overlay indicator that does two things:
Generates trade signals (Long/Short) using a structured “reversal + confirmation” logic, plus optional filters.
Decides if we’re allowed to trade at all using a simple Traffic Light regime gate (GREEN / ORANGE / RED).
The goal is to only participate when conditions are favorable, avoid forcing trades, and keep decision-making consistent.
What we want to achieve
A rules-based system that:
Waits for high-quality setups (reversal-style signals, not random chop).
Uses a market regime filter to avoid trading during impulse / chaos.
Produces clear, repeatable entries: HP / MP Long or Short.
Enforces strict discipline: no “coerced” trades, no “I think it’ll work” entries.
Signal logic (V36-style structure)
1) Standard trend signal (EMA crossover)
Fast EMA (9) vs Slow EMA (21):
Long signal = fast crosses above slow
Short signal = fast crosses below slow
Optional RSI filter:
Longs require RSI above threshold
Shorts require RSI below threshold
2) Reversal signals (the ones we actually care about)
These are pattern + location + confirmation signals:
Mid-Probability (MP) Reversal
Long MP: deep pullback below slow EMA + hammer-type candle + EMAs bearish (fast < slow)
Short MP: deep extension above slow EMA + shooting-star-type candle + EMAs bullish (fast > slow)
High-Probability (HP) Reversal
HP is MP plus confirmation:
Long HP: after an MP long, the next 3 candles hold the low
Short HP: after an MP short, the next 3 candles hold the high
So HP = “reversal happened” + “market proved it didn’t immediately fail.”
Traffic Light gate (the trade permission system)
This block measures volatility regime + impulse behavior using:
ATR vs ATR baseline (volatility regime)
True Range vs TR baseline (impulse / expansion)
Count of recent TR expansion events over a rolling window (default 50 bars)
Colors mean:
GREEN (LFG): conditions stable enough to trade
ORANGE (OKISH): tradeable, but not perfect
RED (BAD): impulse / unstable → we do nothing
Our trading rule with the traffic light:
✅ We only take trades when Traffic Light is GREEN or ORANGE.
❌ We do not trade on RED.
❌ We don’t trade the “L” ever. (No “always-on”/baseline entries—only the defined MP/HP signals)
The execution rule-set (how we behave)
We do not chase.
We do not force entries (“coerced trades” are banned).
We wait for the system to print a valid setup:
MP Long / HP Long OR MP Short / HP Short
AND Traffic Light = GREEN or ORANGE
If it’s RED: no trade, even if a signal appears.
That’s it: signal + permission. No improvisation.
Educational Use Only — Not Financial Advice
This script/indicator is provided for educational and informational purposes only. It is not financial, investment, trading, tax, or legal advice, and nothing here should be interpreted as a recommendation to buy, sell, or hold any security, futures contract (including MNQ), options, crypto, or any other instrument.
Risk Warning: Trading involves substantial risk and you may lose some or all of your capital. Past performance is not indicative of future results. Any examples or “signals” are hypothetical and may not reflect real-world execution, slippage, commissions, liquidity, outages, or data-feed differences.
No Guarantees: This script may produce false, delayed, missing, or inaccurate signals due to market conditions, chart settings, timeframe differences, data quality, broker feeds, platform limitations, or coding constraints. It is provided “AS IS” without warranties of any kind.
Your Responsibility: You are solely responsible for all trading decisions, risk management, order placement, and compliance with applicable laws/rules.
Limitation of Liability: To the maximum extent permitted by law, the author/creator disclaims any liability for any losses or damages (including trading losses, lost profits, indirect or consequential damages) arising from the use of or reliance on this script.
By using this script, you acknowledge and accept this disclaimer.

Dip Hunter Pro [Sahebson]🎯 Overview
Dip Hunter Pro is an advanced multi-factor screening system designed to identify optimal "buy the dip" opportunities in any market. Instead of blindly buying every red candle, this indicator uses a sophisticated combination of market conditions to filter out noise and highlight only the highest-quality dip setups.
Whether you're a swing trader looking for entries or a long-term investor wanting to accumulate at better prices, Dip Hunter Pro helps you time your purchases with precision.
✨ Key Features
🔍 Multi-Factor Analysis
Unlike simple price-based indicators, Dip Hunter Pro analyzes 5 key market dimensions simultaneously:
Price Action - Identifies meaningful pullbacks from recent highs
Volume Confirmation - Ensures institutional participation
Volatility Spike - Detects capitulation and panic selling
Market Structure - Confirms bearish-to-bullish transition zones
Trend Context - Optional filter to buy dips in uptrends only
💪 Signal Strength Meter
Not all dips are created equal. The built-in strength scoring system (0-6) helps you prioritize:
STRONG (5-6): High conviction setups
MODERATE (3-4): Standard opportunities
WEAK (1-2): Lower probability setups
🌡️ Visual Heat Meter
Real-time visual feedback showing current market conditions at a glance. Quickly assess whether the market is approaching dip territory.
🤖 Bot-Ready Alerts
JSON-formatted webhooks for automated trading
Compatible with 3Commas, Cornix, Alertatron, and custom bots
Includes ticker, exchange, price, dip %, volume ratio, and signal strength
Human-readable + machine-parseable format
🎨 Fully Customizable
Adjustable sensitivity for all parameters
Optional trend filter for conservative entries
Customizable colors and display options
Entry line visualization
📈 How To Use
Reading Signals
Green Triangle (▲): Dip detected — potential buy opportunity
Check Strength: Higher score = higher conviction
Confirm Context: Use with your own analysis for best results
Recommended Workflow
1. Wait for signal (green triangle)
2. Check signal strength (aim for 4+)
3. Verify on higher timeframe
4. Set your stop loss below recent low
5. Scale in if signal strength is high
Best Practices
✅ Use on liquid assets (SPY, QQQ, BTC, major stocks)
✅ Higher timeframes (1H, 4H, Daily) = more reliable signals
✅ Combine with support/resistance levels
✅ Wait for candle close before acting
✅ Use proper position sizing
❌ Don't catch falling knives — let the signal confirm first
❌ Don't ignore the overall trend
🔔 Alert Setup
Available Alerts
Alert NameWhen It Triggers🎯 Dip Buy SignalAny valid dip signal💪 Strong Dip SignalOnly strength ≥5 signals⚡ Dip Alert (Compact)Minimal format for bots

Exhaustion Levels[Sahebson] v2.0🎯 Overview
Exhaustion Levels is a sophisticated price action indicator designed to identify market exhaustion points — moments when buying or selling pressure has potentially reached its limit and a reversal may be imminent.
Unlike traditional oscillators that lag behind price, this indicator analyzes real-time price dynamics to pinpoint high-probability reversal zones before they fully develop.
✨ Key Features
🔺 Exhaustion Detection
Bullish Exhaustion (Green Triangle): Identifies potential bottoming patterns where selling pressure appears exhausted
Bearish Exhaustion (Red Triangle): Detects potential topping patterns where buying pressure appears exhausted
📊 Dynamic Support & Resistance
Automatically plots key levels based on exhaustion points
Levels persist until new exhaustion events occur
Visual confirmation of significant price zones
🤖 Bot-Ready Alerts
JSON-formatted alerts for webhook integration
Compatible with 3Commas, Cornix, Alertatron, and custom bots
Includes ticker, exchange, price, and timestamp data
Human-readable + machine-parseable format
⚙️ Fully Customizable
Adjustable sensitivity parameters
Toggle exhaustion arrows on/off
Toggle support/resistance levels on/off
Customizable line thickness
📈 How To Use
Entry Signals
Buy Signal (🟢): When a green triangle appears below a candle, it suggests potential bullish exhaustion — consider long entries
Sell Signal (🔴): When a red triangle appears above a candle, it suggests potential bearish exhaustion — consider short entries or exits
Support & Resistance
Use the automatically generated levels as potential take-profit zones
Previous exhaustion levels often act as future support/resistance
Combine with your existing S/R analysis for confluence
Best Practices
✅ Use on higher timeframes (1H, 4H, Daily) for more reliable signals
✅ Combine with volume analysis for confirmation
✅ Wait for candle close before acting on signals
✅ Use proper risk management — no indicator is 100% accurate
✅ Backtest on your preferred assets before live trading
🎨 Visual Guide
ElementColorMeaning🔺 Green TriangleBelow candlePotential bullish reversal🔻 Red TriangleAbove candlePotential bearish reversal🟩 Green LineSupport levelPrevious bullish exhaustion zone🟥 Red LineResistance levelPrevious bearish exhaustion zone
⚙️ Settings Explained
SettingDefaultDescriptionShow Exhaustion Arrows✅ OnDisplay buy/sell trianglesShow Exhaustion Levels✅ OnDisplay S/R linesExhaustion Swing Length40Lookback period for analysisExhaustion Bar Count10Sensitivity thresholdLine Thickness2Width of S/R lines
Tip: Lower values = more signals (higher sensitivity), Higher values = fewer signals (higher quality)
📊 Recommended Assets
This indicator works on any liquid market:
✅ Stocks (SPY, QQQ, AAPL, TSLA)
✅ Crypto (BTC, ETH, SOL)
✅ Forex (EUR/USD, GBP/USD)
✅ Futures (ES, NQ, CL)
✅ Indices (US500, US100, US30)
⚠️ Disclaimer
This indicator is provided for educational and informational purposes only. It is not financial advice. Past performance does not guarantee future results. Always do your own research and use proper risk management. Trading involves substantial risk of loss.

Peace of Mind Trader: MA Trend SystemPeace of Mind Trader: MA Trend System
ระบบนี้ถูกออกแบบมาเพื่อให้การดูเทรนด์เป็นเรื่องง่ายและ "สบายใจ" ที่สุด (Peace of Mind) โดยลดความซับซ้อนของการตีเส้นกราฟ ช่วยให้คุณโฟกัสกับภาพใหญ่ของตลาดได้ทันที ด้วยหลักการ EMA Cross ที่เรียบง่ายแต่ทรงพลัง
ฟีเจอร์หลัก:
- Trend Ribbon (แถบสีบอกเทรนด์): แสดงพื้นที่ระบายสีระหว่างเส้น EMA สองเส้น เปลี่ยนสีเขียว/แดงตามแนวโน้ม ช่วยให้มองแวบเดียวก็รู้ว่าตลาดเป็นขาขึ้นหรือขาลง
- สัญญาณซื้อขายที่ชัดเจน:
ขึ้นป้าย "🟢 BULL" เมื่อเริ่มเข้าสู่เทรนด์ขาขึ้น
ขึ้นป้าย "🔴 BEAR" เมื่อเริ่มเข้าสู่เทรนด์ขาลง
- พิเศษ: มีฟังก์ชัน "Show Signal History" สามารถเลือกปิดประวัติเก่าๆ เพื่อให้โชว์แค่ "สัญญาณล่าสุด" เพียงอันเดียวได้ (ทำให้กราฟสะอาดตามาก)
- Dashboard สถานะ: ตารางสรุปมุมขวาล่าง (ปรับตำแหน่งได้) บอกสถานะปัจจุบันทันทีว่าควร Buy หรือ Sell
- เปลี่ยนสีแท่งเทียนอัตโนมัติ: ระบบจะย้อมสีแท่งเทียนให้เป็นสีเขียว/แดงตามเทรนด์ เพื่อลดความสับสนช่วงที่กราฟย่อตัว
วิธีใช้งาน:
🟢 โซนสีเขียว: โฟกัสหน้า Buy หรือถือรันเทรนด์ต่อไป
🔴 โซนสีแดง: โฟกัสหน้า Sell หรือถือเงินสดรอจังหวะ
การตั้งค่า: สามารถปรับค่า EMA และสีต่างๆ ได้ตามสไตล์การเทรดของคุณ
ขอให้มีความสุขกับการเทรดแบบ Peace of Mind ครับ
พีร์ Peace of Mind Trader
-------------
English Description
Peace of Mind Trader: MA Trend System
This indicator is designed to simplify your trading routine by visualizing the market trend clearly and effectively. Built on the classic logic of Moving Average crossovers (EMA), it helps you stay on the right side of the market without the noise.
Key Features:
Trend Ribbon: A visual fill between the Fast and Slow EMA that changes color based on the trend (Green for Bullish, Red for Bearish). This makes it easy to spot the strength and direction of the trend at a glance.
Clear Buy/Sell Signals:
Displays "🟢 BULL" labels when the Fast EMA crosses above the Slow EMA.
Displays "🔴 BEAR" labels when the Fast EMA crosses below the Slow EMA.
New Feature: You can toggle "Show Signal History". Uncheck this option to keep your chart clean by showing only the latest active signal.
Status Dashboard: A customizable panel on the chart (position adjustable) that tells you the current market status immediately (BULL or BEAR).
Trend-Colored Candles: Automatically colors the candlesticks to match the trend, helping you filter out noise during corrections.
How to Use:
Green Zone (Bullish): Look for buying opportunities or hold your position (Run Trend).
Red Zone (Bearish): Look for selling opportunities or stay in cash.
Settings: You can adjust the EMA lengths and all visual colors to fit your personal trading style.
Trade with Logic, Profit with Peace.

Price Range CHoCH Alert🎯 Smart Money Concept (SMC) indicator that monitors a specific price level and alerts only when price touches that level AND
subsequently creates a Change of Character (CHoCH).
Key Features:
• Set a custom price level to monitor
• Detects CHoCH/BOS based on pivot highs/lows
• Alerts ONLY when: Price touches level → CHoCH occurs
• Visual confirmation with level line and status table
• Configurable tolerance for precise level targeting
• Works for both bullish and bearish scenarios
Perfect for:
✓ Institutional level trading
✓ Key support/resistance breakouts
✓ Liquidity grab confirmations
✓ Structure break validation
Simply set your target price level and let the indicator watch for the perfect SMC setup!

ETF-Futures Opening Ratio (Table)This indicator calculates the opening price ratio between an ETF and its corresponding futures contract using the 9:30 AM New York (RTH) opening price.
The ratio is locked at the official market open and remains fixed throughout the session, providing a stable reference for:
Translating ETF price levels into futures equivalents
Comparing relative value and premium/discount behavior
Maintaining consistent cross-instrument analysis during the trading day
The output is displayed in a simple on-chart table for quick reference and minimal chart clutter.

Signals, Emas Bahena Indicator: Emas Bahena Signals
This indicator uses three Exponential Moving Averages (EMAs) to identify buy and sell entries based on crossovers and trend.
🔹 EMAs used
EMA 9 → fast (signals)
EMA 21 → intermediate (confirmation)
EMA 85 → slow (main trend)
🟢 BUY Signal
Generated when:
The EMA 9 crosses above the EMA 21
The EMA 9 is above the EMA 85 ➡️ Indicates the start of an uptrend
🔴 SELL Signal
Generated when:
The EMA 9 crosses below the EMA 21
The EMA 9 is below the EMA 85 ➡️ Indicates the start of a downtrend
📌 Visualization
EMAs drawn on the chart
BUY arrow below the price
SELL arrow above the price
Compatible with TradingView alerts
⚠️ Recommendation
Works best in trending markets and on medium and high timeframes (15m, 1H, 4H)

debugginmsLibrary: debugginms
A utility library for Pine Script focused on time formatting, candle logic, and liquidity analysis.
Time & Session
oneBar(): Returns bar duration in milliseconds.
TF(t, timeOnly): Formats timestamp t into a readable string.
inSession(range): Checks if the current bar is within a specific time session.
enforceTimeLimit(limits): Validates time against a newline-separated list of restricted times.
getDuration(s, e): Calculates the difference between two timestamps.
formatTimeframe(): Returns the current chart timeframe as a formatted string.
Candle & Price Logic
isUp(i) / isDown(i): Returns true if the candle at index i is bullish or bearish.
barClose(price, up, strict): Checks if a candle closed above/below a level (includes "strict" equality toggle).
avg(a, b): Returns the average of two float values.
Liquidity & Sweeps
processSweep(L, price, up, leftB): Counts liquidity sweeps within an array based on price and direction.
nearestSwing(startTime, bullish, max_tp, min_p): Locates the closest swing point within defined price bounds.
UDT liquidity: Custom type storing price, time, original price/time, and sweep counts.
Formatting & Conversions
S(val): Overloaded function to convert float, int, or bool to a string.
S2(val): Alternative string formatting for float data.
lineStyleTextToVal(val): Converts string input to Pine line.style constants.
devToArray / getDev: Utilities for handling and calculating deviation levels.

ITAS - Institutional Triggered Alpha SystemConcept & Originality: Standard breakout strategies often fail in the crypto market due to "fakeouts" driven by retail FOMO. ITAS (Institutional Triggered Alpha System) is a specialized quantitative system designed for SOL (Solana). Its core innovation is not the breakout itself, but the "Institutional Confirmation Layer." The script calculates the real-time arbitrage spread (Premium) between Coinbase (USD pair) and Binance (USDT pair). A trade is ONLY executed when this proprietary "Whale Monitor" confirms that US institutions are aggressively accumulating Bitcoin, which historically precedes an "Alpha Run" in high-beta assets like SOL.
Key Features & Logic:
Cross-Exchange Arbitrage Filter: The script runs a background algorithm that smooths the Coinbase-Binance price gap using a proprietary window.
Green Background: Indicates the "Institutional Bullish Zone" (Current Premium > Historical Baseline).
Logic: It filters out retail-driven pumps. We only trade when Smart Money is leading the charge.
Alpha Trigger (Volatility Breakout): Utilizes optimized Keltner Channels (tuned specifically for SOL's volatility profile) to time the entry. The system waits for a volatility expansion inside an Institutional Bullish Zone.
Dynamic Trailing Management: Features a hard-coded, ATR-based trailing stop mechanism designed to capture extended trends while protecting capital against sudden reversals.
Usage:
Target Asset: SOL/USDT (Parameters are strictly locked and optimized for Solana).
Visuals:
Green Background: Institutional Accumulation Zone (Safe to trade).
Blue/Gray Lines: Volatility Bands.
策略核心與原創性: 標準的突破策略常因散戶 FOMO 導致的假突破而虧損。ITAS (機構啟動 Alpha 系統) 是一套專為 SOL (Solana) 設計的量化交易系統。 本策略的核心創新不在於突破本身,而在於內建的**「機構確認層 (Institutional Confirmation Layer)」**。程式會即時計算 Coinbase (USD 交易對) 與 Binance (USDT 交易對) 之間的套利價差(溢價)。只有當獨家的「巨鯨監測算法」確認美國機構正在積極吸籌比特幣時,系統才會允許執行 SOL 的突破交易。
主要功能與邏輯:
跨交易所套利濾網: 程式在背景運作一套獨家演算法,對 Coinbase-Binance 的價差進行平滑處理。
綠色背景: 代表「機構看漲區域」(當前溢價 > 歷史基準線)。
邏輯: 過濾掉散戶推動的虛假拉升,我們只在聰明錢 (Smart Money) 領頭時進場。
Alpha 啟動 (波動率突破): 使用針對 SOL 波動特性優化過的肯特納通道 (Keltner Channels) 作為進場板機。系統僅在「機構看漲區域」內等待波動率爆發。
動態追蹤管理: 內建硬編碼的 ATR 動態追蹤止損機制,旨在抓取 SOL 的長波段趨勢,同時防止利潤回吐。
用法:
適用標的: SOL/USDT (參數已針對 Solana 進行嚴格鎖定與優化)。
視覺呈現:
綠色背景: 機構吸籌區 (適合交易)。
藍/灰線: 波動率通道。
Turtle Breakout Pro (Low DD Mode)Turtle Breakout Pro (Low DD Mode) is a trend-following breakout strategy built to participate only in higher-quality expansions while actively limiting exposure during unfavorable phases.
1. Core idea
This strategy focuses on capturing directional moves that begin with a clear price expansion beyond a recent range. It aims to trade only when the market shows both direction and commitment, avoiding entries that are likely to fade back into congestion.
2. Breakout validation
Signals are not triggered by a single touch or a marginal break. The strategy requires price to clear a breakout area with a safety margin and then demonstrate continued acceptance beyond that level. This confirmation behavior is designed to reduce false breakouts and late-session spikes that immediately retrace.
3. Market quality filters
Trades are allowed only when broader conditions support trend continuation. The strategy can enforce a directional bias filter, a trend-strength filter, a volatility suitability check, and an optional participation filter based on activity. The intent is to avoid breakouts that occur in weak, ill-conditioned environments where continuation is statistically less reliable.
4. Adaptive risk and sizing
Position size is dynamically adjusted so that risk remains proportional to current volatility. Instead of using fixed size, the strategy scales exposure based on how much the market can realistically move against the position in normal conditions. This is designed for multi-market use and for maintaining consistency across changing volatility regimes.
5. Exit framework
Exits are layered rather than single-purpose. The strategy uses a protective stop to define invalidation, can progressively protect profits as the trade moves in favor, and can optionally take profits at a logical expansion distance. In addition, a structure-based exit can close positions when the market violates a shorter-term boundary, aiming to avoid giving back too much during reversals.
6. Time and stagnation control
The strategy can enforce a maximum holding time to prevent capital being tied up in trades that stop progressing. If the market does not deliver continuation within a reasonable window, the position is closed to reduce opportunity cost and limit slow drawdown behavior.
7. Drawdown control behavior
A key feature is its defensive trading mode. After a loss, the strategy can temporarily reduce activity by waiting before taking new trades. It can also stop initiating new positions if overall drawdown exceeds a defined tolerance relative to the equity peak. The goal is to avoid “death by a thousand cuts” during noisy regimes.
8. Best conditions
It performs best when markets transition from consolidation into sustained trends, especially on liquid instruments where breakouts can carry through. It is typically more stable when volatility is present but not chaotic, and when trending conditions persist long enough for trailing protection to work.
9. When to avoid
Avoid using it in tight, mean-reverting ranges and during highly erratic whipsaw periods where breakouts frequently fail. In these phases, even well-filtered breakout systems can accumulate small losses and trigger defensive pauses.
10. What to expect
Expect fewer but higher-quality entries compared to basic breakout systems. Many trades will be small wins or small losses, with occasional larger winners when a strong trend develops. The strategy is designed to prioritize smoother equity behavior over maximum trade frequency.

UVOL Thrust TrackerUVOL Thrust Tracker identifies institutional breadth thrusts using NYSE up-volume as a percentage of total volume (USI:UVOL / USI:TVOL), plotted directly on price.
The indicator highlights:
TRUE 90% UVOL thrusts (rare, high-conviction breadth events)
Surrogate thrust clusters (multi-day 80–89% participation)
Cluster failures (momentum that fails to expand)
Structural thrust failures (2022-style false starts)
A regime filter based on the chart symbol’s moving averages separates bull vs bear environments, dynamically adjusting thresholds and failure logic.
This tool is designed for regime confirmation and risk management, not short-term entries. TRUE thrusts typically confirm trend continuation, while failures warn when breadth support breaks down.
Note: This indicator is intended for regime and risk assessment, not precise entries or exits.

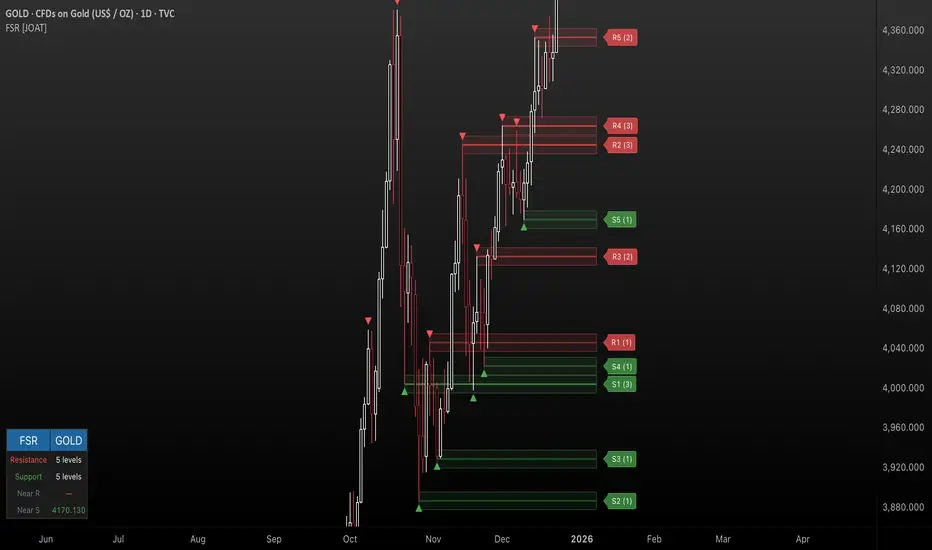
Fractal Support & Resistance [JOAT]
Fractal Support & Resistance — Automatic Level Detection with Volume Weighting
Fractal Support & Resistance automatically identifies key price levels using a proprietary combination of fractal detection, volume analysis, and dynamic touch counting. Levels are intelligently styled based on their strength and how many times they have been tested, giving you instant visual feedback on level importance.
Why This Script is Protected
This script is published as closed-source to protect the proprietary level management algorithm and the unique volume-weighted strength calculation methodology from unauthorized republishing. The specific implementation of touch detection, level merging logic, and dynamic opacity calculations represents original work that differentiates this from standard fractal indicators.
What Makes This Indicator Unique
Unlike basic fractal indicators that simply mark pivot points, this system:
Tracks how many times each level has been tested (touch counting)
Weights level importance by volume at the fractal point
Merges nearby fractals into single levels instead of cluttering the chart
Dynamically adjusts visual opacity based on level strength
Provides zone boxes around levels for realistic price reaction areas
What This Indicator Does
Detects fractal pivot highs and lows to establish support and resistance levels
Tracks how many times each level has been touched or tested
Weights level importance by volume at the fractal point
Draws extending lines and zone boxes for each level
Dynamically adjusts level opacity based on touch count for visual strength indication
Provides a dashboard with nearest levels and counts
Core Methodology
The indicator uses Williams Fractal concepts as a foundation but extends them with proprietary enhancements:
Fractal Detection — Identifies pivot highs and lows where price creates local extremes with confirmation bars on each side. A fractal high requires the highest point with lower highs on both sides; a fractal low requires the lowest point with higher lows on both sides.
Level Clustering — New fractals within a tolerance zone (based on Zone Padding %) update existing levels rather than creating duplicates. This keeps the chart clean and focuses on significant price areas.
Volume Integration — Volume at each fractal point is accumulated to weight level significance. Higher volume fractals are considered more important.
Touch Tracking — The system monitors when price approaches existing levels and increments touch counts. More touches indicate stronger, more significant levels.
Visual Strength System
Level appearance changes dynamically based on market interaction:
Newer or less-tested levels appear more transparent (up to 80% transparency)
Each additional touch reduces transparency by 15%
Heavily tested levels become more prominent and opaque (minimum 20% transparency)
Labels display level number and touch count (e.g., "R1 (3)" = Resistance 1 with 3 touches)
Zone boxes provide visual areas around each level
Color Scheme
Resistance Color — Default: #FF5252 (red) — Used for resistance levels and zones
Support Color — Default: #4CAF50 (green) — Used for support levels and zones
Zone Fill — 90% transparent version of level color
Zone Border — 70% transparent version of level color
Labels — 30% transparent background with white text
Dashboard Information
The on-chart table (bottom-left corner) displays:
Number of active resistance levels meeting minimum touch requirement
Number of active support levels meeting minimum touch requirement
Nearest resistance level above current price
Nearest support level below current price
Inputs Overview
Fractal Settings:
Fractal Period — Bars on each side for fractal confirmation (default: 2, range: 1-10)
Max Levels Per Side — Maximum resistance and support levels to track (default: 5, range: 1-20)
Zone Padding (%) — Level zone width as percentage of price (default: 0.2%, range: 0-2%)
Filtering:
Volume Weight Levels — Toggle volume-weighted level importance (default: on)
Min Touches to Show — Filter out levels with fewer touches (default: 1, range: 1-10)
Lookback Period — Historical bars to analyze for level detection (default: 200, range: 50-500)
Visual Settings:
Resistance/Support Colors — Customizable color scheme
Show Zone Boxes — Toggle filled zone areas around levels
Show Level Labels — Toggle level labels with touch counts
Show Fractal Markers — Toggle small triangles at fractal points
Show Dashboard — Toggle the information table
Line Width — Thickness of level lines (default: 2, range: 1-5)
How to Use It
For Support/Resistance Trading:
Use levels with higher touch counts as stronger support/resistance references
More opaque levels have been tested more times and are more significant
Watch for price reactions at zone boundaries, not just exact level prices
Combine with candlestick patterns at levels for entry signals
For Breakout Trading:
Watch for breakouts when price closes beyond a level
Levels with many touches that finally break often produce strong moves
Use the zone box—a close beyond the zone is more significant than just touching the level
Set alerts for resistance/support breaks
For Target Setting:
Use the nearest resistance as a profit target for long positions
Use the nearest support as a profit target for short positions
Dashboard shows these levels for quick reference
Alerts Available
FSR Resistance Break — Price closes above a resistance level
FSR Support Break — Price closes below a support level
FSR New Fractal High — Fresh fractal high detected
FSR New Fractal Low — Fresh fractal low detected
Best Practices
Increase Fractal Period for fewer but more significant levels
Use Min Touches filter to show only well-tested levels
Volume weighting helps identify institutionally significant levels
Combine with trend indicators—trade with the trend at levels
This indicator is provided for educational purposes. It does not constitute financial advice. Past performance does not guarantee future results. Always conduct your own analysis and use proper risk management before making trading decisions.
— Made with passion by officialjackofalltrades
SMA Crossover Strategy with Monte Carlo TunerCore logic
• Two signals:
• FAST SMA
• SLOW SMA
• Trade rule:
• FAST > SLOW → long
• FAST < SLOW → short
• Nothing else. No indicators stacked on top.
⸻
Two operating modes
1) Deterministic mode (baseline)
• MC = OFF
• You choose (fast, slow) explicitly (default 8/34)
• Behavior is stationary and repeatable
This is your control experiment.
⸻
2) Monte Carlo mode (adaptive discovery)
• MC = ON
• The script:
• Samples (fast, slow) pairs randomly from bounded integer ranges
• Simulates trades for each pair in parallel
• Tracks (gross profit, gross loss, trade count)
• Computes PF = GP / GL
• Promotes best-so-far online
Key point:
This is not grid search. It’s stochastic sampling with early stopping with time control (default 35 s)

Crypto Flow Index (CFI) - RS vs BTC/ETH ---
Crypto Flow Index, CFI
Crypto Flow Index, CFI, measures relative strength between an asset and Bitcoin or Ethereum.
You use CFI to judge whether capital favors your asset or the benchmark.
CFI does not give entry or exit signals.
You use CFI as a bias and context tool.
---
What CFI measures
Relative strength money flow on the BASE/BTC or BASE/ETH pair.
Volume weighted pressure, not price alone.
Momentum blended into flow to smooth rotations.
Optional USD trend filter using fast and slow EMAs.
---
How to read CFI
Above 50 means relative strength favors the asset.
Below 50 means relative strength favors BTC or ETH.
Rising CFI shows strengthening relative demand.
Falling CFI shows weakening relative demand.
---
Histogram
Green bars show positive relative flow.
Red bars show negative relative flow.
Larger bars signal stronger pressure.
---
Bias ribbon
Green ribbon shows bullish relative bias.
Red ribbon shows bearish relative bias.
Gray ribbon shows transition or balance.
---
How to use CFI
Favor long trades when CFI stays above 50.
Avoid longs when price rises but CFI falls.
Spot rotations before price reacts.
Combine with structure, entries, and risk rules.
---
Important limits
CFI compares assets only to BTC or ETH.
CFI does not represent the entire crypto market.
USD price and relative strength often diverge.
---
Core question CFI answers
Is your asset gaining or losing strength versus Bitcoin or Ethereum.
---
