LETHINH Pinbar📌 PinBar Minimal Detector — Description (English)
PinBar Minimal Detector is a clean and efficient tool designed to detect high-quality pin bars based purely on candle geometry.
This script focuses on the core characteristics of a true pin bar: a long rejection wick and a small candle body, without adding unnecessary complexity. It is ideal for traders who want fast, reliable signal detection without noise.
⸻
✨ Key Features
• Detects both bullish and bearish pin bars.
• Fully configurable wick/body ratio.
• Optional filter for maximum opposite wick size.
• Option to ignore candles with extremely small bodies.
• Clean chart display with simple labels (“PIN”).
• Includes alert conditions for automated notifications (webhook, popup, email, etc.).
• Lightweight and optimized for fast execution on any timeframe.
⸻
🔍 Detection Logic
A candle qualifies as a bullish pin bar when:
• The lower wick is at least X times larger than the body.
• The upper wick is relatively small (optional filter).
• The body is above the minimum body threshold.
A candle qualifies as a bearish pin bar when:
• The upper wick is at least X times larger than the body.
• The lower wick is relatively small.
• The body meets the minimum size requirement.
This ensures that only candles showing strong rejection are highlighted.
⸻
⚙️ Input Parameters
1. wick/body ratio
Defines how many times longer the main wick must be compared to the candle body.
For example:
• 3.0 → wick must be at least 3× the body
• 4.0–5.0 → only very strong pin bars
2. opposite wick max (factor)
The maximum allowed size of the wick on the opposite side, relative to the body.
Example:
• 0.5 → opposite wick ≤ 50% of body
• Lower values = stricter filtering
3. min body px
Filters out candles with bodies that are too small (low volatility candles).
4. show labels
Enable or disable the “PIN” labels on the chart.
⸻
🚨 Alerts
The script includes two built-in alert conditions:
• Bullish PinBar Detected
• Bearish PinBar Detected
These alerts can be paired with:
• TradingView notifications
• Webhooks (for bots / automation)
• Email or SMS alerts
⸻
🎯 Use Cases
• Identify high-probability reversal points
• Enhance price action strategies
• Combine with S/R zones, supply & demand, trendlines, or order blocks
• Filter entries on lower timeframes while following higher-timeframe trend bias
⸻
📘 Notes
This is a minimalistic version by design.
If you want a more advanced version (confirmation candle, volume filter, multi-timeframe filtering, trend direction filtering, etc.), this script can be expanded easily
Indicatori e strategie

Engulfing Failed Zone Detector by RWBTradeLabEngulfing Failed Zone Detector by RWBTradeLab
A clean, non-repainting tool that focuses on one thing only: showing where strong engulfing patterns failed and the market broke through their base.
What this indicator does
This script automatically scans for confirmed engulfing patterns (Regular & E-Regular) and then tracks where those structures are invalidated.
It highlights two types of failure zones:
1. Buy Engulfing Failed
* A bullish engulfing pattern forms (Regular or E-Regular).
* Later, a bearish candle closes below the base low of that engulfing.
* The zone from the base candle to the failure candle is marked as Buy EG Failed .
2. Sell Engulfing Failed
* A bearish engulfing pattern forms (Regular or E-Regular).
* Later, a bullish candle closes above the base high of that engulfing.
* The zone from the base candle to the failure candle is marked as Sell EG Failed .
Only the first clear failure after each engulfing is drawn, keeping the chart clean and readable.
Visuals on chart
1. A rectangle (box) is drawn from the engulfing base candle to the failure candle.
2. Labels are placed automatically:
* Buy EG Failed (below the zone)
* Sell EG Failed (above the zone)
3. Label distance from the zone is controlled by Text Offset from Box (%).
4. Separate color controls for:
* Buy Engulfing Failed Box Color
* Sell Engulfing Failed Box Color
The label style matches Engulfing Detector by RWBTradeLab for a consistent visual experience.
Alerts
Built-in alerts trigger only on confirmed bar close when a new failure completes:
* Buy EG Failed
* Sell EG Failed
Each alert message includes:
* Brand prefix: RWBTradeLab
* Price
* Time
* Ticker
Perfect for linking with bots, webhooks or alert-based trade management.
Key settings
Candle Length (closed candles)
* Defines how many recent confirmed candles are scanned (the live bar is excluded).
Display toggles
* Buy Engulfing Failed
* Sell Engulfing Failed
* Text
Turn each element ON/OFF to control how much information you want on the chart.
Text Offset from Box (%)
* Controls how far the label is placed from the failed zone, with a safe minimum to keep labels clear and readable.
Non-repainting confirmation
* All detection and alerts are based on closed candles only.
* No signals from the running candle, no repaint tricks.
* Once a failure zone appears, it stays fixed.
Best use
Failed engulfing zones can reveal:
* Broken demand/supply zones
* Liquidity grabs where “smart money” flushed traders out
* Strong momentum shifts after a failed reversal attempt
* Levels where continuation or clean retests often occur
Works on any symbol and timeframe. For best results, combine with:
* Higher timeframe structure
* Key support/resistance or supply/demand mapping
* Your own confirmation tools and risk management
Disclaimer
This indicator is a technical pattern-detection tool, not financial advice. Trading involves risk. Always confirm signals with your own analysis and use proper risk management.
Creator: RWBTradeLab
If this script adds value to your trading, please leave a ⭐ and share your feedback.

Prev Day ±1% BoundaryThis indicator plots dynamic intraday price bands based on the previous day’s close. It calculates a reference price using yesterday’s daily close and draws:
An upper boundary at +1% above the previous close
A lower boundary at –1% below the previous close
These levels are shown as horizontal lines across all intraday bars, with an optional shaded zone between them.
How to use:
Use the boundaries as intraday reference levels for potential support, resistance, or mean-reversion zones.
When price trades near the upper band, it may indicate short-term extension to the upside relative to the prior close.
When price trades near the lower band, it may indicate short-term extension to the downside.
The shaded region between the lines highlights a ±1% normal fluctuation zone around the previous day’s closing price.
This tool is especially useful for intraday traders on indices like SPX, providing quick visual context for how far price has moved relative to the prior session’s close.

LoD dist.%Lod dist.% is to calculate the percentage distance between the lows of day price and the current price in real-time.
In addition, I also use 20 day ADR%, and based on the comparison to 20 day ADR%, I create the three color of Lod dist.% (green, yellow, and red), tells if the Lod dist.% is <=1/2 ADR% or >1/2 but <=1 ADR% or >1 ADR%.
This help me understand if the buy at the tight risk (green), or is it a chase (red).

Po3 CandlesPo3 Candles is a clean visual tool that projects higher-timeframe candles (default: 4H) onto the right side of any chart, regardless of the chart’s current timeframe. This allows traders to see the structure of the higher timeframe ahead of price, without switching charts.
This is especially useful for:
ICT / SMC style traders
Traders who rely on HTF bias
Intraday traders who want to monitor HTF PO3 sequences
Futures, indices, crypto, and FX
What It Does
This indicator displays the last N higher-timeframe candles (1–4), drawn to the right side of your chart:
Always uses real HTF data, independent of the current chart timeframe
Candles appear oldest on the left → newest on the right
Can show only the current HTF candle or up to 4 candles total
Includes fully centered wicks for clean visual alignment
Candle body width + spacing are configurable
Candle colors can match your chart theme
The result is a floating, mini HTF “chart” that updates live as the current HTF candle forms.

BIG Fibo-X MTF✨ BIG Fibo-X MTF – Multi-Timeframe Fibo/EMA Cross System with RSI & Volume Confirmation
The BIG Fibo-X MTF indicator is a rule-based trend and momentum system that combines Fibo-EMA cross signals, RSI filtering, volume confirmation, multi-timeframe validation and ATR-based risk management. It generates precise long and short entries and automatically plots dynamic stop-loss and take-profit levels on the chart.
---
🔥 Key Features
• 📈 Fibo/EMA Cross Logic
Uses a dual EMA structure to detect trend shifts.
– Long signal: short EMA crosses above long EMA
– Short signal: short EMA crosses below long EMA
Reliable for identifying trend reversals and trend continuation phases.
• 📊 RSI Filtering (Current TF + Higher TF)
Signals must pass RSI conditions on both:
– the current timeframe
– a higher timeframe (MTF confirmation)
This ensures only high-probability momentum zones trigger an entry.
• 📉 Volume Confirmation
Signals require volume exceeding the moving average multiplied by your chosen factor.
This filters out low-activity market phases and increases signal accuracy.
• 📐 ATR-Based Stop-Loss & Take-Profit
The indicator automatically calculates:
– Entry level
– ATR-based dynamic stop-loss
– Take-profit using a customizable risk-reward ratio
Ideal for systematic and automated trading setups.
• ⏰ CEST Session Filter
Signals appear only within the defined trading session.
This is especially useful for DAX, Forex and Futures during European market hours.
• 🔔 Visuals & Alerts
The indicator provides:
– Long/Short labels
– Dynamic ATR SL/TP lines
– RSI with overbought/oversold levels
– Data-window signal output
– Alert conditions for long and short entries
Fully compatible with alert-based automation.
---
🎯 Ideal For
• Scalping
• Intraday trading
• Swing trading
• Breakout strategies
• Trend & momentum systems
• Systematic RR-based setups
---
⭐ Advantages
• Clear rule-based signals
• Multi-timeframe validation
• Volume-enhanced filtering
• Dynamic ATR risk management
• Clean visual structure
• Works for manual trading and automated alerts

ATR Trailing StopShows a trailing stop loss based on ATR (Average True Range).
The user can select ATR period and multiple, to adjust to the volatility of the current chart.
Only for long positions.

VCAI BOS-Zone PROVCAI BOS-Zone PRO is a structure-driven order-block mapper that tracks swing highs/lows, detects Break of Structure (BOS), and automatically draws clean bullish and bearish OB zones with midlines and directional flags.
It provides a clear, rules-based map of where structural shifts occurred and where price may react on future retests.
What it does:
Uses configurable swing pivots to define structure.
A bullish BOS is triggered when price closes above the last swing high;
a bearish BOS when price closes below the last swing low.
After each BOS, the script finds the last opposite candle (bearish before a bullish BOS, bullish before a bearish BOS) and builds an order-block zone from that candle’s high/low.
Each zone is projected a fixed number of bars into the future, keeping charts clean and preventing zones from extending into the price scale.
Only the latest N bullish and N bearish zones are kept, so the chart focuses on the most relevant active levels.
How to read it:
Yellow boxes + BULL flags = bullish demand zones.
Purple boxes + BEAR flags = bearish supply zones.
The edges of each zone act as potential support/resistance.
Reactions inside a yellow zone suggest buy-side interest;
rejection at a purple zone suggests sell-side pressure.
Optional midlines mark the 50% level of each zone, commonly used for refined entries, mitigations, and partial management.
How traders typically use it:
BOS-Zone PRO does not generate buy/sell alerts, but many traders use the zones as part of a broader decision process:
Bullish zones are often monitored for long setups when price returns and shows strength or continuation.
Bearish zones are often monitored for short setups when price retests and shows rejection or weakness.
Midlines provide refined entry levels with clearer invalidation points.
This tool is best used as structural context alongside your own entry model, risk settings, and trade management.
Notes & best practices:
BOS is directional, not predictive — treat zones as context, not guaranteed reversals.
Works on all symbols and timeframes.
Lower swing settings capture local structure; higher settings focus on major breaks and cleaner OB's.
Ideal as a structural map for discretionary traders or as a component inside automated systems.
Part of the VCAI toolset.
We develop a range of market-structure, volume, trend and liquidity tools designed to work together or stand alone.

Pardos Info DashboardThis indicator presents basic data in a concentrated form
Additions to the indicator are welcome by email to gshayp@gmail.com
Engulfing Overlap Zone Detector by RWBTradeLabEngulfing Overlap Zone Detector by RWBTradeLab
A focused, non-repainting tool that detects high-value “overlap zones” formed when one engulfing pattern fails and the opposite side immediately takes control.
What this indicator does
Instead of showing every engulfing pattern, this script filters out noise and highlights only Engulfing Overlap Zones:
1. It internally detects both:
* Regular Engulfing (R EG)
* E-Regular Engulfing (ER EG)
2. It then checks for engulfing failure:
* A Sell EG fails when a bullish candle closes above its base high.
* A Buy EG fails when a bearish candle closes below its base low.
3. After the failure, it looks for an opposite-side engulfing confirmation.
4. When the failed zone and the new opposite engulfing zone overlap, the script marks that region as a Buy EG Overlap or Sell EG Overlap zone.
Only these premium, overlap-based structures are shown on the chart.
Visuals on chart
1. Two stacked rectangles are drawn for each overlap setup:
* The failed engulfing zone
* The opposite confirming engulfing zone
2. Clean labels appear at the edge of the overlap:
* Buy EG Overlap (bullish zone)
* Sell EG Overlap (bearish zone)
3. Text distance from the zone is adjustable via Text Offset from Box (%).
4. Separate color controls for:
* Buy Engulfing Overlap Box
* Sell Engulfing Overlap Box
Alerts
Built-in alerts trigger only on confirmed bar close when a new overlap setup completes:
*Buy EG Overlap
*Sell EG Overlap
Each alert message includes price, time and ticker, prefixed with RWBTradeLab for easier filtering and automation.
Key settings
1. Candle Length (closed candles) – Defines how many recent confirmed candles are scanned (current bar is excluded).
2.Display toggles – Turn ON/OFF:
* Buy Engulfing Overlap
* Sell Engulfing Overlap
* Text labels
3. Text Offset from Box (%) – Controls how far the label is placed from the overlap zone, with a safe minimum to keep labels readable.
Non-repainting logic
* All calculations use closed candles only .
* No running-bar signals, no repaint tricks.
* The zones and alerts reflect stable, confirmed structures.
Best use
This indicator is designed to help you spot:
* Liquidity grabs and fake outs followed by real reversals
* Strong continuation zones after a failed attempt by the opposite side
* High-quality reaction areas for entries, pullbacks and retests
Works on any symbol or timeframe. For best results, combine with:
* Higher-timeframe market structure
* Key support/resistance or supply/demand zones
* Your own trade management and confirmation rules
Disclaimer
This script is a technical pattern-detection tool, not financial advice. Trading involves risk. Always use proper risk management and confirm signals with your own analysis.
Creator: RWBTradeLab
If this indicator helps your trading, please leave a ⭐ and share your feedback.

EMA 9/18/50 Crossover Alert By PRIGood for equity. When this crossover happen you may go long with sl keeping low of previous candle. Cautios in sideways market.

Nasdaq Pressure IndexNasdaq Pressure Index Indicator
The Nasdaq Pressure Index is a customizable technical indicator designed to measure market sentiment across multiple symbols by calculating a weighted average of their technical strength. The indicator outputs a normalized value between -100 and +100, making it easy to identify bullish or bearish pressure in your selected basket of stocks.
Description
This indicator calculates the relative strength of up to 10 user-defined symbols, typically tech stocks or other related instruments, and combines them into a single pressure index. The result provides insight into the overall market direction and strength.
Key Features
Multi-Symbol Analysis: Track up to 10 different symbols simultaneously
Flexible Weighting Methods:
Manual Market Caps: Define your own market cap weights
30-Day Volume: Weight by recent trading volume
Equal Weight: All symbols contribute equally
Customizable Parameters: Adjust EMA lengths and smoothing to suit your trading style
Visual Cues: Color-coded output and background highlighting for extreme values
Debug Information: Option to display detailed calculations
How It Works
The indicator:
Calculates the strength of each symbol based on:
Price relative to VWAP (50% weight)
Price relative to Fast EMA (30% weight)
Price relative to Slow EMA (20% weight)
Normalizes these values using ATR to account for volatility
Applies your chosen weighting method
Combines the weighted values into a single index
Normalizes the result to a -100 to +100 scale using a hyperbolic tangent function
Applies final smoothing
How To Use It
Setup:
Enter your symbols as a comma-separated list (default includes major tech stocks)
Choose your preferred weighting method
If using manual weights, enter market caps in billions (comma-separated)
Adjust EMA lengths if needed (defaults: Fast EMA = 9, Slow EMA = 21)
Interpretation:
Positive Values (0 to +100): Bullish pressure - the higher the number, the stronger the bullish sentiment
Negative Values (0 to -100): Bearish pressure - the lower the number, the stronger the bearish sentiment
Extreme Zones: Values above +50 or below -50 indicate potentially overbought or oversold conditions
Color Changes: Green for positive (darker when increasing), Red for negative (darker when decreasing)
This is primarily a confluence indicator:
Consider taking long positions only on positive values of the indicator
Consider taking short positions only on negative values of the indicator
Look for divergence between the index and price for potential reversals
Extreme readings (+/-50) can signal potential market exhaustion
Optimization:
Try different symbol combinations to create sector-specific indicators
Experiment with different weighting methods to find what works best for your trading style
Adjust the EMA lengths to make the indicator more or less sensitive to price changes
The indicator works on any timeframe but is particularly useful on daily and weekly charts for capturing broader market movements.

2 Dip/Tepe + Destek/Direnç + Tek Sinyal Stratejisi⭐ A Brief Summary of What the Strategy Does
🎯 1) Market analysis is being released (bottom-top analysis)
It automatically finds pivot bottoms and pivot tops on the strategic chart. Then:
If the bottoms are rising (HL – High Low): the trend is upward
If the tops are falling (LH – Lower High): the trend is downward
it interprets this.
🎯 2) Support and resistance lines are formed
Last pivot top = resistance line
Last pivot bottom = support line
These lines are automatically drawn on the chart.
🎯 3) Breakout is expected according to the trend structure
For LONG:
The last two bottoms will be rising bottoms
The price will rise above the last resistance line
This gives a single LONG signal.
For SHORT:
The last two peaks will be falling peaks
The price will fall below the support line
This gives a single SHORT signal.

Fractal Fade Pro IndicatorA revolutionary contrarian trading indicator that applies chaos theory, fractal mathematics, and market entropy to generate high-probability reverse signals. This indicator fades traditional technical signals, providing BUY signals when conventional indicators say SELL, and SELL signals when they say BUY.
Full Description:
Most traders follow the herd. QFCI does the opposite. It identifies when conventional technical analysis is about to fail by detecting mathematical patterns of exhaustion in market structure.
How It Works (Technical Overview):
The indicator combines three sophisticated mathematical approaches:
Fractal Dimension Analysis: Measures the "roughness" of price movements using fractal mathematics
Market Entropy Calculation: Quantifies the randomness and disorder in price returns using information theory
Phase Space Reconstruction: Analyzes price evolution in multi-dimensional state space from chaos theory
Signal Generation Process:
Step 1: Market Regime Detection
Chaotic Regime: High fractal complexity + rising entropy (avoid trading)
Trending Regime: Low fractal complexity + high phase space distance (fade breakouts)
Mean-Reverting Regime: Very low fractal complexity (fade extremes)
Step 2: Reverse Signal Logic
When traditional indicators would give:
BUY signal (breakout, oversold bounce, volatility spike) → QFCI shows SELL
SELL signal (breakdown, overbought rejection, volatility crash) → QFCI shows BUY
Step 3: Smart Signal Filtering
No consecutive same-direction signals
Adjustable minimum bars between signals
Multiple confirmation layers required
Unique Features:
1. Mathematical Innovation:
Original fractal dimension algorithm (not standard indicators)
Market entropy calculation from information theory
Phase space reconstruction from chaos theory
Multi-regime adaptive logic
2. Trading Psychology Advantage:
Contrarian by design - profits from market overreactions
Fades retail trader mistakes - enters when others are exiting
Reduces overtrading - strict signal frequency controls
3. Clean Visual Interface:
Only BUY/SELL labels - no chart clutter
Clear directional arrows - immediate signal recognition
Built-in alerts - never miss a trade
Recommended Settings:
Default (Balanced Approach):
Fractal Depth: 20
Entropy Period: 200
Min Bars Between Signals: 100
Aggressive Trading:
Fractal Depth: 10-15
Entropy Period: 100-150
Min Bars Between Signals: 50-75
Conservative Trading:
Fractal Depth: 30-40
Entropy Period: 300-400
Min Bars Between Signals: 150-200
Optimal Timeframes:
Primary: Daily, Weekly (best performance)
Secondary: 4-Hour, 12-Hour
Can work on: 1-Hour (with adjusted parameters)
How to Use:
For Beginners:
Apply indicator to chart
Use default settings
Wait for BUY/SELL labels
Enter on next candle open
Use 2:1 risk/reward ratio
Always use stop losses
For Advanced Traders:
Adjust parameters for your trading style
Combine with support/resistance levels
Use volume confirmation
Scale in/out of positions
Track performance by regime
Risk Management Guidelines:
Position Sizing:
Conservative: 1-2% risk per trade
Moderate: 2-3% risk per trade
Aggressive: 3-5% risk per trade (not recommended)
Stop Loss Placement:
BUY signals: Below recent swing low or -2x ATR
SELL signals: Above recent swing high or +2x ATR
Take Profit Targets:
Primary: 2x risk (minimum)
Secondary: Previous support/resistance
Tertiary: Trailing stops after 1.5x risk
IMPORTANT RISK DISCLOSURE
This indicator is for educational and informational purposes only. It is not financial advice. Past performance does not guarantee future results. Trading involves substantial risk of loss and is not suitable for every investor. The risk of loss in trading can be substantial. You should therefore carefully consider whether such trading is suitable for you in light of your financial condition.

智能趋势-多周期动态信号 Smart Trend Oscillator MTF V1🚀 智能趋势-多周期动态信号 Smart Trend Oscillator MTF V1
—— 让交易像红绿灯一样简单直观 | Making Trading as Simple as Traffic Lights
告别复杂的参数设置,把市场噪音变成明确的信号。 Say goodbye to complex parameters. Turn market noise into clear signals.
🌟 它是做什么的? / What Does It Do?
“智能趋势管家” 就像您的私人交易副驾驶。它内置了一套先进的智能平滑算法,能够自动过滤掉市场中那些骗人的假动作,只把最核心的**“市场真实韵律”通过一条平滑的波浪线展示给您。它不只是一根线,它是一套会思考的系统**。
"Smart Trend Oscillator " is like your personal trading co-pilot. It features a built-in advanced smoothing algorithm that automatically filters out deceptive market "fake-outs," revealing the "true rhythm" of the market through a single, smooth wave. It’s not just a line; it’s a thinking system.
🔥 核心功能 / Core Features
1. 🌊 智能波浪引擎 / Smart Wave Engine
不要被K线的上蹿下跳迷惑。我们的引擎能识别市场内部的真实能量。 Don't be confused by erratic candlesticks. Our engine identifies the true internal energy of the market.
过滤噪音 (Filter Noise):自动忽略短暂的随机波动。
捕捉趋势 (Capture Trends):波浪上升代表买方主导,波浪下降代表卖方主导。
2. 🛡️ 自适应波动通道 / Adaptive Channels
市场有时候像乌龟(波动小),有时候像兔子(波动大)。指标拥有一个“弹性通道”,它会根据市场活跃度自动变宽或变窄,精准判断价格是否“过热”或“超卖”。 The market moves between low and high volatility. The indicator features an "elastic channel" that automatically widens or narrows, accurately judging if the price is "Overheated" or "Oversold."
3. 🌍 全局监控面板 / Global Dashboard
右上角的面板是您的战况指挥室。一眼看懂 6 个不同时间维度的状态。全绿代表多周期共振向上,全红代表多周期共振向下。 The panel in the top-right corner is your Command Center. Understand the status of 6 different time dimensions at a glance. All Green means upward resonance; All Red means downward resonance.
⚙️ 极致的个性化定制 / Ultimate Customization
v16 版本为您提供了前所未有的控制权,让指标完全适应您的交易风格。 Version 16 gives you unprecedented control to tailor the indicator to your trading style.
🕒 1. 时间周期,由你定义 (Customizable Timeframes)
不再局限于系统默认设置。您可以在设置面板中自由输入 6 个您最关心的周期(例如:5分钟、1小时、甚至 3天)。
短线手:设置为 1分/3分/5分/15分...
波段手:设置为 1小时/4小时/日线/周线...
Benefit: You can freely input the 6 timeframes that matter most to you in the settings panel, whether you are a scalper or a swing trader.
🎯 2. 灵敏度调节 (Adjustable Sensitivity)
想要更多交易机会?还是想要更稳健的信号?
高灵敏度:调高 Zone Sensitivity,捕捉每一次微小的回调(适合激进风格)。
低灵敏度:调低数值,过滤掉小波动,只抓大趋势(适合稳健风格)。
Benefit: Dial up the sensitivity to catch every minor pullback (Aggressive), or dial it down to filter noise and catch only big trends (Conservative).
📊 3. 两种平滑模式 (SMA vs. VWMA)
您可以选择通道的计算核心:
Standard (SMA):经典模式,适合大多数市场。
Volume Weighted (VWMA):成交量加权模式。在加密货币或股票市场,它能帮您过滤掉“无量空涨”或“无量空跌”的假信号。
Benefit: Choose Standard (SMA) for general markets, or Volume Weighted (VWMA) to filter out fake moves on low volume (great for Crypto/Stocks).
🚦 信号含义 / Signals Guide
我们把复杂的逻辑浓缩成了最简单的视觉标签: We have condensed complex logic into the simplest visual labels:
🟢 绿色 BUY 标签:市场“便宜”且能量向上。 (Market is "Cheap" & Energy is Up.)
🔴 红色 SELL 标签:市场“过热”且能量向下。 (Market is "Overheated" & Energy is Down.)
🔵 蓝色 HOLD 标签:趋势延续中,建议持仓。 (Trend is continuing, suggest holding position.)
📥 快速上手 / Quick Start
加载指标 (Load):添加到您的图表。
设置周期 (Set Timeframes):在输入选项里填入您习惯查看的 6 个时间周期。
选择模式 (Choose Mode):如果是成交量重要的资产,建议开启 VWMA 模式。
等信号 (Wait):等待带方框的 BUY 或 SELL 标签出现。
把复杂留给算法,把简单留给您。 Leave the complexity to the algorithms, and keep the simplicity for yourself.

Thursday highlight//@version=5
indicator("Thursday highlight", overlay=true)
bgcolor(dayofweek==dayofweek.thursday ? color.new(color.blue,90):na)


Gold Rush Strategy - JsonSimple Conversion and Base line crossover strategy with Broker Commission added & JSON Alerts..
Works good in Gold with 2 ATR 1H TF.. Back test it..

PopGun Detector – Trigger + 5. CandleSimple module for the popguns.
It detects PGs, marks them (trigger points), and shows the 5th candle.
This way, you don’t have to search for a long time in the chart – you can easily go through the different timeframes and specifically look for the popguns.

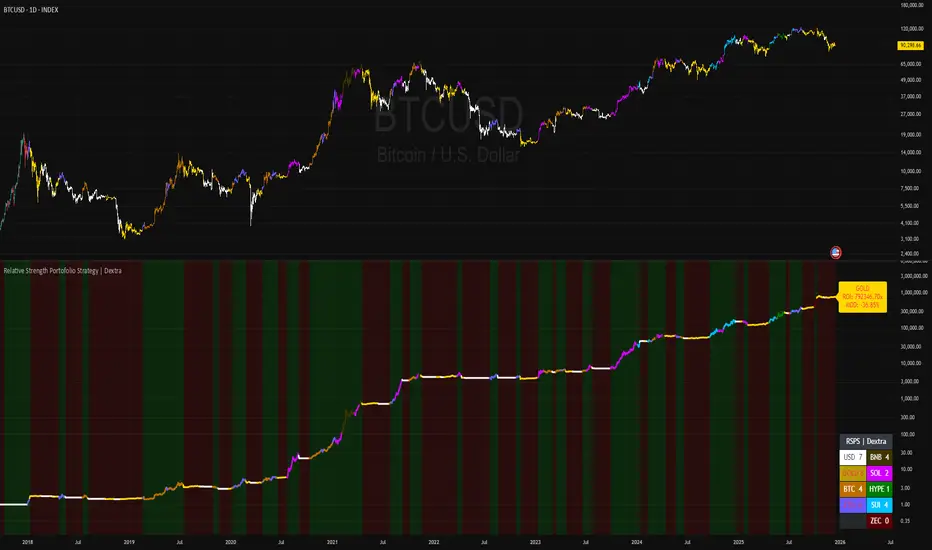
Relative Strength Portofolio Strategy (RSPS) | DextraRelative Strength Portofolio Strategy (RSPS) | Dextra
Conceptual Foundation and Strategy Innovation
RSPS is a multi-asset rotation strategy that combines pairwise relative strength analysis across major cryptocurrencies with a robust market regime filter, along with an automatic safe-haven switch to Gold or USD (cash) during weakening market conditions. The strategy is designed to dynamically allocate capital to the cryptocurrency exhibiting the strongest relative dominance during bull phases, while significantly reducing exposure when overall crypto momentum fades—aiming to capture upside from the leading sector while limiting large drawdowns.
The core approach relies on a custom momentum indicator optimized for each asset pair, incorporating hysteresis to maintain signal stability and prevent excessive rotation (whipsaw). This creates a responsive rotation system that adapts to shifts in sector strength within the crypto market, focusing on capitalizing on the strongest prevailing momentum.
Market Regime Detection
Overall market regime is determined by a custom momentum indicator applied to the CRYPTO INDEX.
Gold strength is evaluated separately via a similar indicator on the Gold asset, serving as the trigger for safe-haven allocation during bearish conditions.
Pairwise Relative Strength Analysis
Relative strength is measured through pairwise comparisons between assets using custom indicator with period and threshold parameters tailored specifically to each pair—reflecting the unique volatility and historical behavior of each relationship.
Scoring System
Each asset receives a score (0–5) based on how many other assets it “outperforms” in the pairwise comparisons.
The highest score identifies the current relative leader.
During bull markets: allocation focuses on the top-scoring cryptocurrency.
During bear markets: the system switches to GOLD (if showing strength) or USD (cash) as a defensive position.
Allocation Guidance
The script defaults to suggesting 100% allocation to the selected asset to maximize exposure to the strongest momentum. However, traders can adjust exposure percentages based on personal risk tolerance—for example, allocating 70–90% to the dominant asset and keeping the remainder in USD or stablecoins to reduce portfolio volatility.
Equity Curve & Risk Metrics
Equity curve is calculated in real-time starting from a user-defined date.
Maximum Drawdown (MDD) is tracked and displayed as the primary risk metric.
Visualization and Dashboard Features
Equity Curve: Thick line plot with dynamic coloring based on the currently active asset.
Bar and Background Coloring: Transparent green during bull regime, red during bear.
Table in the bottom-right corner: Displays real-time scores for all assets (including USD and GOLD when relevant), with asset-specific background colors and highlighting for high scores.
Information Label: Shows the current active position, total ROI (as a multiplier), and MDD (%).
Assets Covered
Major cryptocurrencies: BTC, ETH, SOL, SUI, BNB, HYPE
Safe-haven assets: GOLD, USD (cash)
It performs best on the daily (1D) timeframe, where noise is reduced and signal reliability is higher.
Summary
RSPS | Dextra provides a fully automated asset rotation framework based on pairwise relative strength with pair-specific parameters, combined with clear market regime detection and risk-off mechanics. With its comprehensive visual dashboard (score table, colored equity curve, and real-time performance metrics), the script serves as a powerful decision-support tool for navigating crypto market dynamics—capturing upside from leading sectors while protecting capital during downturns.
Quad Moving Average (SMA)+ Crossing + Volume Peak1.) Quad Optional SMA
2.) Indicate the crossing point
3.) Volume Peak Bar

Trinity ATR Real Move DetectorTrinity ATR Real Move Detector
This ATR Energy Table indicator is one of the simplest yet most powerful filters you can have on a chart when trading short-dated or 0DTE options or swing trades on any timeframe from 1-minute up to 4-hour. Its entire job is to answer the single most important question in intraday and swing trading: “Does the underlying actually have enough short-term explosive energy right now to make a directional position worth the theta and the spread, or is this just pretty candles that will die in ten minutes?”
Most losing 0DTE and short-dated option trades happen because people buy or sell direction on a “nice-looking” breakout or pullback while the underlying is actually in low-energy grind mode. The premium decays faster than the move develops, and you lose even when you’re “right” on direction. This little table stops that from ever happening again.
Here’s what it does in plain English:
Every bar it measures two things:
- The current ATR on whatever timeframe you are using (1 min, 3 min, 5 min, 10 min, etc.). This tells you how big the average true range of the last 14 bars has been — in other words, how violently the stock or index is actually moving right now.
- The daily ATR (14-period on the daily chart). This is your benchmark for “normal” daily movement over the last two–three weeks.
It then multiplies the daily ATR by a small number (the multiplier you set) and compares the two. If the short-term ATR is bigger than that percentage of the daily ATR, the table turns bright green and says “ENOUGH ENERGY”. If not, it stays red and says “NOT ENOUGH”.
Why this works so well:
- Real explosive moves that carry for 0DTE and 1–3 DTE options almost always show a short-term ATR spike well above the recent daily average. Quiet grind moves never do.
- The comparison is completely adaptive — on a high-vol day the threshold automatically rises, on a low-vol day it automatically drops. You never have to guess if “2 points on SPY is big today”.
- It removes emotion completely. You simply wait for green before you even think about clicking buy or sell on an option.
Key settings and what to do with them:
- Energy Multiplier — this is the only number you ever touch. It is expressed as a decimal (0.15 = 15 % of the daily ATR). Lower = more signals, higher = stricter and higher win rate. The tooltip gives you the exact sweet-spot numbers for every popular timeframe (0.09 for 1-minute scalping, 0.13 for 3-minute, 0.14–0.16 for 5-minute, 0.15–0.19 for 10-minute, etc.). Just pick your timeframe once and type the number — done forever.
- ATR Length — leave it at 14. That’s the standard and works perfectly.
- Table Position — move the table to wherever you want on the chart (top-right, bottom-right, bottom-left, top-left).
- Table Size — make the text Tiny, Small, Normal or Large depending on how much screen space you have.
How this helps you make money and stop losing it:
- On most days you will see red 80–90 % of the time — that’s good! It is forcing you to sit on your hands instead of overtrading low-energy chop that eats premium.
- When it finally flips green you know institutions are actually pushing size right now — follow-through probability jumps from ~40 % to 65–75 % depending on the stock and timeframe.
- You stop buying calls on every green candle and puts on every red candle. You only strike when the market is genuinely “awake”.
- Over a week you take dramatically fewer trades, but your win rate and average winner size go way up — which is exactly how consistent intraday option profits are made.
In short, this tiny table is the closest thing to an “edge on/off switch” that exists for short-dated options. Red = preserve capital and go do something else. Green = pull the trigger with confidence. Use it religiously and you’ll immediately feel the difference in your P&L.

Punji's Dynamic Monthly EMA/SMA 5,9,21,50Punji's Dynamic Monthly EMA/SMA 5,9,21,50
Overview:
This indicator displays monthly timeframe moving averages as horizontal dotted lines extending to the right of your chart, regardless of what timeframe you're currently viewing. It includes four key monthly moving averages: EMA 5, EMA 9, EMA 21, and SMA 50.
━━━━━━━━━━━━━━━━━━━━━━━━━━━━━━━━━━━━━━━━
Key Features:
Clean Chart Design
Unlike traditional moving average lines that clutter your chart with curves across all candles, this indicator uses horizontal dotted lines that extend only from the current price level to the right edge of your screen. The dotted line style creates clear visual breaks while maintaining readability.
Multi-Timeframe Analysis
View monthly moving averages on any timeframe (1min, 5min, 15min, 1hr, 4hr, daily, weekly, etc.) without switching charts. Perfect for traders who want to see the highest timeframe context while trading any lower timeframe.
Fully Customizable
Toggle each moving average on/off independently
Adjust the period length for each MA (default: 5, 9, 21, 50)
Customize colors for each line (default gradient: green → teal → yellow → red)
Master toggle to show/hide all monthly lines at once
All lines use dotted style for clear visual distinction
Professional Color Scheme
EMA 5: Bright Green (#4CAF50)
EMA 9: Teal (#009688)
EMA 21: Yellow (#FFEB3B)
SMA 50: Light Red (#FF6B6B)
━━━━━━━━━━━━━━━━━━━━━━━━━━━━━━━━━━━━━━━━
Benefits of Horizontal Dotted Lines:
Reduced Visual Noise
Horizontal lines keep your price action clean and easy to read while still providing critical monthly support/resistance levels. The dotted style adds visual distinction without being overwhelming.
Focus on Current Monthly Levels
What matters most is where the monthly MAs are NOW relative to price - horizontal lines highlight this instantly without requiring you to trace curved lines backward through history.
Better Price Action Visibility
See candlestick patterns, volume profiles, and support/resistance levels clearly without MA lines crossing through them. Your chart remains uncluttered and analysis-ready.
Quick Reference for Monthly Context
Instantly identify if price is above or below key monthly moving averages without following curved lines across the chart. Perfect for all traders who need to respect monthly structure and major trend direction.
Professional Appearance
Clean, minimalist design with dotted lines preferred by institutional traders and technical analysts who value both aesthetics and functionality.
━━━━━━━━━━━━━━━━━━━━━━━━━━━━━━━━━━━━━━━━
Use Cases:
Position Traders & Investors
Monitor monthly moving averages for major trend direction and long-term support/resistance zones. Monthly levels are among the most significant in technical analysis.
Swing Traders
Track monthly moving averages as major dynamic support/resistance levels for position sizing and risk management. Monthly levels often represent the strongest market structure.
Multi-Timeframe Analysis
Combine with daily and weekly charts to see complete timeframe confluence. Monthly levels provide the macro trend context for all trading decisions.
Trend Identification
Quickly identify monthly trend direction and major reversal zones. When price is above all monthly MAs, the macro trend is bullish; below all MAs indicates bearish monthly structure.
Risk Management
Use monthly moving averages as ultimate stop-loss zones for long-term positions. Breaking monthly MAs often signals significant trend changes.
━━━━━━━━━━━━━━━━━━━━━━━━━━━━━━━━━━━━━━━━
Technical Specifications:
Pine Script v5
Timeframe: Monthly (M)
Moving Averages: EMA 5, EMA 9, EMA 21, SMA 50
Line Style: Dotted (all lines)
Line Width: 2
Overlay: True (displays on main chart)
Resource Usage: Minimal (4 security calls)
━━━━━━━━━━━━━━━━━━━━━━━━━━━━━━━━━━━━━━━━
Best Practices:
Combine with PUNJI Dynamic Daily & Weekly EMA/SMA Indicators
For the ultimate multi-timeframe analysis, use this monthly indicator alongside "Punjis Dynamic Daily EMA/SMA 5,9,21,50,100,200 Levels" (solid lines) and "Punji's Dynamic Weekly EMA/SMA 5,9,21,50" (dashed lines). The three PUNJI indicators together provide complete insight into daily, weekly, and monthly market structure without cluttering your chart. Daily = Solid lines, Weekly = Dashed lines, Monthly = Dotted lines. This combination gives you a complete view of all major timeframe levels simultaneously.
Respect Monthly Structure
Monthly moving averages carry the most significant weight in technical analysis. Use them as major support/resistance zones and ultimate trend filters for all your trading decisions.
Customize to Your Strategy
Adjust the lengths and colors to match your personal trading methodology. Some traders prefer different EMA/SMA periods based on their market and investment timeframe.
Keep Charts Clean
Toggle off lines you're not actively using to maintain maximum chart clarity. The master toggle allows quick show/hide of all monthly levels.
━━━━━━━━━━━━━━━━━━━━━━━━━━━━━━━━━━━━━━━━
This indicator is perfect for traders and investors who want to maintain awareness of monthly market structure and major trend direction while keeping their charts clean, professional, and easy to read.
