RRE ZonesLine Creation: Each FVG box now has a corresponding dashed line drawn through its center:
Uses a dashed style for clear visibility
Matches the FVG color (with 30% transparency)
Extends to the right like the box
Width of 1 pixel
Synchronized Cleanup: When FVG boxes are removed (either by reaching max count or being filled by price), their corresponding center lines are also deleted automatically.
The center lines help you:
Quickly identify the 50% level of each FVG
Use it as a potential target or entry level
Better visualize the gap's midpoint for trading decisions
Indicatori e strategie

CandleMapTF - Automatic Candle Structure ToolDescription:
This Pine Script creates an "Automatic Candle Structure Tool" for TradingView that visually manages market structure and dealing ranges across multiple timeframes.
All elements, including colors, opacity, and displayed levels are fully customizable.
Disclaimer:
This script is for educational and informational purposes only and does not
constitute financial advice, investment advice, or a trading recommendation.
Use at your own risk.

Macroeconomic Dashboard by DGTMacroeconomic Dashboard is a script tailored for traders and investors using top-down strategies to navigate global markets. It integrates key macroeconomic indicators, such as monetary policy, inflation, yields, and market sentiment, directly into financial charts.
By visualizing real-time macro data alongside asset price movements, this tool bridges the gap between traditional economic metrics and technical analysis. Whether analyzing crypto or traditional markets, users can better contextualize price action within broader economic cycles and trends.
Designed to support macro-informed decision-making, it helps identify shifts in liquidity, policy direction, and risk appetite, enhancing strategic trade entries and portfolio positioning.
KEY FEATURES
⯌ Macro Dashboard
The script provides a macro dashboard that tracks changes across key economic dimensions: monetary policy, inflation and growth, bond markets, and risk indicators. With built-in anomaly detection and trend analysis across short-, mid-, and long-term timeframes, it helps interpret market moves through a macroeconomic lens, whether analyzing equities, commodities, or digital assets.
⯌ Macro on Chart
By visualizing macro data such as M2 money supply, CPI, treasury yields, and volatility indices, users can more easily correlate economic developments with price action, enhancing situational awareness and decision-making.
MACRO METRICS
The script covers five core macroeconomic domains, each with key metrics:
Liquidity & Monetary Policy
Global M2 Money Supply
Federal Funds Rate
Reverse Repo Operations
Inflation & Economic Growth
Consumer Price Index (CPI)
Producer Price Index (PPI)
Real GDP Growth
Yields & Bond Markets
10-Year Treasury Yield
2-Year Treasury Yield
Yield Curve (10Y–2Y Spread)
Global Risk & Currency Indicators
U.S. Dollar Index (DXY)
Volatility Index (VIX)
Economic Policy Uncertainty Index
Equities, Commodities & Crypto
S&P 500 (SPX)
Nasdaq 100 (NDX)
Gold (XAU/USD)
Crude Oil (WTI)
Bitcoin (BTCUSD)
DISCLAIMER
This script is intended for informational and educational purposes only. It does not constitute financial, investment, or trading advice. All trading decisions made based on its output are solely the responsibility of the user.
Script a pagamento

ForzAguanno - Premium / Discount (Range Glissant)Premium / Discount Zones – Dynamic Range (Fibo-based)
This indicator highlights Premium, Discount, and Equilibrium zones using a dynamic Fibonacci range calculated from recent price action.
It is designed to help traders contextualize price and avoid taking trades in unfavorable locations (e.g. buying too high or selling too low).
- How it works
The indicator automatically:
- Detects the highest high (HH) and lowest low (LL) over a rolling range
- Builds a Fibonacci-style structure between LL → HH
- Defines three key areas:
Discount Zone (lower part of the range)
Equilibrium Zone (around the 50% level)
Premium Zone (upper part of the range)
Two additional extreme levels are used:
0.075 → deep discount
0.925 → deep premium
These levels help isolate areas where price is statistically stretched.
- Visual elements
- Horizontal levels:
- Green → Discount
- Purple → Equilibrium
- Red → Premium
- Text labels are placed inside each zone for instant readability.
Zones are extended into the future for cleaner visualization.
- How to use it
This tool is best used as a context filter, not a standalone signal generator.
Typical use cases:
Look for longs in Discount
Look for shorts in Premium
Use Equilibrium as a neutral / decision zone
Combine with structure, momentum, or entry models
It works particularly well with:
Market structure concepts
Smart money / range-based trading
Session-based strategies
⚠️ Important notes
This indicator does not predict direction
It provides context, not signals
Always combine with proper risk management
Final thoughts
The goal of this indicator is simplicity and clarity:
Know where price is located inside its range before taking a trade.
If you find it useful, feel free to share feedback.

Liquidity Radar by DGTLiquidity Radar is an advanced indicator designed to uncover and visualize critical liquidity zones on the price chart. These zones mark areas where stop orders and limit orders are densely concentrated—price levels where large-scale liquidation events are more likely to occur. Such areas are often targeted by institutional players to spark volatility or to optimize trade execution.
The indicator dynamically draws horizontal levels that reflect real-time liquidity buildup based on volume and price activity. When multiple liquidation levels cluster near the same price, overlapping lines highlight zones of elevated liquidity—helping traders identify potential hotspots for price reactions, reversals, or volatility spikes.
KEY FEATURES
⯌ Magnet Zones
Clusters of liquidation levels may act as magnets for price, pulling market movement toward them. Traders often use these zones to forecast directional bias and identify high-probability setups.
⯌ Support/Resistance Zones
Densely packed liquidity often behaves as dynamic support or resistance. These zones can provide major players with optimal entry or exit points, potentially leading to sharp reactions or market reversals.
⯌ Rapid Move Zones
Areas with sparse liquidity levels often experience faster price movement, as fewer resting orders are available to absorb aggressive taker orders. These zones can lead to quick price sweeps and momentum surges.
INSIGHTS
What Happens After Price Reaches a High Liquidity Zone?
Liquidity is "Grabbed"
These zones are typically filled with stop-losses or resting orders. When price reaches them, large volumes are executed — often suddenly. This is known as a liquidity grab or stop hunt .
Increased Volatility
The execution of clustered orders often triggers bursts of volatility. This can result in large wicks, rapid price movements, or deceptive “fakeouts” around the zone.
Price Reaction Scenarios
Stall or Consolidation : After liquidity is grabbed, price may pause or range, especially if market participants are indecisive.
Reversal : If the liquidity grab flushes out weak hands, price may reverse sharply — often where institutional players are already positioned in the opposite direction.
Continuation : Sometimes, the zone acts as a launchpad — price consumes the liquidity and continues strongly in the same direction.
What Happens When Price Is Between Liquidity Zones?
Faster Price Moves
In areas with fewer clustered liquidity levels, price often moves quicker due to fewer resting orders absorbing aggressive taker orders, enabling market orders to push price rapidly through these zones.
Higher Probability of Market (Taker) Orders
Sparse liquidity encourages taker orders, which “take” liquidity instantly, causing sharp and sometimes unpredictable price swings.
Reduced Support or Resistance
The lack of dense liquidity means fewer natural price barriers, allowing price to sweep through these zones with less friction until it nears the next liquidity cluster.
Increased Volatility and Potential Whipsaws
Rapid movement in low liquidity zones can trigger stop losses or cause fakeouts, resulting in sudden volatility and quick reversals.
Opportunity for Breakouts or Trend Acceleration
Price breaking from a liquidity zone into a sparse area may gain momentum quickly, leading to strong directional moves or trend continuation.
Liquidity zones aren’t just price targets — they’re high-stakes decision points. Once tapped, they often serve as temporary barriers where price may reverse, stall, or continue, depending on the prevailing order flow and participant intent. In leveraged markets, liquidations play a crucial role in shaping price behavior and positioning. The Liquidity Levels indicator helps traders spot where these impactful moments are most likely to occur — enhancing both strategic edge and decision-making confidence.
LIMITATIONS
Due to a technical limitation in Pine Script, a maximum of 500 horizontal levels can be drawn. As a result, some historical liquidity levels from earlier bars may not appear on the chart.
DISCLAIMER
This script is intended for informational and educational purposes only. It does not constitute financial, investment, or trading advice. All trading decisions made based on its output are solely the responsibility of the user.
Script a pagamento

Orderblock Footprints [AlgoAlpha]🟠 OVERVIEW
This script highlights orderblocks and then drills into what actually trades inside them. Zones are created only after an abnormal directional impulse, measured with a z-score on consecutive candle bodies, so the orderblocks are tied to real expansion rather than simple pivots. Once a zone exists, the script overlays lower-timeframe volume footprints inside the candle when price trades back into that zone. The goal is to show not just where an orderblock sits, but whether price is being accepted or absorbed when it is revisited.
🟠 CONCEPTS
Orderblocks are detected after extreme bullish or bearish impulses. The script tracks consecutive body movement up or down, normalizes that distance with a rolling z-score, and only triggers when the move is statistically large. The last opposite candle before that impulse defines the orderblock range. These zones then extend forward until they are either mitigated by price closing through them or they expire by age.
Inside an active zone, the script switches to a lower timeframe and builds a footprint-style profile for each bar. Each candle is split into price rows, counting time-at-price and volume delta. Positive and negative delta are colored separately. Absorption is flagged when opposing delta prints appear in the wick that rejects the zone. In practice: the impulse defines context ; the footprint shows interaction .
🟠 FEATURES
Separate bullish and bearish zones with automatic extension
Volume split inside each zone candle (up vs down volume)
Lower-timeframe footprint with TPO-style rows and delta gradient
Absorption detection using opposing delta in rejection wicks
Alerts for zone creation and absorption events
🟠 USAGE
Setup : Add the script to your chart. It works on any market and timeframe. The lower timeframe for footprints is fixed at 5 minutes, so higher chart timeframes show clearer structure. Use the Z-Score Window to control how strict impulse detection is and Max Box Age to limit how long old zones stay on the chart.
Read the chart : Bullish orderblocks are created after strong upward impulses and are invalidated when price closes below them. Bearish orderblocks are created after strong downward impulses and are invalidated when price closes above them. When price trades inside a zone, footprint rows appear. Green-tinted rows show positive delta; red-tinted rows show negative delta. Absorption labels appear when opposing delta prints into a rejecting wick.
Settings that matter : Increasing the Z-Score Window makes orderblocks rarer but more significant. Disabling Prevent Overlap allows stacked zones if you want to study clustering. Adjusting Rows per bar changes footprint resolution—lower values are cleaner, higher values show more detail but use more objects.

Friday-Monday Pattern Backtest (Market Rebellion)Tests the "Friday-Monday Pattern" popularized by Tom Hougaard / Market Rebellion.
PATTERN LOGIC:
• When Friday's high is LOWER than Thursday's high (setup condition)
• Then Friday's low is often revisited on the following Monday
WHAT THIS INDICATOR SHOWS:
• Orange background highlights valid setup bars (Thu-Fri-Mon)
• Red horizontal line marks Friday's low (the target level)
• Green "SUCCESS" label = Monday hit Friday's low
• Red "FAIL" label = Monday did not reach Friday's low
• Stats table (top-right) shows total setups, successes, and success rate
USE THIS TO:
• Backtest the pattern on any daily chart (works best on indices, forex, futures)
• Verify the claimed "overwhelming" tendency statistically
• Identify which markets/timeframes show the highest success rate
CREDITS:
Pattern idea from Tom Hougaard / Market Rebellion: x.com
Indicator by BacktestBay for transparent pattern verification.
USAGE NOTES:
• Must be applied to DAILY charts
• Uses time_close("D") for accurate day-of-week detection on forex pairs
• No trading signals - purely for statistical backtesting

3LL+Baby & 3HH+Baby Pattern3LL+Baby & 3HH+Baby Pattern Indicator
Overview
This indicator identifies powerful reversal patterns based on momentum exhaustion and inside bar formations. It detects two specific candlestick patterns that signal potential trend reversals: the bullish 3LL+Baby and the bearish 3HH+Baby.
Pattern Descriptions
📈 3LL+Baby Pattern (Bullish Reversal)
Conditions:
Three consecutive candles form lower lows (each low is lower than the previous)
The fourth candle is bullish/green (closes higher than it opens)
The fourth candle is completely contained within the third candle's range (both high and low)
Interpretation: After a downward momentum with three lower lows, a bullish inside bar (baby candle) suggests sellers are exhausted and buyers may be taking control. This pattern often precedes upward reversals.
📉 3HH+Baby Pattern (Bearish Reversal)
Conditions:
Three consecutive candles form higher highs (each high is higher than the previous)
The fourth candle is bearish/red (closes lower than it opens)
The fourth candle is completely contained within the third candle's range (both high and low)
Interpretation: After upward momentum with three higher highs, a bearish inside bar indicates buyers are losing strength and sellers may be gaining control. This pattern often signals potential downward reversals.
Features
Visual Signals
Green Triangle (↑): Appears below bars when 3LL+Baby pattern is detected
Red Triangle (↓): Appears above bars when 3HH+Baby pattern is detected
Labels: Clear text labels identifying each pattern type
Background Highlighting: Subtle background colors (green for bullish, red for bearish)
Customization Options
Toggle labels on/off
Toggle arrow signals on/off
Enable/disable bullish patterns independently
Enable/disable bearish patterns independently
How to Use
Add to Chart: Apply the indicator to any timeframe and instrument
Configure Settings: Adjust visibility options based on your preference
Set Alerts: Create alerts for immediate pattern notifications
Trading Strategy:
3LL+Baby : Consider long positions or closing shorts
3HH+Baby: Consider short positions or closing longs
Always confirm with additional analysis and risk management
Best Practices
Use in conjunction with support/resistance levels
Combine with volume analysis for confirmation
Works on all timeframes (higher timeframes generally more reliable)
Apply proper risk management and stop-loss orders
Consider the broader market context and trend

Multi Timeframe Signal DashboardShows 10 indicators across 6 timeframes (5M, 15M, 30M, 1H, 4H, 1D):
EMA 50/100 crossover
RSI (with oversold/overbought highlighting)
MACD
DMI (DI+/DI-)
Stochastic (with extremes)
CCI
Bollinger Bands
VWAP
EMA 200 Trend
Momentum
Each cell shows ▲ (bullish/green) or ▼ (bearish/red), with scores per row and column, plus an overall BUY/SELL/HOLD signal.

Combined Signal + Auto Day Plan + Volume📘 TradingView Description — Combined Signal + Auto Day Plan + Volume
Strategy Overview
This strategy combines trend-following signals, daily context levels, and volume confirmation to generate high-probability intraday trading setups.
It is designed to filter noise, identify trend direction early, and avoid trades during low-quality market conditions.
🔷 1. Combined Signal Logic
The strategy merges multiple indicators to produce a single, cleaner signal:
Long Signal
Trend bias is bullish
Momentum histogram (MACD/Custom) shows upward pressure
Price crosses above the midline (WMA/EMA/etc.)
Volume supports the move
Short Signal
Trend bias is bearish
Momentum histogram shows downward pressure
Price crosses below the midline
Volume supports the move
This reduces false breakouts and ensures signals appear only during strong directional moves.
🔶 2. Auto Day Plan Levels (D-1 → D)
The script automatically reads previous day levels and displays them on today’s session:
Previous Day High (PDH)
Previous Day Low (PDL)
Previous Day Close (PDC)
Previous Day Mid / Range Zones
Optional FIB levels or custom zones
These levels act as intraday support/resistance, helping identify breakout, reversal, and retest opportunities.
Behavior:
D-1 levels are plotted from today’s open until today’s close.
Levels do not overlap into the wrong day.
Optional: extend lines to next day (D+1) for planning.
🔷 3. Volume Confirmation
To improve entry accuracy, the script checks for strength in volume:
Volume > X-period average
Volume spike detection
Relative Volume (RVOL) filter
Optional low-volume avoidance
A trade is taken only when the market shows real participation, reducing traps and sideways chop trades.
🔶 4. Entry & Exit Logic
Entry
Long Entry: Combined bull signal + volume confirmation
Short Entry: Combined bear signal + volume confirmation
Exit
Long Exit → Histogram turns down (hist < hist )
Short Exit → Histogram turns up (hist > hist )
Optional:
Auto SL at PDL/PDH
Trailing based on midline
Take profit using FIB or volatility levels
💠 5. Visuals
The chart plots:
Buy/Sell markers
D-1 support/resistance lines
Trend direction midline
Volume confirmation label
Combined signal status
Colors and styles can be customized from the input panel.
🎯 6. Purpose of the Strategy
This is a complete intraday automation tool combining:
✔ Trend
✔ Momentum
✔ Volume strength
✔ Key day levels
The goal is to provide structured, mechanical, rule-based trading — reducing emotional decisions and improving consistency.

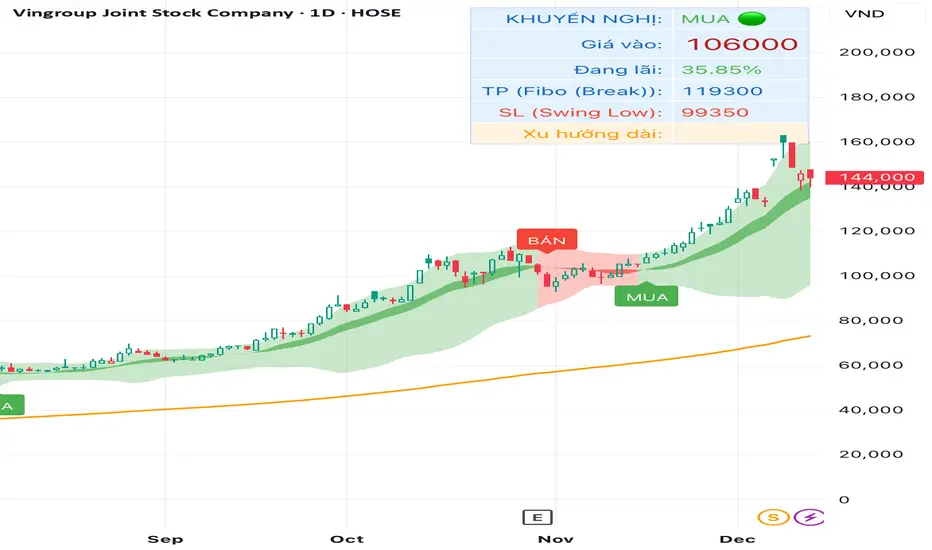
TRAING.COM.VN V66TRAING.COM.VN V66 – Professional Trend Following System
TRAING.COM.VN V66 is an advanced trend-following toolkit designed to capture major market moves with institutional-grade precision, optimized for both Swing and Position trading.
KEY FEATURES:
Trend Lock Technology: Utilizes HLC3 & Pivot Breakout logic to "lock" the trend color, eliminating noise and fake signals during consolidation.
Smart Target Engine: Automatically scans multi-timeframe data to determine the best Take Profit level:
Safe Mode: Targets strong Daily Resistance levels.
ATH Mode: Switches to Fibonacci Extension when price breaks All-Time Highs to maximize profits.
Pro Risk Management: Features an automatic Swing Low Stoploss (5-candle lookback) and an integrated Trailing Stop to secure gains as price rallies.
Macro Trend Filter: Built-in EMA 200 warning system to prevent trading against the long-term trend.
Clean Chart Mode: Option to display only the Last Active Signal, keeping your chart clutter-free for focused execution.

Time Cycles [TMU]Title: Time Cycles
Description:
This indicator is a comprehensive Time-Based Market Structure tool designed to segment the trading day into fixed temporal windows using New York Time logic. Unlike standard price-lagging indicators (like MA or RSI), this script focuses purely on Time and Price geometry, visualizing how price action behaves within specific 90-minute, 30-minute, and 10-minute intervals.
It is engineered to help traders visualize the "Time" component of the chart by projecting historical high/low ranges and key opening prices automatically using advanced array management.
Underlying Logic & Calculation
The script operates on a fixed time schedule (defaulting to America/New_York timezone) to generate three distinct layers of analysis:
1. The "Previous 90-Minute Cycle" Engine The script identifies fixed 90-minute blocks starting from 02:30 NY time.
Logic: At the close of each 90-minute window, the script records the Highest High and Lowest Low of that specific session .
Projection (PCH/PCL): These levels are projected forward into the next 90-minute window as static support/resistance zones (PCH - Previous Cycle High, PCL - Previous Cycle Low) using a "Step-Locked" mechanism that prevents repainting of the projected level.
Equilibrium (EQ): The script automatically calculates the 50% mean level between the PCH and PCL to highlight the premium/discount midpoint of the previous range.
2. Intraday Cycle Phases The indicator visualizes the fractal nature of time by highlighting specific 30-minute and 90-minute sessions.
Phases: The script categorizes sessions into three customizable structural phases: Accumulation (Blue), Manipulation (Red), and Distribution (Green). This helps traders identify the potential intent of price action within a specific time window.
Visualization: It draws background ranges based on hard-coded timestamps (e.g., 02:30–04:00 for the first London cycle) to visually segregate market phases.
3. Key Opening Price Anchors The script plots significant "Time Opens" that act as institutional reference points.
Midnight Open (00:00 NY): The exact opening price of the day.
09:30 Open: The standard US Equity Market Open price.
Weekly/Yearly Opens: Uses non-repainting request.security calls to fetch higher-timeframe open prices.
Cycle Open (C.O.): The opening price of the current 90-minute macro bucket.
Unique Features & Originality
This script implements custom algorithmic solutions to manage time-based data, distinguishing it from standard library indicators:
Custom 10-Minute Box Arrays: Unlike standard security calls, this script uses a box array system to capture and render 10-minute micro-structures (tenBoxes) directly on the chart. It calculates the High/Low of every 10-minute block dynamically and stores them in a rolling array to visualize sub-fractal structure without changing timeframes.
Object-Oriented Line Management: To optimize performance and maintain a clean chart, the script employs a custom User-Defined Type (type Lines). This allows for an advanced "garbage collection" method (manage_lines) that automatically trims, extends, or deletes opening lines based on the current time, ensuring that historical data does not clutter the workspace.
Predictive "Step-Locked" Projection: The code utilizes a logic state that locks the previous cycle's coordinates (prevCycHigh, prevCycLow) only upon the confirmed close of the session, projecting these specific coordinates forward using box.new rather than plot, allowing for precise, interactive visual blocks.
How to Use
PCH/PCL Boxes: Use the projected boxes from the previous 90m cycle as potential Support (PCL) or Resistance (PCH) for the current cycle.
EQ Line: The orange line represents the "Fair Value" of the previous range.
Settings: Users can toggle visibility for 30m cycles, 10m boxes, and opening lines independently to suit their strategy.
Disclaimer: This tool is for structural analysis and visualization of time windows. It does not guarantee future price movement. Past performance is not indicative of future results.

BALANCED Strategy: Intraday Pro + Smart DashboardWelcome to the BALANCED Strategy: Intraday Pro.
This all-in-one indicator is designed for Intraday traders looking to capture trend movements while effectively filtering out sideways market noise. It combines the power of Supertrend for direction, EMA 100 for the baseline trend, and rigorous validation via RSI and ADX.
The script also integrates a complete Risk Management system with targets based on the Golden Ratio (Fibonacci) and a real-time Dashboard.
⏳ Recommended Timeframes
This algorithm is optimized for Intraday volatility:
M5 (5 Minutes) ⭐️: Ideal for quick Scalping. The ADX filter is crucial here to avoid false signals.
M15 (15 Minutes) 🏆: The "Sweet Spot." It offers the best balance between signal frequency and trend reliability.
M30 / H1: For a "Swing Intraday" approach—calmer, fewer signals, but higher precision.
Not recommended for M1 (1 Minute) with default settings (too much noise).
🚀 How It Works
The algorithm follows a strict 3-step logic to generate high-quality signals:
1. Trend Identification (The Engine)
Supertrend: Determines the immediate direction.
EMA 100: Acts as a background trend filter. We only buy above and sell below the EMA.
2. Noise Filtering (Safety)
ADX (Average Directional Index): The signal is only validated if there is sufficient volatility (Configurable threshold, default 12) to avoid "chop markets" (flat markets).
RSI (Relative Strength Index): Strict momentum filter. Buy only if RSI > 50, Sell if RSI < 50.
3. Entry Confirmation (The Trigger)
The script doesn't just rely on a crossover. It waits for "Price Action" confirmation: the candle must close higher than the previous one (for Long) or lower (for Short) to validate the entry.
🛡️ Risk Management (Money Management)
This is the core strength of this tool. Upon signal validation, the script automatically calculates and plots:
Stop Loss (SL): Based on volatility (ATR). It places the stop at the recent Low/High with a safety padding.
Take Profit (TP): Two modes available:
Fibonacci Mode (Default): Targets the 1.618 extension (Golden Ratio) of the risk taken.
Fixed Ratio Mode: Targets a manual Risk/Reward ratio (e.g., 2.0).
📊 The Dashboard
Located at the bottom right, the smart dashboard provides vital info at a glance:
Signal Time: To check if the alert is fresh.
Type (LONG/SHORT): Color-coded (Green/Pink).
Tech Data: RSI and ADX values at the moment of the signal.
Exact Prices: Entry Level, Target (TP), and Stop Loss (SL).
⚙️ Configurable Settings
Sensitivity: Adjust the Supertrend factor (Default 2.0).
Filters: Toggle the RSI filter ON/OFF or adjust the ADX threshold.
Execution: Choose between Fibonacci Target (1.618) or a Manual Ratio.
⚠️ Disclaimer: This tool is a technical decision aid and does not constitute financial investment advice. Always use prudent risk management and backtest the indicator on your preferred assets before live use.

EMA/Volume/Institutional Candle (Deep)This indicator is designed for short-term swing trading and intraday trend identification using a combination of EMA structure, momentum shifts, volume confirmation, and institutional footprint analysis.
🔹 Key Features
1. EMA Trend Framework (9, 20, 50, 200)
✔ EMA 9 & EMA 20: Ultra-short-term momentum; ideal for fast trend shifts.
✔ EMA 50: Medium-term trend guide; helps identify pullbacks vs. reversals.
✔ EMA 200: Long-term trend bias and major dynamic support/resistance.
2. EMA 9/20 Crossover Signal
✔ Bullish Crossover → EMA 9 crossing above EMA 20 indicates momentum expansion and early trend reversal.
✔ Bearish Crossover → EMA 9 crossing below EMA 20 shows momentum weakening and possible short-side opportunity.
3. High-Volume Zone Detection
✔ Highlights candles with volume spikes above average, signaling institutional interest.
✔ Useful for identifying breakout validity, liquidity grabs, or trap candles.
4. Institutional Candles (Smart Money Footprint)
✔ Automatically marks institutional order blocks, imbalance zones, or large displacement candles.
✔ Helps traders identify where smart money entered the market and potential mitigation zones.
🎯 How This Indicator Helps You Trade
✔ Quickly spot trend direction with multi-EMA alignment
✔ Identify high-probability entries with EMA 9/20 crossover + volume confirmation
✔ Find institutional zones for sniper-style entries
✔ Filter fake breakouts using volume spikes
✔ Perfect for stocks, indices, crypto, and forex

TRADING.COM.VN Pro V66TRADING.COM.VN – Professional Trend Following System
TRADING.COM.VN is an advanced trend-following toolkit designed to capture major market moves with institutional-grade precision, optimized for both Swing and Position trading.
KEY FEATURES:
Trend Lock Technology: Utilizes HLC3 & Pivot Breakout logic to "lock" the trend color, eliminating noise and fake signals during consolidation.
Smart Target Engine: Automatically scans multi-timeframe data to determine the best Take Profit level:
Safe Mode: Targets strong Daily Resistance levels.
ATH Mode: Switches to Fibonacci Extension when price breaks All-Time Highs to maximize profits.
Pro Risk Management: Features an automatic Swing Low Stoploss (5-candle lookback) and an integrated Trailing Stop to secure gains as price rallies.
Macro Trend Filter: Built-in EMA 200 warning system to prevent trading against the long-term trend.
Clean Chart Mode: Option to display only the Last Active Signal, keeping your chart clutter-free for focused execution.

NeoChartLabs TrixxOne of our Favorite Indicators - The Trixx - The Trix with K & J lines for extra crossovers and trend analysis. Best when used on the 4hr and above.
Shout out to fauxlife for the original script, we updated to v6.
The TRIX indicator (Triple Exponential Average) is a momentum oscillator used in technical analysis to show the percentage rate of change of a triple-smoothed exponential moving average, helping traders identify overbought/oversold conditions and potential trend reversals by filtering out minor price fluctuations. It plots as a line oscillating around a zero line, often with a signal line (an EMA of TRIX) for crossovers, and traders look for divergence with price or signal line crosses for buy/sell signals

Golden hour 1130 1230 Session LinesGolden Hour 11:30–12:30 Session Lines
Overview :
Calculate the session high and low between 11:30 AM and 12:30 PM and mark the lines.
Trading Rule
Once the price breaks either side (high or low), it will continue to move further in that direction.
Session Time : 11:30 AM – 12:30 PM
Key Levels : Session High & Session Low
Strategy : Breakout continuation in the direction of the break

TRADING.COM.VN Pro V43 (Pivot & Smart Target D)TRADING.COM.VN – Professional Trend Following System
TRADING.COM.VN is an advanced trend-following toolkit designed to capture major market moves with institutional-grade precision, optimized for both Swing and Position trading.
KEY FEATURES:
Trend Lock Technology: Utilizes HLC3 & Pivot Breakout logic to "lock" the trend color, eliminating noise and fake signals during consolidation.
Smart Target Engine: Automatically scans multi-timeframe data to determine the best Take Profit level:
Safe Mode: Targets strong Daily Resistance levels.
ATH Mode: Switches to Fibonacci Extension when price breaks All-Time Highs to maximize profits.
Pro Risk Management: Features an automatic Swing Low Stoploss (5-candle lookback) and an integrated Trailing Stop to secure gains as price rallies.
Macro Trend Filter: Built-in EMA 200 warning system to prevent trading against the long-term trend.
Clean Chart Mode: Option to display only the Last Active Signal, keeping your chart clutter-free for focused execution.
Long an Short Liq filter rev 3.0 /nnaCan help you to see horizontal Liquidation maps on cryptocurrency market. Script created to help you with EP. Calibration parameters for different coins could be different. Write me in Dm. i can help you with that

Prince Break and RetestHow to use the new visuals (super simple)
When the script prints RETEST BUY or RETEST SELL, you will instantly see:
ENTRY line (lime)
SL line (orange)
TP1 line (teal)
TP2 line (purple)
Entry Mode options
Close = enter at the close of the retest signal candle (simplest)
Box Edge = enter at the box edge (more “limit-order-ish”)
For your style (break + retest), start with Close.

Trend Change ScannerTrend Change Scanner
Focused on detecting trend reversals:
Shows reversal status: BULL REV, BEAR REV, BULL SETUP, BEAR SETUP, or Neutral
Displays: Trend direction, RSI, ADX, EMA Gap %, Bull/Bear scores
Yellow highlight when EMA gap < 0.5% (EMAs converging - potential cross)
Overall signal with action recommendation

ETH UU Reversion Strategy Strategy Overview
The "ETH UU Reversion Strategy" is a sophisticated mean-reversion trading system designed to capture price reversals at standard deviation extremes. Unlike typical strategies that enter trades immediately at market price, this script employs a proprietary **Limit Order Execution Mechanism** combined with volatility filtering to optimize entry prices and reduce slippage.
Originality & Key Features
This script addresses the common pitfalls of standard Bollinger Band strategies by introducing advanced order management logic:
1. Limit Order Execution:** Instead of market orders, the strategy calculates an optimal entry price based on ATR offsets. This allows traders to capitalize on "wicks" and secure better risk-reward ratios.
2. Smart Timeout Logic:To prevent "catching a falling knife," pending orders are automatically cancelled if not filled within a customizable number of bars (default: 15). This ensures orders do not remain active when market structure shifts.
3. Dynamic Risk Recalculation:** Stop Loss (SL) and Take Profit (TP) levels are recalculated at the exact moment of execution using the real-time ATR, ensuring risk parameters adapt to current market volatility.
How to Use
1. Setup: Apply the strategy to ETH/USDT (or other crypto pairs) on 15m or 1h timeframes.
2. Configuration:
* Adjust `BB Length` and `RSI Length` to fit your timeframe.
* Set `Order Timeout` to define how long a pending order should remain active.
* Toggle `Use ADX Filter` to avoid trading against strong trends.
3. *Visuals: The chart displays distinct labels for pending orders (Gray), active entries (Blue/Red), and cancellations, providing full transparency of the strategy's logic.
Risk Disclaimer
This script is for educational and quantitative analysis purposes only. Past performance regarding backtesting or live trading does not guarantee future results. Cryptocurrency trading involves high risk and high volatility. Please use proper risk management and trade at your own discretion.
-------------------------------------------------------------
Chinese Translation (中文说明)
策略概述
“ETH UU 均值回归策略”是一个旨在捕捉标准差极端位置价格反转的交易系统。与立即以市价入场的典型策略不同,本策略采用独特的**挂单执行机制**结合波动率过滤,以优化入场价格并减少滑点。
原创性与核心功能
本脚本通过引入高级订单管理逻辑,解决了普通布林带策略的常见缺陷:
1. 挂单交易模式: 策略不使用市价单,而是根据 ATR 偏移计算最佳入场价(Limit Orders)。这允许交易者捕捉K线的“影线”,获得更好的盈亏比。
2. 智能超时撤单: 为了防止“接飞刀”,如果挂单在指定K线数内(默认15根)未成交,系统会自动撤单。这确保了当市场结构发生变化时,旧的挂单不会被错误触发。
3. 动态风控重算: 止损和止盈在成交的瞬间根据实时 ATR 重新计算,确保风控参数始终适应当前的市场波动率。
风险提示
本脚本仅供教育和量化分析使用。回测或实盘的过往表现并不预示未来结果。加密货币交易具有极高的风险和波动性,请务必做好仓位管理,并自行承担使用本策略的风险。

NeoChartLabs Trend VolatalityAn Experimental Indicator - Trend Volatility
Using the Trix & ATR, it becomes possible to measure the volatility in the trend.
When the ATR% is below the user defined rate (default is 5%), the background turns RED signaling a low vol asset.
If ATRP goes under 5% in Crypto and the background turns RED - expect a large move to happen soon either up or down.
