Volume Sentiment Breakout Channels [AlgoAlpha]🟠 OVERVIEW
This tool visualizes breakout zones based on volume sentiment within dynamic price channels . It identifies high-impact consolidation areas, quantifies buy/sell dominance inside those zones, and then displays real-time shifts in sentiment strength. When the market breaks above or below these sentiment-weighted channels, traders can interpret the event as a change in conviction, not just a technical breakout.
🟠 CONCEPTS
The script builds on two layers of logic:
Channel Detection : A volatility-based algorithm locates price compression areas using normalized highs and lows over a defined lookback. These “boxes” mark accumulation or distribution ranges.
Volume Sentiment Profiling : Each channel is internally divided into small bins, where volume is aggregated and signed by candle direction. This produces a granular sentiment map showing which levels are dominated by buyers or sellers.
When a breakout occurs, the script clears the previous box and forms a new one, letting traders visually track transitions between phases of control. The colored gradients and text updates continuously reflect the internal bias—green for net-buying, red for net-selling—so you can see conviction strength at a glance.
🟠 FEATURES
Volume-weighted sentiment map inside each box, with gradient color intensity proportional to participation.
Dynamic text display of current and overall sentiment within each channel.
Real-time trail lines to show active bullish/bearish trend extensions after breakout.
🟠 USAGE
Setup : Add the script to your chart and enable Strong Closes Only if you prefer cleaner breakouts. Use shorter normalization length (e.g., 50–80) for fast markets; longer (100–200) for smoother transitions.
Read Signals : Transparent boxes mark active sentiment channels. Green gradients show buy-side dominance, red shows sell-side. The middle dashed line is the equilibrium of the channel. “▲” appears when price breaks upward, “▼” when it breaks downward.
Understanding Sentiment : The sentiment profile can be used to show the probability of the price moving up or down at respective price levels.
Indicatori e strategie

Multi Pivot Trend [BigBeluga]🔵 OVERVIEW
The Multi Pivot Trend is an advanced market-structure-driven trend engine that evaluates trend strength by scanning multiple pivot breakouts simultaneously.
Instead of relying on a single swing length, it tracks breakouts across ten increasing pivot lengths — then averages their behavior to produce a smooth, reliable trend reading.
Mitigation logic (close, wick, or HL2 touches) controls how breakouts are confirmed, giving traders institutional-style flexibility similar to BOS/CHoCH validation rules.
This indicator not only colors candles based on trend strength, but also extends trend strength and volatility-scaled projection candles to show where trend pressure may expand next.
Pivot breakout lines and labels mark key changes, making the trend transitions extremely clear.
🔵 CONCEPTS
Market trend strength is reflected by multiple pivot breakouts, not just one.
The indicator analyzes ten pivot structures from smaller to larger swings.
Each bullish or bearish pivot breakout contributes to trend score.
Mitigation options (close / wick / HL2) imitate smart-money breakout confirmation logic.
Trend score is averaged and translated into colors and extension bars.
Neutral regime ≈ weak trend or transition zone (trend compression).
🔵 FEATURES
Multi-Pivot Engine — tracks 10 pivot-based trend signals simultaneously.
Mitigation Modes :
• Close — breakout requires candle close beyond pivot
• Wicks — breakout requires wick violation
• HL2 — breakout confirmed when average (H+L)/2 crosses level
Dynamic Color System :
• Blue → confirmed bullish rotation
• Red → confirmed bearish rotation
• Orange → neutral / transition state
Breakout Visualization — draws pivot breakout lines in real-time.
Trend Labels — prints trend %.
Trend Volatility-Scaled Extension Candles — ATR/trend strength based candle projections show momentum continuation strength.
Gradient Pivot Encoding — higher pivot lengths = deeper structure considered.
🔵 HOW TO USE
Use strong blue/red periods to follow dominant structural trend.
Watch for color transition into orange — possible trend change or consolidation.
Pivot breakout lines help validate structure shifts without clutter.
Wick mitigation catches aggressive liquidity-sweep based breaks.
Close/HL2 mitigation catches cleaner market structure rotations.
Extension bars visualize trend pressure — large extensions = strong push.
Best paired with volume or volatility confirmation tools.
🔵 CONCLUSION
The Multi Pivot Trend is a structural trend recognition system that blends multiple pivot breakouts into one clean trend score — with institutional-style mitigation logic and volatility-projected trend extensions.
It gives traders a powerful, visually intuitive way to track momentum, spot trend rotations early, and understand true structural flow beyond simple MA-based approaches.
Use it to stay aligned with the dominant swing direction while avoiding noise and false flips.

Balanced Delta Volume Profile (Zeiierman)█ Overview
Balanced Delta Volume Profile (Zeiierman) builds a vertical, price-by-price profile that blends total participation with balance quality. Instead of plotting raw volume alone, it weights each price bin by:
how balanced buyers vs. sellers were,
how compressed price was inside that bin,
how often price revisited it.
The result spotlights fair value and acceptance zones while still revealing momentum/imbalance areas—ideal for reading rotation vs. trend, continuation vs. exhaustion, and the prices that truly matter.
Highlights
Balanced score that fuses delta symmetry, price compression, and hit frequency.
Optional heat spectrum for instant read of participation density and balance strength.
POC-like auto highlight of the dominant price level within the lookback window.
Works across timeframes for session profiling, swing context, or regime shifts.
█ How It Works
⚪ Profile Construction
The script scans a fixed History Length and divides the full high–low span into Bin Count price bins. For every bar in the window, its volume is proportionally distributed across the bins it overlaps, so wide-range bars contribute across multiple bins, while narrow bars concentrate where they traded most. This yields per-bin totals for:
Total Volume (participation)
Positive / Negative Volume (up vs. down bar contribution)
Hit Count (how often price touched the bin)
Average Price Range (mean bar range inside the bin; a proxy for compression)
⚪ Delta & Direction
For each bin, delta symmetry is measured via the ratio of |pos − neg| to total volume. Bins with balanced two-sided flow score higher than one-sided, runaway bins. This curbs the tendency of raw volume profiles to over-reward impulsive bursts.
⚪ Balance Score
Each price bin gets a balance score that multiplies three normalized components:
Delta Balance: rewards bins where buy/sell pressure is symmetrical (configurable via Volume Momentum Weight).
Price Compression: rewards bins where average bar range is relatively small (configurable via Price Momentum Weight).
Durability: rewards bins revisited often (configurable via Hits Weight).
A Min Hits Filter removes flimsy, single-touch bins from dominating the score. The profile can display pure totals or Average Mode (Vol/Hit) to compare bins fairly when hit counts differ.
⚪ Display & Heat Spectrum
The final plotted bar length per bin is the display volume (total or average) weighted by the balance score and normalized to 100.
POC-like Highlight: The 100% bin is outlined (and labeled) when Highlight Max Volume Bin is ON.
Heat Spectrum (optional): A background gradient scales with normalized bar length and balance hue.
Balance Hue: Interpolates between Balance Low/High Colors so high-balance bins visually pop as “accepted value.”
█ How to Use
The profile is effectively a map of price acceptance:
High, bright bars = strong participation at balanced prices → fair value/rotation zones.
Thin, muted bars = poor acceptance → imbalance or transition areas.
POC-style level = most influential price in the lookback window.
⚪ Find Fair Value & Acceptance
Thick, high-balance bins mark value. Expect rotation: price often revisits or oscillates around these areas. They’re prime zones for mean-reversion fades, scale-ins, and risk-defined trades against the edges.
⚪ Identify Imbalance & Funnels
Low-balance, low-hit bins often act like air pockets—price can move through them quickly. These zones are helpful for continuation trades into thin areas or for timing breakout pulls back into acceptance.
⚪ POC Dynamics
When price leaves the POC and returns, watch for re-acceptance (price comes back into the POC or high-balance zone and stays there.) vs. rejection (trend continuation away from value). The auto-highlight makes this quick to judge.
█ Settings
History Length – Bars scanned for the profile. Longer = broader context, slower to adapt.
Bin Count – Vertical resolution of bins between the window’s min and max price.
Display Shift – Offsets the rendering rightward for clarity.
Average Mode (Vol/Hit) – ON uses average volume per visit; OFF uses total volume.
Volume Momentum Weight – Emphasizes two-way flow; higher values favor balanced bins over one-sided deltas.
Price Momentum Weight – Emphasizes compression; higher values favor narrow-range, coiling price action.
Hits Weight – Rewards bins revisited often; higher values favor durable acceptance.
Min Hits Filter – Minimum visits a bin needs to qualify for the balance score.
Show Heat Spectrum – Background gradient for quick read of density and balance.
Highlight Max Volume Bin – Outline + raw volume label for the dominant bin.
Max Volume Color – Color used for that highlight.
Balance Low/High Colors – Gradient endpoints for balance hue across the profile.
-----------------
Disclaimer
The content provided in my scripts, indicators, ideas, algorithms, and systems is for educational and informational purposes only. It does not constitute financial advice, investment recommendations, or a solicitation to buy or sell any financial instruments. I will not accept liability for any loss or damage, including without limitation any loss of profit, which may arise directly or indirectly from the use of or reliance on such information.
All investments involve risk, and the past performance of a security, industry, sector, market, financial product, trading strategy, backtest, or individual's trading does not guarantee future results or returns. Investors are fully responsible for any investment decisions they make. Such decisions should be based solely on an evaluation of their financial circumstances, investment objectives, risk tolerance, and liquidity needs.

TRI - Support/Resistance ZonesTRI - SUPPORT/RESISTANCE ZONES v1.0
DESCRIPTION:
Professional support and resistance level indicator based on body pivot analysis.
Unlike traditional indicators that use wicks (high/low), this tool identifies key levels
using candle bodies (open/close), providing more reliable and significant price zones.
KEY FEATURES:
Body-based pivot detection for more meaningful levels
Automatic level validation (excludes breached levels)
Smart level filtering (avoids cluttered charts)
Configurable number of support/resistance levels (1-5 each)
Visual customization (colors, transparency, line extension)
Real-time breakout alerts for resistance and support levels
Clean and intuitive interface with price labels
HOW IT WORKS:
The indicator scans historical price action to identify pivot points based on candle bodies.
Only valid levels (not breached since formation) are displayed. Levels are automatically
filtered by proximity to avoid visual clutter while maintaining the most relevant zones.
Breakout alerts trigger when price closes above resistance or below support.
BEST USE:
Ideal for swing trading, day trading, and identifying key decision points.
Works on all timeframes and asset classes.

Ichimoku Average with Margin█ OVERVIEW
“Ichimoku Average with Margin” is a technical analysis indicator based on an average of selected Ichimoku system lines, enhanced with a dynamic safety margin (tolerance). Designed for traders seeking a simple yet effective tool for trend identification with breakout confirmation. The indicator offers flexible settings, line and label coloring, visual fills, and alerts for trend changes.
█ CONCEPT
The Ichimoku Cloud (Ichimoku Kinko Hyo) is an excellent, comprehensive technical analysis system, but for many traders—especially beginners—it remains difficult to interpret due to multiple overlapping lines and time displacements.
Experimentally, I decided to create a simplified version based on its foundations: combining selected lines into a single readable average (avgLine) and introducing a dynamic safety margin that acts as a buffer against market noise.
This is not the full Ichimoku system—it’s merely a clear method for determining trend, accessible even to beginners. The trend changes only after the price closes beyond the margin, eliminating false signals.
█ FEATURES
Ichimoku Lines:
- Tenkan-sen (Conversion Line) – Donchian average over 9 periods
- Kijun-sen (Base Line) – Donchian average over 26 periods
- Senkou Span A – average of Tenkan and Kijun
- Senkou Span B – Donchian average over 52 periods
- Chikou Span – close price (no offset)
Dynamic Average (avgLine):
- Arithmetic mean of only the enabled Ichimoku lines – full component selection flexibility.
Safety Margin (tolerance):
Calculated as:
- tolerance = multiplier × SMA(|open - close|, periods)
- Default: multiplier 1.8, period 100.
Trend Detection:
- Uptrend → when price > avgLine + tolerance
- Downtrend → when price < avgLine - tolerance
- Trend changes only after full margin breakout.
- Margin can be set to 0 – then signals trigger on avgLine crossover.
Signal Labels:
- “Buy” (green, upward arrow) – on shift to uptrend
- “Sell” (red, downward arrow) – on shift to downtrend
Visual Fills:
- Between avgLine and marginLine
- Between avgLine and price (with transparency)
- Colors: green (uptrend), red (downtrend)
Alerts:
- Trend Change Up – price crosses above margin
- Trend Change Down – price crosses below margin
█ HOW TO USE
Add to Chart: Paste code in Pine Editor or find in the indicator library.
Settings:
Ichimoku Parameters:
- Conversion Line Length → default 9
- Base Line Length → default 26
- Leading Span B Length → default 52
- Average Body Periods → default 100
- Tolerance Multiplier → default 1.8
Line Selection:
- Enable/disable: Tenkan, Kijun, Span A, Span B, Chikou
Visual Settings:
- Uptrend Color → default green
- Downtrend Color → default red
- Fill Between Price & Avg → enables shadow fill
Signal Interpretation:
- Average Line (avgLine): Primary trend reference level.
- Margin (marginLine): Buffer – price must break it to change trend. Set to 0 for signals on avgLine crossover.
- Buy/Sell Labels: Appear only on confirmed trend change.
- Fills: Visualize distance between price, average, and margin.
- Alerts: Set in TradingView → notifications on trend change.
█ APPLICATIONS
The indicator works well in:
- Trend-following: Enter on Buy/Sell, exit on reversal.
- Breakout confirmation: Ideal for breakout strategies with false signal protection.
- Noise filtering: Margin eliminates consolidation fluctuations.
Adjusting margin to trading style:
- Short-term trading (scalping, daytrading): Reduce or set margin to 0 → more and faster signals (but more false ones).
- Long-term strategies (swing, position): Increase margin (e.g. 2.0–3.0) → fewer signals, higher quality.
Entry signals are not limited to Buy/Sell labels – use like moving averages:
- Test and bounce off avgLine as support/resistance
- avgLine breakout as momentum signal
- Pullback to margin as trend continuation entry
Combine with:
- Support/resistance levels
- Fair Value Gaps (FVG)
- Volume or other momentum indicators
█ NOTES
- Works on all markets and timeframes.
- Adjust multiplier and periods to instrument volatility.
- Higher multiplier → fewer signals, higher quality.
- Disable unused Ichimoku lines to simplify the average.

HTF Control Shift + FVG Interaction + Shift Lines
### 📘 **HTF Control Shift + FVG Interaction + Shift Lines**
This indicator combines **Higher Timeframe Control Shift detection**, **Fair Value Gap (FVG) tracking**, and **Shift Line projection** into one complete structure-based trading toolkit.
#### 🔍 **Features**
* **Control Shift Detection:**
Highlights bullish or bearish “Control Shift” candles based on wick/body ratios — showing where aggressive control transitions occur.
* **Fair Value Gap Mapping:**
Automatically detects and draws bullish or bearish FVGs on any chosen timeframe, with optional dynamic extension and mitigation tracking.
* **Shift Line Projection:**
Extends high and low lines from each Control Shift candle to visualize structure and potential continuation or rejection zones.
* **Interaction Alerts:**
Triggers alerts when:
* A Bullish Control Shift interacts with a Bullish FVG
* A Bearish Control Shift interacts with a Bearish FVG
* Price breaks the high/low following an interaction
* **Visual Highlights:**
Colored FVG zones, labeled interactions, and diamond markers for easy visual confirmation of key reaction points.
#### ⚙️ **How to Use**
1. Choose a **higher timeframe (HTF)** in settings (e.g., 15m, 1h, 4h).
2. Watch for **Control Shift candles** (yellow/orange bars) forming at or interacting with **FVG zones**.
3. A **Bullish Interaction + Break of High** often signals continuation.
A **Bearish Interaction + Break of Low** may confirm rejection or trend reversal.
4. Use alerts to track live market structure shifts without constant chart watching.
#### 🧠 **Purpose**
Ideal for traders combining **Smart Money Concepts (SMC)** and **candle structure logic**, this tool visualizes where institutional aggression shifts align with **liquidity gaps** — helping anticipate **high-probability continuations or reversals**.

Quantum Fluxtrend [CHE] Quantum Fluxtrend — A dynamic Supertrend variant with integrated breakout event tracking and VWAP-guided risk management for clearer trend decisions.
Summary
The Quantum Fluxtrend builds on traditional Supertrend logic by incorporating a midline derived from smoothed high and low values, creating adaptive bands that respond to market range expansion or contraction. This results in fewer erratic signals during volatile periods and smoother tracking in steady trends, while an overlaid event system highlights breakout confirmations, potential traps, or continuations with visual lines, labels, and percentage deltas from the close. Users benefit from real-time VWAP calculations anchored to events, providing dynamic stop-loss suggestions to help manage exits without manual adjustments. Overall, it layers signal robustness with actionable annotations, reducing noise in fast-moving charts.
Motivation: Why this design?
Standard Supertrend indicators often generate excessive flips in choppy conditions or lag behind in low-volatility drifts, leading to whipsaws that erode confidence in trend direction. This design addresses that by centering bands around a midline that reflects recent price spreads, ensuring adjustments are proportional to observed variability. The added event layer captures regime shifts explicitly, turning abstract crossovers into labeled milestones with trailing VWAP for context, which helps traders distinguish genuine momentum from fleeting noise without over-relying on raw price action.
What’s different vs. standard approaches?
- Baseline reference: Diverges from the classic Supertrend, which uses average true range for fixed offsets from a median price.
- Architecture differences:
- Bands form around a central line averaged from smoothed highs and lows, with offsets scaled by half the range between those smooths.
- Regime direction persists until a clear breach of the prior opposite band, preventing premature reversals.
- Event visualization draws persistent lines from flip points, updating labels based on price sustainment relative to the trigger level.
- VWAP resets at each event, accumulating volume-weighted prices forward for a trailing reference.
- Practical effect: Charts show fewer direction changes overall, with color-coded annotations that evolve from initial breakout to continuation or trap status, making it easier to spot sustained moves early. VWAP lines provide a volume-informed anchor that curves with price, offering visual cues for adverse drifts.
How it works (technical)
The process starts by smoothing high and low prices over a user-defined period to form upper and lower references. A midline sits midway between them, and half the spread acts as a base for band offsets, adjusted by a multiplier to widen or narrow sensitivity. On each bar, the close is checked against the previous bar's opposite band: crossing above expands the lower band downward in uptrends, or below contracts the upper band upward in downtrends, creating a ratcheting effect that locks in direction until breached.
Persistent state tracks the current regime, seeding initial bands from the smoothed values if no prior data exists. Flips trigger new horizontal lines at the breach level, styled by direction, alongside labels that monitor sustainment—price holding above for up-flips or below for down-flips keeps the regime, while reversal flags a trap.
Separately, at each flip, a dashed VWAP line initializes at the breach price and extends forward, accumulating the product of typical prices and volumes divided by total volume. This yields a curving reference that updates bar-by-bar. Warnings activate if price strays adversely from this VWAP, tinting the background for quick alerts.
No higher timeframe data is pulled, so all computations run on the chart's native resolution, avoiding lookahead biases unless repainting is enabled via input.
Parameter Guide
SMA Length — Controls smoothing of highs and lows for midline and range base; longer values dampen noise but increase lag. Default: 20. Trade-offs: Shortens responsiveness in trends (e.g., 10–14) but risks more flips; extend to 30+ for stability in ranging markets.
Multiplier — Scales band offsets from the half-range; higher amplifies to capture bigger swings. Default: 1.0. Trade-offs: Above 1.5 widens for volatile assets, reducing false signals; below 0.8 tightens for precision but may miss subtle shifts.
Show Bands — Toggles visibility of basic and adjusted band lines for reference. Default: false. Tip: Enable briefly to verify alignment with price action.
Show Background Color — Displays red tint on VWAP adverse crosses for visual warnings. Default: false. Trade-offs: Helps in live monitoring but can clutter clean charts.
Line Width — Sets thickness for event and VWAP lines. Default: 2. Tip: Thicker (3–5) for emphasis on key levels.
+Bars after next event — Extends old lines briefly before cleanup on new flips. Default: 20. Trade-offs: Longer preserves history (40+) at resource cost; shorter keeps charts tidy.
Allow Repainting — Permits live-bar updates for smoother real-time view. Default: false. Tip: Disable for backtest accuracy.
Extension 1 Settings (Show, Width, Size, Decimals, Colors, Alpha) — Manages dotted connector from event label to current close, showing percentage change. Defaults: Shown, width 2, normal size, 2 decimals, lime/red for gains/losses, gray line, 90% transparent background. Trade-offs: Fewer decimals for clean display; adjust alpha for readability.
Extension 2 Settings (Show, Method, Stop %, Ticks, Decimals, Size, Color, Inherit, Alpha) — Positions stop label at VWAP end, offset by percent or ticks. Defaults: Shown, percent method, 1.0%, 20 ticks, 4 decimals, normal size, white text, inherit tint, 0% alpha. Trade-offs: Percent for proportional risk; ticks for fixed distance in tick-based assets.
Alert Toggles — Enables notifications for breakouts, continuations, traps, or VWAP warnings. All default: true. Tip: Layer with chart alerts for multi-condition setups.
Reading & Interpretation
The main Supertrend line colors green for up-regimes (price above lower band) and red for down (below upper band), serving as a dynamic support/resistance trail. Flip shapes (up/down triangles) mark regime changes at band breaches.
Event lines extend horizontally from flips: green for bull, red for bear. Labels start blank and update to "Bull/Bear Cont." if price sustains the direction, or "Trap" if it reverses, with colors shifting lime/red/gray accordingly. A dotted vertical links the trailing label to the current close, mid-labeled with the percentage delta (positive green, negative red).
VWAP dashes yellow (bull) or orange (bear) from the event, curving to reflect volume-weighted average. At its end, a left-aligned label shows suggested stop price, annotated with offset details. Background red hints at weakening if price crosses VWAP opposite the regime.
Deltas near zero suggest consolidation; widening extremes signal momentum buildup or exhaustion.
Practical Workflows & Combinations
- Trend following: Enter long on green flip shapes confirmed by higher highs, using the event line as initial stop below. Trail stops to VWAP for bull runs, exiting on trap labels or red background warnings. Filter with volume spikes to avoid low-conviction breaks.
- Exits/Stops: Conservative: Set hard stops at suggested SL labels. Aggressive: Hold through minor traps if delta stays positive, but cut on regime flip. Pair with momentum oscillators for overbought pullbacks.
- Multi-asset/Multi-TF: Defaults suit forex/stocks on 15m–4H; for crypto, bump multiplier to 1.5 for volatility. Scale SMA length proportionally across timeframes (e.g., double for daily). Combine with structure tools like Fibonacci for confluence on event lines.
Behavior, Constraints & Performance
Live bars update lines and labels dynamically if repainting is allowed, but signals confirm on close for stability—flips only trigger post-bar. No higher timeframe calls, so no inherent lookahead, though volume weighting assumes continuous data.
Resources cap at 1000 bars back, 50 lines/labels max; events prune old ones on new flips to stay under budget, with brief extensions for visibility. Arrays or loops absent, keeping it lightweight.
Known limits include lag in extreme gaps (e.g., overnight opens) where bands may not adjust instantly, and VWAP sensitivity to sparse volume in illiquid sessions.
Sensible Defaults & Quick Tuning
Start with SMA 20, multiplier 1.0 for balanced response across majors. For choppy pairs: Lengthen SMA to 30, multiplier 0.8 to tighten bands and cut flips. For trending equities: Shorten to 14, multiplier 1.2 for quicker entries. If traps dominate, enable bands to inspect range compression; for sluggish signals, reduce extension bars to focus on recent events.
What this indicator is—and isn’t
This serves as a visualization and signal layer for trend regimes and breakouts, highlighting sustainment via annotations and risk cues through VWAP—ideal atop price action for confirmation. It is not a standalone system, predictive oracle, or risk calculator; always integrate with broader analysis, position sizing, and stops. Use responsibly as an educational tool.
Disclaimer
The content provided, including all code and materials, is strictly for educational and informational purposes only. It is not intended as, and should not be interpreted as, financial advice, a recommendation to buy or sell any financial instrument, or an offer of any financial product or service. All strategies, tools, and examples discussed are provided for illustrative purposes to demonstrate coding techniques and the functionality of Pine Script within a trading context.
Any results from strategies or tools provided are hypothetical, and past performance is not indicative of future results. Trading and investing involve high risk, including the potential loss of principal, and may not be suitable for all individuals. Before making any trading decisions, please consult with a qualified financial professional to understand the risks involved.
By using this script, you acknowledge and agree that any trading decisions are made solely at your discretion and risk.
Do not use this indicator on Heikin-Ashi, Renko, Kagi, Point-and-Figure, or Range charts, as these chart types can produce unrealistic results for signal markers and alerts.
Best regards and happy trading
Chervolino


Bitcoin CME gaps multi-timeframe auto finder1. Overview
The Bitcoin CME Gap Multi-Timeframe Detector automatically identifies price gaps in the Bitcoin CME (Chicago Mercantile Exchange) futures market and visually displays them on the TradingView chart.
Because the CME futures market closes for about an hour after each weekday session and remains closed over the weekend, price gaps frequently appear when trading resumes on Monday.
This indicator analyzes gaps across six major timeframes, from 5-minute to 1-day charts, allowing traders to easily identify structural imbalances and potential support/resistance zones.
It is the most accurate and feature-rich CME gaps indicator available on TradingView.
2. Key Features
■ Multi-Timeframe Gap Detection
Analyzes 5m, 15m, 30m, 1h, 4h, and 1D charts simultaneously.
This enables traders to observe both short-term volatility and mid-to-long-term structure, providing a multi-dimensional view of market dynamics.
■ Gap Direction Classification
Up Gap: When the next candle’s open is higher than the previous candle’s high (default color: green tone)
Down Gap: When the next candle’s open is lower than the previous candle’s low (default color: red tone)
Gaps are color-coded to intuitively visualize potential support and resistance zones.
■ Highlight Function
Gaps exceeding a user-defined threshold (%) are highlighted (default color: yellow).
This helps quickly identify zones with abnormal volatility or sharp price dislocations.
■ Labels and Box Extension
Each gap displays a percentage label indicating its relative size and significance.
Gap zones are extended to the right as boxes, allowing traders to visually track when and how the gap gets filled over time.
■ Alert System
When a gap forms on the selected timeframe (or across all timeframes), a TradingView alert is triggered.
This enables real-time response to significant gap events.
3. Trading Strategies
■ Gap Fill Behavior
CME gaps statistically tend to get filled over time.
Gap boxes help distinguish between filled and unfilled gaps at a glance.
Up Gap: Price tends to decline to fill the previous high–next open zone.
Down Gap: Price often rises later to fill the previous low–next open zone.
■ Support & Resistance Levels
Gap zones frequently act as strong support or resistance.
When price retests a gap area, observing the reaction of buyers and sellers can provide valuable trading insights.
Overlapping gap boxes across multiple timeframes indicate high-confidence support/resistance zones.
■ Market Sentiment & Volatility Analysis
Large gaps usually result from shifts in market sentiment or major news events.
This indicator allows traders to detect volatility spikes early and prepare for potential trend reversals.
■ Combination with Other Technical Tools
While fully functional on its own, this indicator works even better when combined with tools like moving averages (MA), RSI, MACD, or Fibonacci retracements.
For example, if the bottom of a gap coincides with the 0.618 Fibonacci level, it may signal a strong rebound zone.
4. Settings Options
Minimum Gap % | Sets the minimum percentage movement required to detect a gap (lower values show smaller gaps)
Display Timeframes | Choose which timeframes to display (5m, 15m, 30m, 1h, 4h, 1D)
Box Colors | Assign colors for up and down gaps
Box Extension (Bars) | Number of bars to extend gap boxes to the right
Show Labels | Toggle display of gap percentage labels
Label Position / Size | Adjust label position and size
Highlight Gap ≥ % | Highlight gaps exceeding a specified percentage
Highlight Colors | Set highlight color for labels and boxes
Enable Alerts | Enable or disable alerts
Alert Timeframe | Select timeframe(s) for alerts (“All” = all timeframes)
5. Summary
This indicator is a professional trading tool that provides quantitative and visual analysis of price gaps in the Bitcoin CME futures market.
By combining multi-timeframe detection, highlighting, and alert systems, it helps traders clearly identify zones of market imbalance and potential reversal areas.

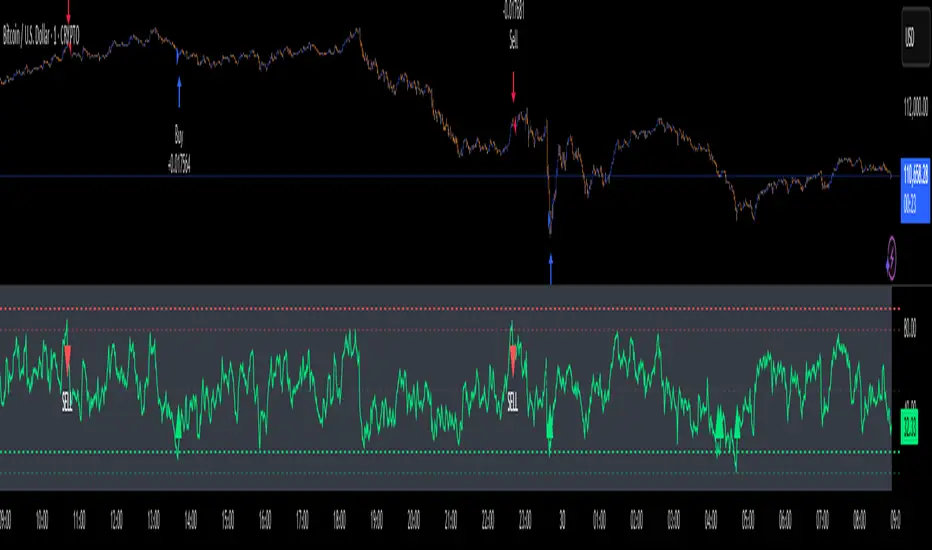
💻 RSI Dual-Band Reversal Strategy (Hacker Mode)This 💻 RSI Dual-Band Reversal Strategy (Hacker Mode) is a mean-reversion trading strategy built on the Relative Strength Index (RSI) indicator.
It identifies potential trend reversals when price momentum reaches extreme overbought or oversold levels — then enters trades expecting the price to revert.
⚙️ Strategy Concept
The RSI measures market momentum on a scale of 0–100.
When RSI is too low, it signals an oversold market → potential buy.
When RSI is too high, it signals an overbought market → potential sell.
This strategy sets two reversal zones using dual RSI bands:
Zone RSI Range Meaning Action
Upper Band 80–90 Overbought Prepare to Sell
Lower Band 10–20 Oversold Prepare to Buy
🧩 Code Breakdown
1. Input Parameters
rsiLength = input.int(14)
upperBandHigh = input.float(90.0)
upperBandLow = input.float(80.0)
lowerBandLow = input.float(10.0)
lowerBandHigh = input.float(20.0)
You can adjust:
RSI Length (default 14) → sensitivity of the RSI.
Upper/Lower Bands → control when buy/sell triggers occur.
2. RSI Calculation
rsi = ta.rsi(close, rsiLength)
Calculates the RSI of the closing price over 14 periods.
3. Signal Logic
buySignal = ta.crossover(rsi, lowerBandHigh)
sellSignal = ta.crossunder(rsi, upperBandLow)
Buy Signal: RSI crosses up through 20 → market rebounding from oversold.
Sell Signal: RSI crosses down through 80 → market turning from overbought.
4. Plotting
RSI line (lime green)
Bands:
🔴 80–90 (Sell Zone)
🟢 10–20 (Buy Zone)
Gray midline at 50 for reference.
Triangle markers for signals:
🟢 “BUY” below chart
🔴 “SELL” above chart
5. Trading Logic
if (buySignal)
strategy.entry("Buy", strategy.long)
if (sellSignal)
strategy.entry("Sell", CRYPTO:BTCUSD strategy.short OANDA:XAUUSD )
Opens a long position on a buy signal.
Opens a short position on a sell signal.
No explicit stop loss or take profit — positions reverse when an opposite signal appears.
🧠 How It Works (Step-by-Step Example)
RSI drops below 20 → oversold → buy signal triggers.
RSI rises toward 80 → overbought → sell signal triggers.
Strategy flips position, always staying in the market (either long or short).
📈 Visual Summary
Imagine the RSI line oscillating between 0 and 100:
100 ────────────────────────────────
90 ───── Upper Band High (Sell Limit)
80 ───── Upper Band Low (Sell Trigger)
50 ───── Midline
20 ───── Lower Band High (Buy Trigger)
10 ───── Lower Band Low (Buy Limit)
0 ────────────────────────────────
When RSI moves above 80 → SELL
When RSI moves below 20 → BUY
⚡ Strategy Profile
Category Description
Type Mean Reversion
Entry Rule RSI crosses up 20 → Buy
Exit/Reverse Rule RSI crosses down 80 → Sell
Strengths Simple, effective in sideways/range markets, minimal lag
Weaknesses Weak in strong trends, no stop-loss or take-profit logic
💡 Suggested Improvements
You can enhance this script by adding:
Stop loss & take profit levels (e.g., % or ATR-based).
Trend filter (e.g., trade only in direction of 200 EMA).
RSI smoothing to reduce noise.
Consecutive Gap FinderLooks for consecutive gaps based on daily chart using ATR multiplier.
Highlights them when a certain number are found.

FluidTrades - SMC Lite - AlertsThe FluidTrades - SMC Lite indicator has been fixed, now you can send notifications when price levels are indicated.


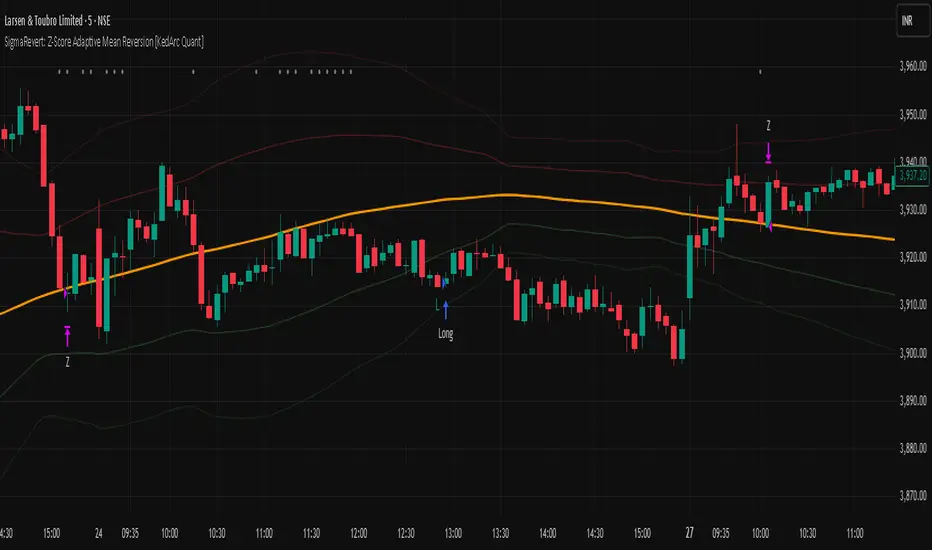
SigmaRevert: Z-Score Adaptive Mean Reversion [KedArc Quant]🔍 Overview
SigmaRevert is a clean, research-driven mean-reversion framework built on Z-Score deviation — a statistical measure of how far the current price diverges from its dynamic mean.
When price stretches too far from equilibrium (the mean), SigmaRevert identifies the statistical “sigma distance” and seeks reversion trades back toward it. Designed primarily for 5-minute intraday use, SigmaRevert automatically adapts to volatility via ATR-based scaling, optional higher-timeframe trend filters, and cooldown logic for controlled frequency
🧠 What “Sigma” Means Here
In statistics, σ (sigma) represents standard deviation, the measure of dispersion or variability.
SigmaRevert uses this concept directly:
Each bar’s price deviation from the mean is expressed as a Z-Score — the number of sigmas away from the mean.
When Z > 1.5, the price is statistically “over-extended”; when it returns toward 0, it reverts to the mean.
In short:
Sigma = Standard deviation distance
SigmaRevert = Trading the reversion of extreme sigma deviations
💡 Why Traders Use SigmaRevert
Quant-based clarity: removes emotion by relying on statistical extremes.
Volatility-adaptive: automatically adjusts to changing market noise.
Low drawdown: filters avoid over-exposure during strong trends.
Multi-market ready: works across stocks, indices, and crypto with parameter tuning.
Modular design: every component can be toggled without breaking the core logic.
🧩 Why This Is NOT a Mash-Up
Unlike “mash-up” scripts that randomly combine indicators, this strategy is built around one cohesive hypothesis:
“Price deviations from a statistically stable mean (Z-Score) tend to revert.”
Every module — ATR scaling, cooldown, HTF trend gating, exits — reinforces that single hypothesis rather than mixing unrelated systems (like RSI + MACD + EMA).
The structure is minimal yet expandable, maintaining research integrity and transparency.
⚙️ Input Configuration (Simplified Table)
Core
`maLen` 120 Lookback for mean (SMA)
`zLen` 60 Window for Z-score deviation
`zEntry` 1.5 Entry when Z exceeds threshold
`zExit` 0.3 Exit when Z normalizes
Filters (optional)
`useReCross` false Requires re-entry confirmation
`useTrend` false / true Enables HTF SMA bias
`htfTF` “60” HTF timeframe (e.g. 60-min)
`useATRDist` false Demands min distance from mean
`atrK` 1.0 ATR distance multiplier
`useCooldown` false / true Forces rest after exit
Risk
`useATRSL` false / true Adaptive stop-loss via ATR
`atrLen` 14 ATR lookback
`atrX` 1.4 ATR multiplier for stop
Session
`useSession` false Restrict to market hours
`sess` “0915-1530” NSE timing
`skipOpenBars` 0–3 Avoid early volatility
UI
`showBands` true Displays ±1σ & ±2σ
`showMarks` true Shows triggers and exits
🎯 Entry & Exit Logic
Long Entry
Trigger: `Z < -zEntry`
Optional re-cross: prior Z < −zEntry, current Z −zEntry
Optional trend bias: current close above HTF SMA
Optional ATR filter: distance from mean ATR × K
Short Entry
Trigger: `Z +zEntry`
Optional re-cross: prior Z +zEntry, current Z < +zEntry
Optional trend bias: current close below HTF SMA
Optional ATR filter: distance from mean ATR × K
Exit Conditions
Primary exit: `Z < zExit` (price normalized)
Time stop: `bars since entry timeStop`
Optional ATR stop-loss: ±ATR × multiplier
Optional cooldown: no new trade for X bars after exit
🕒 When to Use
Intraday (5m)
`maLen=120`, `zEntry=1.5`, `zExit=0.3`, `useTrend=false`, `cooldownBars=6` Capture intraday oscillations Minutes → hours
Swing (30m–1H)
`maLen=200`, `zEntry=1.8`, `zExit=0.4`, `useTrend=true`, `htfTF="D"` Mean-reversion between daily pivots 1–2 days
Positional (4H–1D)
`maLen=300`, `zEntry=2.0`, `zExit=0.5`, `useTrend=true` Capture multi-day mean reversions Days → weeks
📘 Glossary
Z-Score
Statistical measure of how far current price deviates from its mean, normalized by standard deviation.
Mean Reversion
The tendency of price to return to its average after temporary divergence.
ATR
Average True Range — measures volatility and defines adaptive stop distances.
Re-Cross
Secondary signal confirming reversal after an extreme.
HTF
Higher Timeframe — provides macro trend bias (e.g. 1-hour or daily).
Cooldown
Minimum bars to wait before re-entering after a trade closes.
❓ FAQ
Q1: Why are there no trades sometimes?
➡ Check that all filters are off. If still no trades, Z-scores might not breach the thresholds. Lower `zEntry` (1.2–1.4) to increase frequency.
Q2: Why does it sometimes fade breakouts?
➡ Mean reversion assumes overextension — disable it during strong trending days or use the HTF filter.
Q3: Can I use this for Forex or Crypto?
➡ Yes — but adjust session filters (`useSession=false`) and increase `maLen` for smoother means.
Q4: Why is profit factor so high but small overall gain?
➡ Because this script focuses on capital efficiency — low drawdown and steady scaling. Increase position size once stable.
Q5: Can I automate this on broker integration?
➡ Yes — the strategy uses standard `strategy.entry` and `strategy.exit` calls, compatible with TradingView webhooks.
🧭 How It Helps Traders
This strategy gives:
Discipline: no impulsive trades — strict statistical rules.
Consistency: removes emotional bias; same logic applies every bar.
Scalability: works across instruments and timeframes.
Transparency: all signals are derived from visible Z-Score math.
It’s ideal for quant-inclined discretionary traders who want rule-based entries but maintain human judgment for context (earnings days, macro news, etc.).
🧱 Final Notes
Best used on liquid stocks with continuous price movement.
Avoid illiquid or gap-heavy tickers.
Validate parameters per instrument — Z behavior differs between equities and indices.
Remember: Mean reversion works best in range-bound volatility, not during explosive breakouts.
⚠️ Disclaimer
This script is provided for educational purposes only.
Past performance does not guarantee future results.
Trading involves risk, and users should exercise caution and use proper risk management when applying this strategy.
Order Blocks Zones with Signals█ OVERVIEW
“Order Blocks Zones with Signals” is a technical analysis tool that automatically identifies Order Blocks (OB) and optionally Fair Value Gaps (FVG) on the chart.
The script visualizes these zones as colored rectangles, offering full customization of style, transparency, and signal display.
It also generates entry and exit signals (Break & Exit) that can serve as confirmations in strategies based on price action and market structure.
Thanks to flexible candle size filters and rich visual options, the indicator maintains chart clarity and readability.
█ CONCEPTS
Order Blocks (OB) are key zones on the chart where significant price movements previously occurred — areas where large market participants (institutions, so-called smart money) initiated or closed positions.
An OB is the last candle that followed the prior trend before the market reversed (e.g., for a Bullish OB: the last bearish candle before a pivot low and a strong upward impulse).
The script detects these levels using local price pivots, analyzing candle direction to filter out less significant movements.
FVG (Fair Value Gaps) represent areas of imbalance between buyers and sellers — price gaps formed by a sharp impulse where full trading did not occur due to one-sided order dominance (e.g., excess buy or sell orders).
Why combine OB and FVG in one indicator?
Combining OB and FVG analysis is essential because these phenomena often occur sequentially in the institutional market cycle:
1. Order Block — institutions enter the market in the OB zone, absorbing orders and building positions.
2. Strong impulse — after smart money entry, a rapid price move creates an FVG (imbalance gap).
3. Retest — price naturally returns to these zones (OB or FVG), drawn by unfilled orders and the search for equilibrium.
Such areas strongly attract price, as they represent not only historical institutional levels but also open “holes” in the order book. Retests of OB and FVG are ideal entry opportunities with high reaction probability (rebound or breakout). The indicator combines these two interconnected elements, enabling comprehensive market structure analysis in a single tool.
Order Blocks are labeled as:
Bullish OB – demand zones, often accumulation areas before an upmove.
Bearish OB – supply zones, signaling potential impulse end or correction start.
█ FEATURES
Order Block Detection (OB Detection):
- Automatic identification of demand and supply zones based on pivots.
- OB is the last candle aligned with the prior trend, just before the market reversal — precisely identified through candle sequence analysis around the pivot.
- OB zones appear with a delay equal to Pivot Length (default 10 bars).
- Break signals trigger when a candle’s body (close) fully pierces the zone, causing the zone to disappear immediately (e.g., close < low of Bullish OB → Break Down and zone deletion).
- Minimum size filtering via OB Size Multiplier.
- Option to create OB without wicks (Include Wicks in OB): when disabled, OB zones are based solely on candle bodies (open/close), ignoring wicks (high/low).
Fair Value Gap Detection (FVG Detection):
- Optional, with enable/disable capability.
- FVG are detected without delay — immediately upon gap occurrence.
- Size filtering via Candle Size Period and FVG Size Multiplier.
Customizable Styling:
- Separate colors and border styles (Solid / Dashed / Dotted) for each zone type.
- Adjustable transparency and border thickness.
- Unified color for box, border, and signal of the same type.
Breakout and Exit Signals:
- Break Up – triggered when a candle’s close breaks above a Bearish OB, causing the zone to disappear.
- Break Down – triggered when a candle’s close breaks below a Bullish OB, causing the zone to disappear.
- Exit Up / Exit Down – temporary exit from the zone without full breakout (price leaves the zone but doesn’t close beyond it). Signal type selection: Break, Exit, or Both.
- Alerts: built-in alerts for all signal types — triggered automatically on candle close confirming breakout or exit from OB.
█ HOW TO USE
Adding to chart: import the code into Pine Editor and run the script on TradingView.
Settings configuration:
- Pivot Length: controls swing detection sensitivity and OB display delay (default 10).
- Include Wicks in OB: enabled (default) – OB includes wicks; disabled – OB uses bodies only.
- Size Filter: adjust Candle Size Period and OB/FVG Size Multiplier to filter out small zones.
- Colors & Styles: set colors, styles, and transparency for each zone type.
- Signal Type: choose which signals to display (Break, Exit, or Both).
Signal interpretation:
- OB Break Up: price closes above Bearish OB → zone disappears → potential bullish continuation.
- OB Break Down: price closes below Bullish OB → zone disappears → potential bearish continuation.
- Exit Signals: price leaves the zone temporarily without breakout — often signals impending reversal or pullback.
Tips:
- Use OB signals alongside other indicators like RSI, MACD, SMI, or trend filters.
- Order Blocks from higher timeframes (e.g., 4H, 1D) carry greater significance and reaction strength.
- Remember: FVG are detected immediately, OB with delay — a complementary approach!
█ APPLICATIONS
- Smart Money Concepts (SMC): use OB zones as dynamic support and resistance levels. In an uptrend, look for buy opportunities in bullish OBs, which price often retests before further gains. Combining with RSI, MACD, or Fibonacci levels enhances zone significance, confirming institutional demand.
- Breakout Trading: trade based on OB breakout signals. A buy signal after breaking a bearish OB may indicate a strong upward impulse, especially if supported by rising MACD or RSI above 50. Similarly for sell signals after Break Down.
- Reversal Zones: Exit signals may indicate the end of a move or correction. Safest to use in alignment with higher-timeframe trend and confirmed by another indicator (e.g., RSI divergence, Fibonacci levels).
- Confluence Analysis: combine OB and FVG for deeper market structure and equilibrium insight. When an Order Block overlaps or borders an FVG, we get confluence of two institutional phenomena — OB (smart money entry) + FVG (imbalance) — making these areas particularly strong price magnets, increasing retest and reaction probability.
█ NOTES
- FVG can be fully disabled for a cleaner chart view.
- In consolidation periods, signals may appear more frequently — always confirm with additional trend filters.
- Works on all markets and timeframes (crypto, forex, indices, stocks).

Candle Breakout StrategyShort description (one-liner)
Candle Breakout Strategy — identifies a user-specified candle (UTC time), draws its high/low range, then enters on breakouts with configurable stop-loss, take-profit (via Risk:Reward) and optional alerts.
Full description (ready-to-paste)
Candle Breakout Strategy
Version 1.0 — Strategy script (Pine v5)
Overview
The Candle Breakout Strategy automatically captures a single "range candle" at a user-specified UTC time, draws its high/low as a visible box and dashed level lines, and waits for a breakout. When price closes above the range high it enters a Long; when price closes below the range low it enters a Short. Stop-loss is placed at the opposite range boundary and take-profit is calculated with a user-configurable Risk:Reward multiplier. Alerts for entries can be enabled.
This strategy is intended for breakout style trading where a clearly defined intraday range is established at a fixed time. It is simple, transparent and easy to adapt to multiple symbols and timeframes.
How it works (step-by-step)
On every bar the script checks the current UTC time.
When the first bar that matches the configured Target Hour:Target Minute (UTC) appears, the script records that candle’s high and low. This defines the breakout range.
A box and dashed lines are drawn on the chart to display the range and extended to the right while the range is active.
The script then waits for price to close outside the box:
Close > Range High → Long entry
Close < Range Low → Short entry
When an entry triggers:
Stop-loss = opposite range boundary (range low for longs, range high for shorts).
Take-profit = entry ± (risk × Risk:Reward). Risk is computed as the distance between entry price and stop-loss.
After entry the range becomes inactive (waitingForBreakout = false) until the next configured target time.
Inputs / Parameters
Target Hour (UTC) — the hour (0–23) in UTC when the range candle is detected.
Target Minute — minute (0–59) of the target candle.
Risk:Reward Ratio — multiplier for computing take profit from risk (0.5–10). Example: 2 means TP = entry + 2×risk.
Enable Alerts — turn on/off entry alerts (string message sent once per bar when an entry occurs).
Show Last Box Only (internal behavior) — when enabled the previous box is deleted at the next range creation so only the most recent range is visible (default behavior in the script).
Visuals & On-chart Info
A semi-transparent blue box shows the recorded range and extends to the right while active.
Dashed horizontal lines mark the range high and low.
On-chart shapes: green triangle below bar for Long signals, red triangle above bar for Short signals.
An information table (top-right) displays:
Target Time (UTC)
Active Range (Yes / No)
Range High
Range Low
Risk:Reward
Alerts
If Enable Alerts is on, the script sends an alert with the following formats when an entry occurs:
Long alert:
🟢 LONG SIGNAL
Entry Price:
Stop Loss:
Take Profit:
Short alert:
🔴 SHORT SIGNAL
Entry Price:
Stop Loss:
Take Profit:
Use TradingView's alert dialog to create alerts based on the script — select the script’s alert condition or use the alert() messages.
Recommended usage & tips
Timeframe: This strategy works on any timeframe but the definition of "candle at target time" depends on the chart timeframe. For intraday breakout styles, use 1m — 60m charts depending on the session you want to capture.
Target Time: Choose a time that is meaningful for the instrument (e.g., market open, economic release, session overlap). All times are handled in UTC.
Position Sizing: The script’s example uses strategy.percent_of_equity with 100% default — change default_qty_value or strategy settings to suit your risk management.
Filtering: Consider combining this breakout with trend filters (EMA, ADX, etc.) to reduce false breakouts.
Backtesting: Always backtest over a sufficiently large and recent sample. Pay attention to slippage and commission settings in TradingView’s strategy tester.
Known behavior & limitations
The script registers the breakout on close outside the recorded range. If you prefer intrabar breakout rules (e.g., high/low breach without close), you must adjust the condition accordingly.
The recorded range is taken from a single candle at the exact configured UTC time. If there are missing bars or the chart timeframe doesn't align, the intended candle may differ — choose the target time and chart timeframe consistently.
Only a single active position is allowed at a time (the script checks strategy.position_size == 0 before entries).
Example setups
EURUSD (Forex): Target Time 07:00 UTC — captures London open range.
Nifty / Index: Target Time 09:15 UTC — captures local session open range.
Crypto: Target Time 00:00 UTC — captures daily reset candle for breakout.
Risk disclaimer
This script is educational and provided as-is. Past performance is not indicative of future results. Use proper risk management, test on historical data, and consider slippage and commissions. Do not trade real capital without sufficient testing.
Change log
v1.0 — Initial release: range capture, box and level drawing, long/short entry by close breakout, SL at opposite boundary, TP via Risk:Reward, alerts, info table.
If you want, I can also:
Provide a short README version (2–3 lines) for the TradingView “Short description” field.
Add a couple of suggested alert templates for the TradingView alert dialog (if you want alerts that include variable placeholders).
Convert the disclaimer into multiple language versions.

Uptrick: Volume Weighted BandsIntroduction
This indicator, Uptrick: Volume Weighted Bands, overlays dynamic, volume-informed trend channels directly on the chart. By fusing price and volume data through volume-weighted and exponential moving averages, the script forms a core trend line with adaptive bandwidth controlled by volatility. It is designed to help traders identify trend direction, breakout entries, and extended conditions that may warrant take-profits or pullback re-entries.
Overview
The Volume Weighted Bands system is built around a trend line calculated by averaging a Volume Weighted Moving Average (VWMA) and an Exponential Moving Average (EMA), both over a configurable lookback period. This hybrid trend baseline is then smoothed further and expanded into dynamic upper and lower bands using an Average True Range (ATR) multiplier. These bands adapt with market volatility and shift color based on prevailing price action, helping traders quickly identify bullish, bearish, or neutral conditions.
Originality and Unique Features
This script introduces originality by blending both price and volume in the core trend calculation, a technique that is more responsive than traditional moving average bands. Its multi-mode visualization (cloud, single-band, or line-only), combined with selective buy/sell signals, makes it flexible for discretionary and algorithmic strategies alike. Optional modules for take-profit signals based on z-score deviation and RSI slope, as well as buy-back detection logic with cooldown filters, offer practical tools for managing trades beyond simple entries.
Explanation of Inputs
Every user input in this script is included to give the trader control over behavior and visual presentation:
Trend Length (len): Defines the lookback window for both the VWMA and EMA, controlling the sensitivity of the core trend baseline. A lower value makes the bands more reactive, while a higher value smooths out short-term noise.
Extra Smoothing (smoothLen): Applies an additional EMA to the blended VWMA/EMA average. This second-level smoothing ensures the central trend line reacts gradually to shifts in price.
Band Width (ATR Multiplier) (bandMult): Multiplies the ATR to create the width of the upper and lower bands around the trend line. Larger values widen the bands, capturing more volatility, while smaller values narrow them.
ATR Length (atrLen): Sets the length of the ATR used in calculating band width and signal offsets. Longer values produce smoother band boundaries.
Show Buy/Sell Signals (showSignals): Toggles the primary crossover/crossunder entry signals, which are labeled when the close crosses the upper or lower band.
Visual Mode (visualMode): Allows selection between three display modes:
--> Cloud: Shows both bands and the central trend line with a shaded background.
--> Single Band: Displays only the active (upper or lower) band depending on trend state, with gradient fill to price.
--> Line Only: Shows only the trend line for a minimal visual profile.
Take Profit Signals (enableTP): Enables a z-score-based profit-taking signal system. Signals occur when price deviates significantly from the trend line and RSI confirms exhaustion.
TP Z-Score Threshold (tpThreshold): Sets the z-score deviation required to trigger a take-profit signal. Higher values reduce the frequency of signals, focusing on more extreme moves.
Re-Entries (enableBuyBack): Enables logic to signal when price reverts into the band after an initial breakout, suggesting a possible re-entry or pullback setup.
Buy Back Cooldown (bars) (buyBackCooldown): Defines a minimum bar count before a new buy-back signal is allowed, preventing rapid retriggering in choppy conditions.
Buy Offset and Sell Offset: Hidden inputs used to vertically adjust the placement of the Buy ("𝓤𝓹") and Sell ("𝓓𝓸𝔀𝓷") labels relative to the bands. These use ATR units to maintain proportionality across different instruments and timeframes.
Take-Profit Signal Module
The take-profit module uses a z-score of the distance between price and the trend line to detect extended conditions. In bullish trends, a signal appears when price is well above the band and RSI indicates exhaustion; the opposite applies for bearish conditions. A boolean flag is used to prevent retriggering until RSI resets. These signals are plotted with minimalist “X” markers near recent highs or lows, based on whether the market is extended upward or downward.
Re-Entry Logic
The re-entry system identifies instances where price momentarily dips or spikes into the opposite band but closes back inside, implying a continuation of the prevailing trend. This module can be particularly useful for traders managing entries after brief pullbacks. A built-in cooldown period helps filter out noise and prevents signal overloading during fast markets. Visual markers are shown as upward or downward arrows near the relevant candle wicks.
How to Use This Indicator
The basic usage of this indicator follows a directional, signal-driven approach. When a buy signal appears, it suggests entering a long position. The recommended stop loss placement is below the lower band, allowing for some breathing space to accommodate natural volatility. As the position progresses, take partial profits—typically 10% to 15% of the position—each time a take-profit signal (marked with an "X") is shown on the chart.
An optional feature is the buy-back signal, which can be used to re-enter after partial exits or missed entries. Utilizing this can help reduce losses during false breakouts or trend reversals by scaling in more gradually. However, it also means that in strong, clean trends, the full position may not be captured from the start, potentially reducing the total return. It is up to the trader to decide whether to enter fully on the initial signal or incrementally using buy-backs.
When a sell signal appears, the strategy advises fully exiting any long positions and immediately switching to a short position. The short trade follows the same logic: place your stop loss above the upper band with some margin, and again, take partial profits at each take-profit signal.
Visual Presentation and Signal Labels
All signals are plotted with clean, minimal labels that avoid clutter, and are color-coded using a custom palette designed to remain clear across light and dark chart themes. Bullish trends are marked in teal and bearish trends in magenta. Candles and wicks are also colored accordingly to align price action with the detected trend state. Buy and sell entries are marked with "𝓤𝓹" and "𝓓𝓸𝔀𝓷" labels.
Summary
In summary, the Uptrick: Volume Weighted Bands indicator provides a versatile, visually adaptive trend and volatility tool that can serve multiple styles of trading. Through its integration of price, volume, and volatility, along with modular take-profit and buy-back signaling, it aims to provide actionable structure across a range of market conditions.
Disclaimer
This indicator is for educational purposes only. Trading involves risk, and past performance does not guarantee future results. Always test strategies before applying them in live markets.

Trend scalping ROVTradingOnly trading with bullish or bearish trend. Working fine at m5 and m15 time frame

Nqaba Probable High/Low{Larry Method}The Probable High/Low indicator is an advanced tool inspired by Larry R. Williams’ original projection formulas.
It calculates probable daily highs and lows based on the prior day’s open, high, low, and close, allowing traders to anticipate key intraday price levels with precision.
This version provides full control over visibility, styling, and historical analysis — making it both educational and powerful for active traders.

ATR x Trend x Volume SignalsATR x Trend x Volume Signals is a multi-factor indicator that combines volatility, trend, and volume analysis into one adaptive framework. It is designed for traders who use technical confluence and prefer clear, rule-based setups.
🎯 Purpose
This tool identifies high-probability market moments when volatility structure (ATR), momentum direction (CCI-based trend logic), and volume expansion all align. It helps filter out noise and focus on clean, actionable trade conditions.
⚙️ Structure
The indicator consists of three main analytical layers:
1️⃣ ATR Trailing Stop – calculates two adaptive ATR lines (fast and slow) that define volatility context, trend bias, and potential reversal points.
2️⃣ Trend Indicator (CCI + ATR) – uses a CCI-based logic combined with ATR smoothing to determine the dominant trend direction and reduce false flips.
3️⃣ Volume Analysis – evaluates volume deviations from their historical average using standard deviation. Bars are highlighted as medium, high, or extra-high volume depending on intensity.
💡 Signal Logic
A Buy Signal (green) appears when all of the following are true:
• The ATR (slow) line is green.
• The Trend Indicator is blue.
• A bullish candle closes above both the ATR (slow) and the Trend Indicator.
• The candle shows medium, high, or extra-high volume.
A Sell Signal (red) appears when:
• The ATR (slow) line is red.
• The Trend Indicator is red.
• A bearish candle closes below both the ATR (slow) and the Trend Indicator.
• The candle shows medium, high, or extra-high volume.
Only one signal can appear per ATR trend phase. A new signal is generated only after the ATR direction changes.
❌ Exit Logic
Exit markers are shown when price crosses the slow ATR line. This behavior simulates a trailing stop exit. The exit is triggered one bar after entry to prevent same-bar exits.
⏰ Session Filter
Signals are generated only between the user-defined session start and end times (default: 14:00–18:00 chart time). This allows the trader to limit signal generation to active trading hours.
💬 Practical Use
It is recommended to trade with a fixed risk-reward ratio such as 1 : 1.5. Stop-loss placement should be beyond the slow ATR line and adjusted gradually as the trade develops.
For better confirmation, the Trend Indicator timeframe should be higher than the chart timeframe (for example: trading on 1 min → set Trend Indicator timeframe to 15 min; trading on 5 min → set to 1 hour).
🧠 Main Features
• Dual ATR volatility structure (fast and slow)
• CCI-based trend direction filtering
• Volume deviation heatmap logic
• Time-restricted signal generation
• Dynamic trailing-stop exit system
• Non-repainting logic
• Fully optimized for Pine Script v6
📊 Usage Tip
Best results are achieved when combining this indicator with additional technical context such as support-resistance, higher-timeframe confirmation, or market structure analysis.
📈 Credits
Inspired by:
• ATR Trailing Stop by Ceyhun
• Trend Magic by Kivanc Ozbilgic
• Heatmap Volume by xdecow

OPADA//@version=5
indicator("Buy/Sell Zones – TV Style", overlay=true, timeframe="", timeframe_gaps=true)
//=====================
// الإعدادات
//=====================
len = input.int(100, "Length", minval=10)
useATR = input.bool(true, "Use ATR (بدل الانحراف المعياري)")
mult = input.float(2.0, "Band Multiplier", step=0.1)
useRSI = input.bool(true, "تفعيل فلتر RSI")
rsiOB = input.int(70, "RSI Overbought", minval=50, maxval=90)
rsiOS = input.int(30, "RSI Oversold", minval=10, maxval=50)
//=====================
// القناة: أساس + انحراف
//=====================
basis = ta.linreg(close, len, 0)
off = useATR ? ta.atr(len) * mult : ta.stdev(close, len) * mult
upper = basis + off
lower = basis - off
// نطاق علوي/سفلي بعيد لعمل تعبئة المناطق
lookback = math.min(bar_index, 500)
topBand = ta.highest(high, lookback) + 50 * syminfo.mintick
bottomBand = ta.lowest(low, lookback) - 50 * syminfo.mintick
//=====================
// الرسم
//=====================
pUpper = plot(upper, "Upper", color=color.new(color.blue, 0), linewidth=1)
pLower = plot(lower, "Lower", color=color.new(color.red, 0), linewidth=1)
pBasis = plot(basis, "Basis", color=color.new(color.gray, 60), linewidth=2)
// تعبئة المناطق: فوق القناة (أزرق)، تحت القناة (أحمر)
pTop = plot(topBand, display=display.none)
pBottom = plot(bottomBand, display=display.none)
fill(pUpper, pTop, color=color.new(color.blue, 80)) // منطقة مقاومة/بيع
fill(pBottom, pLower, color=color.new(color.red, 80)) // منطقة دعم/شراء
//=====================
// خط أفقي من قمّة قريبة (يمثل مقاومة) – قريب من الخط المنقّط في الصورة
//=====================
resLen = math.round(len * 0.6)
dynRes = ta.highest(high, resLen)
plot(dynRes, "Recent Resistance", color=color.new(color.white, 0), linewidth=1)
//=====================
// إشارات BUY / SELL + فلتر RSI (اختياري)
//=====================
rsi = ta.rsi(close, 14)
touchLower = ta.crossover(close, lower) or close <= lower
touchUpper = ta.crossunder(close, upper) or close >= upper
buyOK = useRSI ? (touchLower and rsi <= rsiOS) : touchLower
sellOK = useRSI ? (touchUpper and rsi >= rsiOB) : touchUpper
plotshape(buyOK, title="BUY", location=location.belowbar, style=shape.labelup,
text="BUY", color=color.new(color.green, 0), textcolor=color.white, size=size.tiny, offset=0)
plotshape(sellOK, title="SELL", location=location.abovebar, style=shape.labeldown,
text="SELL", color=color.new(color.red, 0), textcolor=color.white, size=size.tiny, offset=0)
// تنبيهات
alertcondition(buyOK, title="BUY", message="BUY signal: price touched/closed below lower band (RSI filter may apply).")
alertcondition(sellOK, title="SELL", message="SELL signal: price touched/closed above upper band (RSI filter may apply).")

Structure Labels ( HH / HL / LH / LL )Here’s a clean and efficient Pine Script (v5) code that automatically detects and labels Higher Highs ( HH ), Lower Highs ( LH ), Higher Lows ( HL ), and Lower Lows ( LL ) on your TradingView chart .

