Advanced Trend Momentum [Alpha Extract]The Advanced Trend Momentum indicator provides traders with deep insights into market dynamics by combining exponential moving average analysis with RSI momentum assessment and dynamic support/resistance detection. This sophisticated multi-dimensional tool helps identify trend changes, momentum divergences, and key structural levels, offering actionable buy and sell signals based on trend strength and momentum convergence.
🔶 CALCULATION
The indicator processes market data through multiple analytical methods:
Dual EMA Analysis: Calculates fast and slow exponential moving averages with dynamic trend direction assessment and ATR-normalized strength measurement.
RSI Momentum Engine: Implements RSI-based momentum analysis with enhanced overbought/oversold detection and momentum velocity calculations.
Pivot-Based Structure: Identifies and tracks dynamic support and resistance levels using pivot point analysis with configurable level management.
Signal Integration: Combines trend direction, momentum characteristics, and structural proximity to generate high-probability trading signals.
Formula:
Fast EMA = EMA(Close, Fast Length)
Slow EMA = EMA(Close, Slow Length)
Trend Direction = Fast EMA > Slow EMA ? 1 : -1
Trend Strength = |Fast EMA - Slow EMA| / ATR(Period) × 100
RSI Momentum = RSI(Close, RSI Length)
Momentum Value = Change(Close, 5) / ATR(10) × 100
Pivot Support/Resistance = Dynamic pivot arrays with configurable lookback periods
Bullish Signal = Trend Change + Momentum Confirmation + Strength > 1%
Bearish Signal = Trend Change + Momentum Confirmation + Strength > 1%
🔶 DETAILS
Visual Features:
Trend EMAs: Fast and slow exponential moving averages with dynamic color coding (bullish/bearish)
Enhanced RSI: RSI oscillator with color-coded zones, gradient fills, and reference bands at overbought/oversold levels
Trend Fill: Dynamic gradient between EMAs indicating trend strength and direction
Support/Resistance Lines: Horizontal levels extending from pivot-based calculations with configurable maximum levels
Momentum Candles: Color-coded candlestick overlay reflecting combined trend and momentum conditions
Divergence Markers: Diamond-shaped signals highlighting bullish and bearish momentum divergences
Analysis Table: Real-time summary of trend direction, strength percentage, RSI value, and momentum reading
Interpretation:
Trend Direction: Bullish when Fast EMA crosses above Slow EMA with strength confirmation
Trend Strength > 1%: Strong trending conditions with institutional participation
RSI > 70: Overbought conditions, potential selling opportunity
RSI < 30: Oversold conditions, potential buying opportunity
Momentum Divergence: Price and momentum moving opposite directions signal potential reversals
Support/Resistance Proximity: Dynamic levels provide optimal entry/exit zones
Combined Signals: Trend changes with momentum confirmation generate high-probability opportunities
🔶 EXAMPLES
Trend Confirmation: Fast EMA crossing above Slow EMA with trend strength exceeding 1% and positive momentum confirms strong bullish conditions.
Example: During institutional accumulation phases, EMA crossovers with momentum confirmation have historically preceded significant upward moves, providing optimal long entry points.
15min
4H
Momentum Divergence Detection: RSI reaching overbought levels while momentum decreases despite rising prices signals potential trend exhaustion.
Example: Bearish divergence signals appearing at resistance levels have marked major market tops, allowing traders to secure profits before corrections.
Support/Resistance Integration: Dynamic pivot-based levels combined with trend and momentum signals create high-probability trading zones.
Example: Bullish trend changes occurring near established support levels offer optimal risk-reward entries with clearly defined stop-loss levels.
Multi-Dimensional Confirmation: The indicator's combination of trend, momentum, and structural analysis provides comprehensive market validation.
Example: When trend direction aligns with momentum characteristics near key structural levels, the confluence creates institutional-grade trading opportunities with enhanced probability of success.
🔶 SETTINGS
Customization Options:
Trend Analysis: Fast EMA Length (default: 12), Slow EMA Length (default: 26), Trend Strength Period (default: 14)
Support & Resistance: Pivot Length for level detection (default: 10), Maximum S/R Levels displayed (default: 3), Toggle S/R visibility
Momentum Settings: RSI Length (default: 14), Oversold Level (default: 30), Overbought Level (default: 70)
Visual Configuration: Color schemes for bullish/bearish/neutral conditions, transparency settings for fills, momentum candle overlay toggle
Display Options: Analysis table visibility, divergence marker size, alert system configuration
The Advanced Trend Momentum indicator provides traders with comprehensive insights into market dynamics through its sophisticated integration of trend analysis, momentum assessment, and structural level detection. By combining multiple analytical dimensions into a unified framework, this tool helps identify high-probability opportunities while filtering out market noise through its multi-confirmation approach, enabling traders to make informed decisions across various market cycles and timeframes.
Indicatori e strategie


Smart Money SignalsSmart Money Signals – Market Flow & Structure Visualizer
Overview
Smart Money Signals is a precision trading tool designed for traders who want to see market structure and momentum flow in real time. By detecting pivots, momentum imbalances, and dynamic support/resistance levels, the indicator transforms raw price action into a clear visual narrative of where capital is entering and exiting the market.
Instead of lagging averages or cluttered signals, Smart Money Signals highlights the moments that matter most—where bullish and bearish flows are confirmed, where support or resistance breaks, and where momentum zones show the true battleground between buyers and sellers. Its adaptive design makes it equally effective for scalpers seeking sharp entries, swing traders tracking reversals, and longer-term traders looking for confirmation of bias.
How It Works
The engine behind Smart Money Signals relies on swing detection and a configurable sensitivity filter. By monitoring directional momentum across recent bars, the system identifies bullish pivots (where downside exhaustion flips into strength) and bearish pivots (where upward thrust collapses into weakness).
When price confirms a pivot, the indicator draws flow lines to mark the breakout and labels them as either continuation or reversal events, depending on existing market bias. Momentum zones are automatically plotted, highlighting the critical areas where buyers defended price or sellers pressed it lower.
Dynamic support and resistance levels extend forward in time, updating live as price develops. These zones change color when broken, visually signaling whether structure has held or failed. Gradient background shading further emphasizes moments of extreme momentum, such as overbought or oversold surges, so that traders instantly see when market pressure intensifies.
Signals and Market Flows
Smart Money Signals provides visual cues that are both intuitive and actionable:
📈 Bullish Flow Signals appear when price breaks above a confirmed pivot, signaling continuation or reversal into strength.
📉 Bearish Flow Signals appear when price breaks below a confirmed pivot, indicating continuation or reversal into weakness.
Momentum Zones highlight the defended areas between pivots, giving traders a visual map of where structure is strongest.
Dynamic Support & Resistance lines extend across the chart, shifting from defense to failure when broken, ensuring that the most relevant levels are always visible.
Break Signals mark the exact bar where key levels give way, confirming structural violations in real time.
By filtering out noise and focusing on meaningful flow events, the system helps traders avoid overreaction and focus only on high-probability structural shifts.
Strategy Integration
Smart Money Signals is versatile across trading styles:
Trend Continuation : Enter in the direction of flow signals, using dynamic zones as both confirmation and stop-loss placement.
Reversal Trading : Watch for pivots tagged as reversal points, where market bias flips and new structure is created.
Momentum Zone Entries : Use the automatically drawn zones to identify low-risk entries on pullbacks or retests.
Bias Alignment : The integrated dashboard reveals the current market bias—bullish, bearish, or neutral—helping traders stay aligned with the dominant flow.
Stop-losses can be positioned beyond the dynamic zone on the opposite side, while take-profits may be guided by the width of zones or momentum-driven extensions. On higher timeframes, the indicator provides context for macro structure, while lower timeframes allow for tactical entry refinement.
Advanced Techniques
Traders seeking deeper precision can combine Smart Money Signals with volume or order flow tools to validate pivots and zone defenses. Monitoring the sequence of bullish and bearish flows helps identify trend maturity, while analyzing the success rate of pivots in the analytics panel builds a data-driven approach to confidence in signals.
Adjusting swing period and sensitivity allows the indicator to adapt to different market conditions, from volatile crypto pairs to steady forex majors. The flexible visual themes—Cyber, Ocean, Sunset, Matrix—ensure readability across setups, while gradient shading keeps the chart intuitive even under fast-moving conditions.
Why Use Smart Money Signals
Markets are driven by liquidity, momentum, and structure. Smart Money Signals uncovers these forces by translating price action into a clear visual map of flow. It shows:
Where structure was built.
Where it was defended.
Where it was broken.
And where momentum is likely to carry next.
By combining flow detection, dynamic zones, and a live analytics dashboard, the indicator provides traders with a complete framework for reading price action in real time.
Whether you trade crypto, forex, or indices, Smart Money Signals adapts seamlessly to any asset class, giving you clarity, precision, and confidence to execute without second-guessing.

Sweep2Trade Pro [CHE]Sweep2Trade Pro \ — Liquidity Sweep → Trend → Confirmation
Sweep2Trade Pro \ helps you catch high-probability reversals or continuations that start with a liquidity sweep, align with the T3 trend, and finalize with a structure confirmation (BOS). It’s designed to reduce noise, time your entries, and keep you out of weak, chop-driven signals.
What’s a “sweep”?
A liquidity sweep happens when price briefly breaks a prior swing high/low (where many stops sit), triggers those stops, and then snaps back. This “stop-hunt” creates liquidity for bigger players and often precedes a sharp move in the opposite direction if the break fails, or fuels continuation if structure actually shifts.
What’s a BOS (Break of Structure)?
A BOS is a price action event where the market takes out a recent swing level in the trend’s direction, signaling continuation and confirming that structure has shifted (bullish BOS through a recent swing high, bearish BOS through a recent swing low).
How the indicator works (at a glance)
1. Regime Filter (T3 + R²)
T3 Moving Average: A smoother, faster-responding moving average that aims to reduce lag while filtering noise, so trend direction changes are clearer.
R² (Coefficient of Determination): Measures how “linear” the recent price path is (0→1). Higher values = stronger, cleaner trend; lower values = more chop. Used here to allow trades only when trend quality exceeds a user-set threshold.
2. Sweep Detection
Bullish sweep: price pokes below a prior swing low and closes back above it.
Bearish sweep: price pokes above a prior swing high and closes back below it.
Lookback length is configurable.
3. Sequence Lock (built-in FSM)
The script manages state in phases so you don’t jump the gun:
Phase 1: Sweep detected → wait for T3 to turn in the corresponding direction.
Phase 2: T3 direction confirmed → show “SWEEP OK” and wait for final confirmation.
Trade Signal: Only fires if confirmation arrives before a timeout.
4. Confirmation Layer
BOS via wick or close (you choose),
Strong close toward the signal (top/bottom quartile of the candle),
Optional “close above/below T3” condition.
These checks help avoid weak sweeps that immediately fade.
5. Alerts & Visuals
“SWEEP OK” markers show when the sweep + T3 direction align.
Final BUY/SELL arrows appear only when the confirmation layer passes.
Ready-made alert conditions for automation.
What you can do with it
Time reversals after sweeps: Enter when a stop-hunt fades and structure confirms.
Ride continuations: Use BOS with the T3 trend to pyramid or re-enter with structure on your side.
Filter chop: Let R² gate entries to periods with cleaner directional drift.
Automate: Use the included alerts with your platform or webhook setup.
Inputs (key settings)
Regime Filter
T3 Length / Volume Factor: Controls smoothness and responsiveness. Smaller length → faster, more sensitive; higher volume factor → smoother curve.
R² Lookback & Threshold: Length of the linear fit window and the minimum “trend quality” required. Higher thresholds mean fewer, cleaner signals.
Sweep / Sequence
Swing Lookback: How far back to define the “reference” high/low for sweeps.
Timeout: Maximum bars allowed between phases to keep signals fresh.
Restart timeout on Phase 2: Optional safety so entries don’t go stale.
Confirmation
BOS Lookback: Micro-pivot window for structure breaks.
Wick vs Close BOS: Conservative traders may prefer close.
Require close above/below T3: Tightens confirmation with trend alignment.
Practical guide (quick start)
1. Timeframe & markets: Works across majors, indices, and crypto. Start with 5m–1h intraday or 1h–4h swing; adjust R² threshold upward on noisier pairs.
2. Entry recipe (Long):
Bullish sweep of a prior low → T3 turns up → BOS/strong close.
Optional: enable “close above T3” for extra confirmation.
3. Entry recipe (Short): Mirror the above.
4. Stops: Common choices are just beyond the sweep wick (tighter) or past the BOS invalidation (safer).
5. Targets: Previous structural levels, measured move, or a T3 trail (exit when price closes back through T3).
6. Avoid low-quality contexts: If R² is very low, market is likely ranging erratically—skip or widen filters.
Tips & best practices
Context first: The same sweep means different things in a strong trend vs. flat regime; that’s why the T3+R² filter exists.
BOS choice: Wick-based BOS is earlier but noisier; close-based BOS is slower but cleaner. Tune per market.
Backtest -> Forward test: Validate settings per symbol/timeframe; then paper trade before going live.
Risk: Fixed fractional risk with asymmetric R\:R (e.g., 1:1.5–1:3) generally performs better than “all-in” discretionary sizing.
Behind the scenes (for the curious)
T3 is a multi-stage EMA construction that produces a smooth curve with reduced lag versus simple/standard EMAs.
R² is the square of correlation (0–1). Here it’s used as a moving gauge of how well price aligns to a linear path—our “trend quality” dial.
Stop-hunts / sweeps are a recognized microstructure phenomenon where clustered stops provide the liquidity that fuels the next move.
Disclaimer
No indicator guarantees profits. Sweep2Trade Pro \ is a decision aid; always combine with solid risk management and your own judgment. Backtest, forward test, and size responsibly.
The content provided, including all code and materials, is strictly for educational and informational purposes only. It is not intended as, and should not be interpreted as, financial advice, a recommendation to buy or sell any financial instrument, or an offer of any financial product or service. All strategies, tools, and examples discussed are provided for illustrative purposes to demonstrate coding techniques and the functionality of Pine Script within a trading context.
Any results from strategies or tools provided are hypothetical, and past performance is not indicative of future results. Trading and investing involve high risk, including the potential loss of principal, and may not be suitable for all individuals. Before making any trading decisions, please consult with a qualified financial professional to understand the risks involved.
By using this script, you acknowledge and agree that any trading decisions are made solely at your discretion and risk.
Enhance your trading precision and confidence 🚀
Happy trading
Chervolino

[blackcat] L1 Value Trend IndicatorOVERVIEW
The L1 Value Trend Indicator is a sophisticated technical analysis tool designed for TradingView users seeking advanced market trend identification and trading signals. This comprehensive indicator combines multiple analytical techniques to provide traders with a holistic view of market dynamics, helping identify potential entry and exit points through various signal mechanisms. 📈 It features a main Value Trend line along with a lagged version, golden cross and dead cross signals, and multiple technical indicators including RSI, Williams %R, Stochastic %K/D, and Relative Strength calculations. The indicator also includes reference levels for support and resistance analysis, making it a versatile tool for both short-term and long-term trading strategies. ✅
FEATURES
📈 Primary Value Trend Line: Calculates a smoothed value trend using a combination of SMA and custom smoothing techniques
🔍 Value Trend Lag: Implements a lagged version of the main trend line for cross-over analysis
🚀 Golden Cross & Dead Cross Signals: Identifies buy/sell opportunities when the main trend line crosses its lagged version
💸 Multi-Indicator Integration: Combines multiple technical analysis tools for comprehensive market view
📊 RSI Calculations: Includes 6-period, 7-period, and 13-period RSI calculations for momentum analysis
📈 Williams %R: Provides overbought/oversold conditions using the Williams %R formula
📉 Stochastic Oscillator: Implements both Stochastic %K and %D calculations for momentum confirmation
📋 Relative Strength: Calculates relative strength based on highest highs and current price
✅ Visual Labels: Displays BUY and SELL labels on chart when crossover conditions are met
📣 Alert Conditions: Provides automated alert conditions for golden cross and dead cross events
📌 Reference Levels: Plots entry (25) and exit (75) reference lines for support/resistance analysis
HOW TO USE
Copy the Script: Copy the complete Pine Script code from the original file
Open TradingView: Navigate to TradingView website or application
Access Pine Editor: Go to the Pine Script editor (usually found in the chart toolbar)
Paste Code: Paste the copied script into the editor
Save Script: Save the script with a descriptive name like " L1 Value Trend Indicator"
Select Chart: Choose the chart where you want to apply the indicator
Add Indicator: Apply the indicator to your chart
Configure Parameters: Adjust input parameters to customize behavior
Monitor Signals: Watch for golden cross (BUY) and dead cross (SELL) signals
Use Reference Levels: Monitor entry (25) and exit (75) lines for support/resistance levels
LIMITATIONS
⚠️ Potential Repainting: The script may repaint due to lookahead bias in some calculations
📉 Lookahead Bias: Some calculations may reference future values, potentially causing repainting issues
🔄 Parameter Sensitivity: Results may vary significantly with different parameter settings
📉 Computational Complexity: May impact chart performance with heavy calculations on large datasets
📊 Resource Usage: Requires significant processing power for multiple indicator calculations
🔄 Data Sensitivity: Results may be affected by data quality and market conditions
NOTES
📈 Signal Timing: Cross-over signals may lag behind actual price movements
📉 Parameter Optimization: Optimal parameters may vary by market conditions and asset type
📋 Market Conditions: Performance may vary significantly across different market environments
📈 Multi-Indicator: Combine signals with other technical indicators for confirmation
📉 Timeframe Analysis: Use multiple timeframes for enhanced signal accuracy
📋 Volume Analysis: Incorporate volume data for additional confirmation
📈 Strategy Integration: Consider using this indicator as part of a broader trading strategy
📉 Risk Management: Use signals as part of a comprehensive risk management approach
📋 Backtesting: Test parameter combinations with historical data before live trading
THANKS
🙏 Original Creator: blackcat1402 creates the L1 Value Trend Indicator
📚 Community Contributions: Recognition to TradingView community for continuous improvements and contributions
📈 Collaborative Development: Appreciation for collaborative efforts in enhancing technical analysis tools
📉 TradingView Community: Special thanks to TradingView community members for their ongoing support and feedback
📋 Educational Resources: Recognition of educational resources that helped in understanding technical analysis principles

DTC FX+DTC FX+
All in One Indicator for Forex Markets
A comprehensive FX session indicator designed to help traders identify and analyze different trading sessions throughout the day.
This indicator provides real-time detection of major FX trading sessions including New York, London, and Tokyo sessions. It displays session ranges, highs and lows, and includes volume analysis to help identify periods of increased market activity.
Key features include:
• Real-time FX Session Detection (NY, London, Tokyo)
• Live Daily Candle Overlay with OHLC tracking
• Volume Bars for Strong Volume Detection
• Session Trend Detection
• Dynamic Session Status Tables
• Daily Dividers and Session Box Visualization
• Custom Trading Rules Display
• Watermark System
• Moving Averages (EMA, WMA, SMA)
• Fair Value Gaps (FVG) Detection
• Support & Resistance Levels (CISD)
• Gap Violations Analysis
• Session-specific Volume Analysis
• Customizable Session Times and Colors
• Theme-aware Display Options
• Multiple Watermark Styles
• Session Range and Extremes Display
• Professional Session Dashboard
The session dashboard provides a clear overview of current market conditions, while customizable trading rules can be displayed directly on the chart. Session boxes and dividers help visualize different trading periods, making it easier to understand market structure across different time zones.
All session times, colors, and display options are fully customizable to match your trading preferences. The indicator works across multiple timeframes and includes theme-aware display options for both light and dark chart themes.
Whether you're a day trader looking for session-based opportunities or a swing trader analyzing market structure, this indicator provides the tools needed to better understand FX market dynamics across different trading sessions.

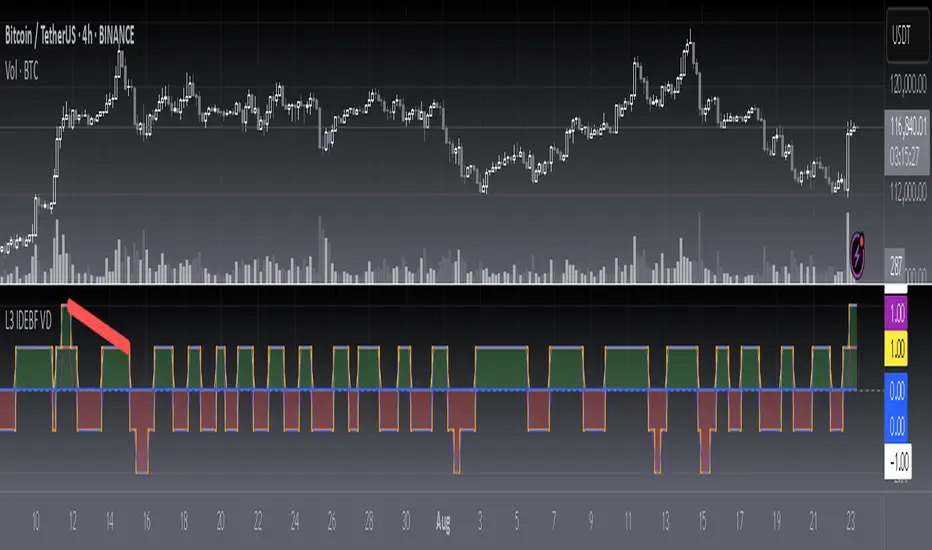
Shelf FVG Alert Multi TF 3 [FINAL]shelf best i have ever seen it. thats pattern shows zones where we can see impuls

T-Virus Sentiment [hapharmonic]🧬 T-Virus Sentiment: Visualize the Market's DNA
Remember the iconic T-Virus vial from the first Resident Evil? That powerful, swirling helix of potential has always fascinated me. It sparked an idea: what if we could visualize the market's underlying health in a similar way? What if we could capture the "genetic code" of market sentiment and contain it within a dynamic, 3D indicator? This project is the result of that idea, brought to life with Pine Script.
The indicator's main goal is to measure the strength and direction of market sentiment by analyzing the "genetic code" of price action through a variety of trusted indicators. The result is displayed as a liquid level within a DNA helix, a bubble density representing buying pressure, and a T-Virus mascot that reflects the overall mood.
🧐 Core Concept: How It Works
The primary output of the indicator is the "Active %" gauge you see on the right side of the vial. This percentage represents the overall sentiment score, calculated as an average from 7 different technical analysis tools. Each tool is analyzed on every bar and assigned a score from 1 (strong bearish pressure) to 5 (strong bullish potential).
In this indicator, we re-imagine market dynamics through the lens of a viral outbreak. A strong bear market is like a virus taking hold, pulling all technical signals down into a state of weakness. Conversely, a powerful bull market is like an antiviral serum ; positive signals rise and spread toward the top of the vial, indicating that the system is being injected with strength.
This is not just another line on a chart. It's a comprehensive sentiment dashboard designed to give an immediate, at-a-glance understanding of the confluence between 7 classic technical indicators. The incredible 3D model of the vial itself was inspired by a design concept found here .
⚛️ The 4 Core Elements of T-Virus Sentiment
These four elements work in harmony to give a complete, multi-faceted picture of market sentiment. Each component tells a different part of the story.
The Virus Mascot: An instant emotional cue. This character provides the quickest possible read on the overall market mood, combining sentiment with volume pressure.
The Antiviral Serum Level: The main quantitative output. This is the liquid level in the DNA helix and the percentage gauge on the right, representing the average sentiment score from all 7 indicators.
Buy Pressure & Bubble Density: This visualizes volume flow. The density of bubbles represents the intensity of accumulation (buying) versus distribution (selling). It's the "power" behind the move.
The Signal Distribution: This shows the confluence (or dispersion) of sentiment. Are all signals bullish and clustered at the top, or are they scattered, indicating a conflicted market? The position of the indicator labels is crucial, as each is assigned to one of five distinct zones:
Base Bottom: The market is at its weakest. Signals here suggest strong bearish control and distribution.
Lower Zone: The market is still bearish, but signals may be showing early signs of accumulation or bottoming.
Neutral Core (Center): A state of balance or sideways consolidation. The market is waiting for a new direction.
Upper Zone: Bullish momentum is becoming clear. Signals are strengthening and showing bullish control.
Top Cap: The market is "heating up" with strong bullish sentiment, potentially nearing overbought conditions.
🐂🐻 The Virus Mascot: The At-a-Glance Indicator
This character acts as a shortcut to confirm market health. It combines the sentiment score with volume, preventing false confidence in a low-volume rally.
Its state is determined by a dual-check: the overall "Antiviral Serum Level" and the "Buy Pressure" must both be above 50%.
Green & Smiling: The 'all clear' signal. This means that not only is the overall technical sentiment bullish, but it's also being supported by real buying pressure. This is a sign of a healthy bull market.
Red & Angry: A warning sign. This appears if either the sentiment is weak, or a bullish sentiment is not being confirmed by buying volume. The latter could indicate a potential "bull trap" or an exhaustive move.
This mascot can be disabled from the settings page under "Virus Mascot Styling" if a cleaner look is preferred.
🫧 Bubble Density: Gauging Buy vs. Sell Pressure
The bubbles visualize the battle between buyers and sellers. There are two modes to control how this is calculated:
Mode 1: Visible Range (The 'Big Picture' View)
This default mode is best for getting a broad, contextual understanding of the current session. It dynamically analyzes the volume of every single candlestick currently visible on the screen to calculate the buy/sell pressure ratio. It answers the question: "Over the entire period I'm looking at, who is in control?" As you zoom in or out, the calculation adapts.
Mode 2: Custom Lookback (The 'Precision' View)
This mode is for traders who need to analyze short-term pressure. You can define a fixed number of recent bars to analyze, which is perfect for scalping or understanding the volume dynamics leading into a key level. It answers the question: "What is happening right now ?" In the example above, a lookback of 2 focuses only on the most recent action, clearly showing intense, immediate selling pressure (few bubbles) and a corresponding drop in the sentiment score to 29%.
ℹ️ Interactive Tooltips: Dive Deeper
We believe in transparency, not 'black box' indicators. This feature transforms the indicator from a visual aid into an active learning tool.
Simply hover the mouse over any indicator label (like EMA, OBV, etc.) to get a detailed tooltip. It will explain the specific data points and thresholds that signal met to be placed in its current zone. This helps build trust in the signals and allows users to fine-tune the indicator settings to better match their own trading style.
🎯 The Scoring Logic Breakdown
The "Antiviral Serum Level" gauge is the average score from 7 technical analysis tools. Each is graded on a 5-point scale (1=Strong Bearish to 5=Strong Bullish). Here’s a detailed, transparent look at how each "gene" is evaluated:
Relative Strength Index (RSI)
Measures momentum and overbought/oversold conditions.
Group 1 (Strong Bearish): RSI > 80 (Extreme Overbought)
Group 2 (Bearish): 70 < RSI ≤ 80 (Overbought)
Group 3 (Neutral): 30 ≤ RSI ≤ 70
Group 4 (Bullish): 20 ≤ RSI < 30 (Oversold)
Group 5 (Strong Bullish): RSI < 20 (Extreme Oversold)
Exponential Moving Averages (EMA)
Evaluates the trend's strength and structure based on the alignment of multiple EMAs (9, 21, 50, 100, 200, 250).
Group 1 (Strong Bearish): A perfect bearish sequence (9 < 21 < 50 < ...)
Group 2 (Bearish Transition): Early signs of a potential reversal (e.g., 9 > 21 but still below 50)
Group 3 (Neutral / Mixed): MAs are intertwined or showing a partial bullish sequence.
Group 4 (Bullish): A strong bullish sequence is forming (e.g., 9 > 21 > 50 > 100)
Group 5 (Strong Bullish): A perfect bullish sequence (9 > 21 > 50 > 100 > 200 > 250)
Moving Average Convergence Divergence (MACD)
Analyzes the relationship between two moving averages to gauge momentum.
Group 1 (Strong Bearish): MACD & Histogram are negative and momentum is falling.
Group 2 (Weakening Bearish): MACD is negative but the histogram is rising or positive.
Group 3 (Neutral / Crossover): A crossover event is occurring near the zero line.
Group 4 (Bullish): MACD & Histogram are positive.
Group 5 (Strong Bullish): MACD & Histogram are positive, rising strongly, and accelerating.
Average Directional Index (ADX)
Measures trend strength, not direction. The score is based on both ADX value and the dominance of DI+ vs DI-.
Group 1 (Bearish / No Trend): ADX < 20 and DI- is dominant.
Group 2 (Developing Bearish Trend): 20 ≤ ADX < 25 and DI- is dominant.
Group 3 (Neutral / Indecision): Trend is weak or DI+ and DI- are nearly equal.
Group 4 (Developing Bullish Trend): 25 ≤ ADX ≤ 40 and DI+ is dominant.
Group 5 (Strong Bullish Trend): ADX > 40 and DI+ is dominant.
Ichimoku Cloud (IKH)
A comprehensive indicator that defines support/resistance, momentum, and trend direction.
Group 1 (Strong Bearish): Price is below the Kumo, Tenkan < Kijun, and Chikou is below price.
Group 2 (Bearish): Price is inside or below the Kumo, with mixed secondary signals.
Group 3 (Neutral / Ranging): Price is inside the Kumo, often with a Tenkan/Kijun cross.
Group 4 (Bullish): Price is above the Kumo with strong primary signals.
Group 5 (Strong Bullish): All signals are aligned bullishly: price above Kumo, bullish Tenkan/Kijun cross, bullish future Kumo, and Chikou above price.
Bollinger Bands (BB)
Measures volatility and relative price levels.
Group 1 (Strong Bearish): Price is below the lower band.
Group 2 (Bearish Territory): Price is between the lower band and the basis line.
Group 3 (Neutral): Price is hovering around the basis line.
Group 4 (Bullish Territory): Price is between the basis line and the upper band.
Group 5 (Strong Bullish): Price is above the upper band.
On-Balance Volume (OBV)
Uses volume flow to predict price changes. The score is based on OBV's trend and its position relative to its moving average.
Group 1 (Strong Bearish): OBV is below its MA and falling.
Group 2 (Weakening Bearish): OBV is below its MA but showing signs of rising.
Group 3 (Neutral): OBV is very close to its MA.
Group 4 (Bullish): OBV is above its MA and rising.
Group 5 (Strong Bullish): OBV is above its MA, rising strongly, and showing signs of a volume spike.
🧭 How to Use the T-Virus Sentiment Indicator
IMPORTANT: This indicator is a sentiment dashboard , not a direct buy/sell signal generator. Its strength lies in showing confluence and providing a quick, holistic view of the market's technical health.
Confirmation Tool: Use the "Active %" gauge to confirm a trade setup from your primary strategy. For example, if you see a bullish chart pattern, a high and rising sentiment score can add confidence to your trade.
Momentum & Trend Gauge: A consistently high score (e.g., > 75%) suggests strong, established bullish momentum. A consistently low score (< 25%) suggests strong bearish control. A score hovering around 50% often indicates a ranging or indecisive market.
Divergence & Warning System: Pay attention to divergences. If the price is making new highs but the sentiment score is failing to follow or is actively decreasing, it could be an early warning sign that the underlying momentum is weakening.
⚙️ Settings & Customization
The indicator is highly customizable to fit any trading style.
Position & Anchor: Control where the vial appears on the chart.
Styling (Vial, Helix, etc.): Nearly every visual element can be color-customized.
Signals: This is where the real power is. All underlying indicator parameters (RSI length, MACD settings, etc.) can be fine-tuned to match a personal strategy. The text labels can also be disabled if the chart feels cluttered.
Enjoy visualizing the market's DNA with the T-Virus Sentiment indicator

PowerTrend Pro Strategy – Gold OptimizedTired of false signals on Gold?
PowerTrend Pro combines VWAP, Supertrend, RSI, and smart MA filters with trailing stops & break-even logic to deliver high-probability trades on XAUUSD.
PowerTrend Pro Strategy is a professional-grade trading system designed to capture high-probability swing and intraday opportunities on XAUUSD (Gold) and other volatile markets.
🔑 Core Features
VWAP Anchoring – institutional fair value reference to filter trades.
Supertrend (ATR-based) – adaptive trend filter tuned for Gold’s volatility.
Multi-Timeframe RSI – confirms momentum alignment across intraday and higher timeframe.
EMA + SMA Combo – ensures trades follow strong directional bias, reducing false signals.
Dynamic Risk Management
Adjustable Take Profit / Stop Loss (%)
Trailing Stop that locks in profits on extended moves
Break-Even Logic (stop loss moves to entry once price is in profit)
⚡ Gold-Tuned Presets
XAUUSD 1H → tighter TP/SL & faster entries for active intraday trading.
XAUUSD 4H → wider ATR filter & trailing stops to capture bigger swings.
Generic Mode → works on Forex, Indices, and Crypto (fully customizable).
🎯 Why It Works
Gold is notoriously volatile — quick spikes wipe out weak strategies. PowerTrend Pro solves this by combining:
✅ Institutional bias (VWAP)
✅ Adaptive trend filter (Supertrend)
✅ Momentum confirmation (RSI MTF)
✅ Robust trend structure (EMA + SMA)
✅ Smart exits (TP, SL, trailing & breakeven)
This multi-layer confirmation makes entries stronger and keeps risk under control.
🛠️ Usage
Add the strategy to your chart.
Choose a preset (XAUUSD 1H, 4H, or Generic).
Run Strategy Tester for performance metrics.
Optimize TP/SL and ATR values for your broker & market conditions.
🔥 Pro Tip: Combine this strategy with a session filter (London/NY overlap) or volume confirmation to boost accuracy in Gold.

High Timeframe Candle Overlay (Configurable)HTF Candle Overlay — Read Higher Timeframe on Lower Timeframe Charts
What it does
This indicator draws each selected Higher-Timeframe (HTF) candle directly on your lower-timeframe (LTF) chart. It shows a translucent range box (HTF high–low) and an inner body box (HTF open–close), so you can track how the bigger candle is forming while you analyze lower-timeframe structure, liquidity sweeps, and intrabar reactions.
Why it’s helpful
• See where the current HTF candle opened, where price sits inside its body, and how far wicks extend—without leaving your LTF chart.
• Combine HTF context (e.g., 1H/4H) with LTF execution (e.g., 1m–15m) to spot confluence, S/R flips, and failed breaks faster.
• The overlay is locked to the price scale and anchored by bar index, so it pans/zooms exactly with your chart (no drifting while dragging).
⸻
How it works (under the hood)
• Fetches HTF OHLC via request.security.
• When a new HTF bar starts, the previous HTF boxes are frozen at the true close.
• The current HTF bar updates intrabar (so you see live formation) and is clamped to the correct span.
• Horizontal anchoring uses bar index, and a hidden price plot binds the script to the main price scale for stable zoom/pan behavior.
⸻
Inputs
• High Timeframe (HTF): Default 1H (set any TF you like).
• Show High–Low Box: On/off.
• Show Body Box (Open–Close): On/off.
• Opacity for range/body boxes.
• Bull/Bear Colors and Outline + Width.
• Max HTF Candles to Keep: Auto-deletes older boxes to maintain performance.
⸻
Usage tips
• Popular combos: view 1H or 4H candles while trading 1–15m charts.
• Turn off the range box if you only want a clean HTF body overlay.
• Pair with your session/structure tools; this indicator is visual context only (no signals or alerts).
⸻
Notes & limitations
• Non-repainting for closed HTF bars: once an HTF candle closes, its boxes are fixed. The current/in-progress HTF bar updates until it closes (expected live behavior).
• Data alignment depends on your symbol’s feed and session settings. Heikin Ashi/renko/etc. may not match classic OHLC.
• Heavy history + many boxes can affect performance; reduce “Max HTF Candles to Keep” if needed.
⸻
Disclaimer
This script is for education and charting visualization only. It does not provide financial advice, trade signals, or performance guarantees. Always do your own research and manage risk.
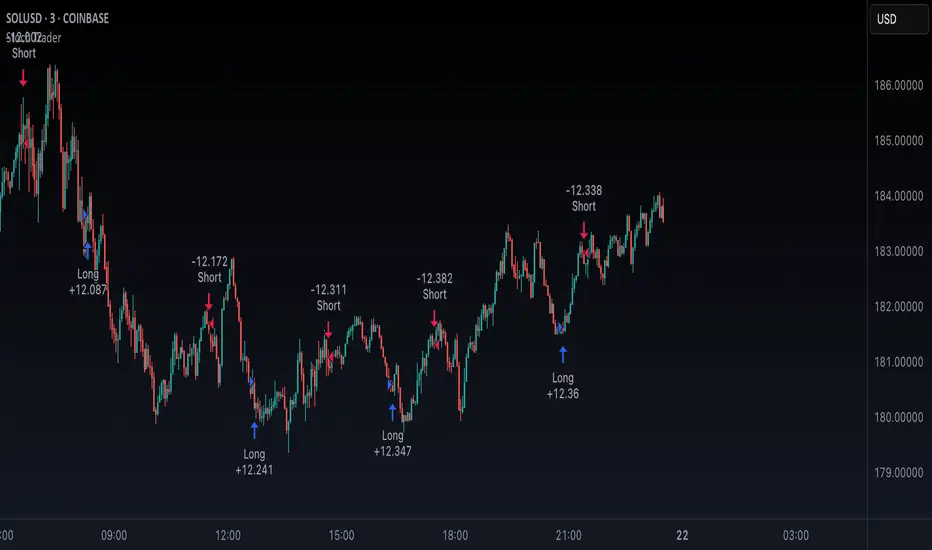
Stoch TraderSimple example strategy that has greater than 60% win rate on 1m, 3m, and 5m views. Using something as simple as this with leverage can produce decent returns within 15-30min. It's also very easy to lose money doing this.
[blackcat] L1 Dual Ehlers Bandpass FilterOVERVIEW
The Dual Ehlers Bandpass Filter combines two bandpass filters tuned to the dominant and subdominant market cycles, creating a powerful signal extraction tool. This indicator uses John Ehlers' advanced digital signal processing techniques to isolate specific frequency components from price data. By mixing the outputs of two bandpass filters, it provides a smoother, more responsive signal that captures both primary and secondary market cycles. The indicator includes divergence detection capabilities and multiple mixing methods for customizable signal extraction.
FEATURES
- Dual bandpass filtering with dominant and subdominant cycle detection
- Multiple dominant cycle calculation methods (HoDyDC, PhAcDC, DuDiDC, CycPer, BPZC)
- Flexible mixing options: weighted, sum, difference, dominant-only, or subdominant-only
- Adjustable bandwidth parameters for both filters
- Built-in divergence detection with customizable lookback periods
- Optional display of individual filter components
- Color-coded signals and alerts for bullish/bearish divergences
HOW TO USE
1. Select your preferred price source (close, high, low, etc.)
2. Choose the dominant cycle calculation method from the available options
3. Set the subdominant cycle ratio (typically 0.1-0.9 of the dominant cycle)
4. Adjust bandwidth parameters for both filters (0.1-1.0 range)
5. Select your preferred mixing method:
- Weighted: Mix based on adjustable weights
- Sum: Add both filter outputs
- Difference: Subtract subdominant from dominant
- Dominant: Show only the dominant filter
- Subdominant: Show only the subdominant filter
6. Enable divergence detection to identify potential trend reversals
7. Optionally enable individual filter plots for analysis
LIMITATIONS
- The indicator requires sufficient historical data for accurate cycle detection
- Dominant cycle calculations may vary significantly during low volatility periods
- Divergence signals are lagging indicators and should be used with confirmation
- Bandpass filters may produce false signals during choppy market conditions
- The indicator is not suitable for all trading styles and timeframes
NOTES
- The indicator uses the blackcat1402/dc_ta library for advanced cycle calculations
- Zero line crossing can indicate potential trend changes
- Positive values typically suggest bullish momentum, negative values bearish momentum
- Divergence signals appear as colored dots and labels on the chart
- Alert conditions are available for both bullish and bearish divergences
THANKS
Special thanks to John Ehlers for his pioneering work in digital signal processing for financial markets.

Advanced Price Ranges ICTThis indicator automatically divides price into fixed ranges (configurable in points or pips) and plots important reference levels such as the high, low, 50% midpoint, and 25%/75% quarters. It is designed to help traders visualize structured price movement, spot confluence zones, and frame their trading bias around clean range-based levels.
🔹 Key Features
Custom Range Size: Define ranges in points (e.g., 100, 50, 25, 10) or in Forex pips.
Forex Mode: Automatically adapts pip size (0.0001 or 0.01 for JPY pairs).
Dynamic Anchoring: Price ranges automatically align to the current price, snapping into blocks.
Multiple Ranges: Option to extend visualization above and below the current active block for a complete grid.
Level Types:
High / Low of the range
50% midpoint
25% and 75% quarters
Custom Styling: Adjustable line colors and widths for each level type.
Labels: Optional right-edge labels showing level type and exact price.
Alerts: Built-in alerts for when price crosses the range high, low, or 50% midpoint.
🔹 Use Cases
Quickly map out 100/50/25/10 point structures like Zeussy’s advanced price range method.
Identify key reaction levels where liquidity is often built or swept.
Support ICT-style concepts like range-based bias, fair value gaps, and liquidity pools.
Works for indices, futures, crypto, and forex.
🔹 Customization
Range increments can be set to any size (default 100).
Toggle which levels are shown (High/Low, Midpoint, Quarters).
Adjustable line widths, colors, and label visibility.
Extend ranges above and below for broader market context.

Smart Money Concepts //@deepak
//@version=5
indicator(title='Custom Also Builder - v1', shorttitle="Custom Also Builder - v1", overlay=true, max_bars_back=500)
ma(_source, _length, _type) =>
switch _type
"SMA" => ta.sma (_source, _length)
"EMA" => ta.ema (_source, _length)
"RMA" => ta.rma (_source, _length)
"WMA" => ta.wma (_source, _length)
"VWMA" => ta.vwma(_source, _length)
alarm(_osc, _message) =>
alert(syminfo.ticker + ' ' + _osc + ' : ' + _message + ', price (' + str.tostring(close, format.mintick) + ')')
//Conditional Sampling EMA Function
Cond_EMA(x, cond, n) =>
var val = array.new_float(0)
var ema_val = array.new_float(1)
if cond
array.push(val, x)
if array.size(val) > 1
array.remove(val, 0)
if na(array.get(ema_val, 0))
array.fill(ema_val, array.get(val, 0))
array.set(ema_val, 0, (array.get(val, 0) - array.get(ema_val, 0)) * (2 / (n + 1)) + array.get(ema_val, 0))
EMA = array.get(ema_val, 0)
EMA
//Conditional Sampling SMA Function
Cond_SMA(x, cond, n) =>
var vals = array.new_float(0)
if cond
array.push(vals, x)
if array.size(vals) > n
array.remove(vals, 0)
SMA = array.avg(vals)
SMA
//Standard Deviation Function
Stdev(x, n) =>
math.sqrt(Cond_SMA(math.pow(x, 2), 1, n) - math.pow(Cond_SMA(x, 1, n), 2))
//Range Size Function
rng_size(x, scale, qty, n) =>
ATR = Cond_EMA(ta.tr(true), 1, n)
AC = Cond_EMA(math.abs(x - x ), 1, n)
SD = Stdev(x, n)
rng_size = scale == 'Pips' ? qty * 0.0001 : scale == 'Points' ? qty * syminfo.pointvalue : scale == '% of Price' ? close * qty / 100 : scale == 'ATR' ? qty * ATR : scale == 'Average Change' ? qty * AC : scale == 'Standard Deviation' ? qty * SD : scale == 'Ticks' ? qty * syminfo.mintick : qty
rng_size
//Two Type Range Filter Function
rng_filt(h, l, rng_, n, type, smooth, sn, av_rf, av_n) =>
rng_smooth = Cond_EMA(rng_, 1, sn)
r = smooth ? rng_smooth : rng_
var rfilt = array.new_float(2, (h + l) / 2)
array.set(rfilt, 1, array.get(rfilt, 0))
if type == 'Type 1'
if h - r > array.get(rfilt, 1)
array.set(rfilt, 0, h - r)
if l + r < array.get(rfilt, 1)
array.set(rfilt, 0, l + r)
if type == 'Type 2'
if h >= array.get(rfilt, 1) + r
array.set(rfilt, 0, array.get(rfilt, 1) + math.floor(math.abs(h - array.get(rfilt, 1)) / r) * r)
if l <= array.get(rfilt, 1) - r
array.set(rfilt, 0, array.get(rfilt, 1) - math.floor(math.abs(l - array.get(rfilt, 1)) / r) * r)
rng_filt1 = array.get(rfilt, 0)
hi_band1 = rng_filt1 + r
lo_band1 = rng_filt1 - r
rng_filt2 = Cond_EMA(rng_filt1, rng_filt1 != rng_filt1 , av_n)
hi_band2 = Cond_EMA(hi_band1, rng_filt1 != rng_filt1 , av_n)
lo_band2 = Cond_EMA(lo_band1, rng_filt1 != rng_filt1 , av_n)
rng_filt = av_rf ? rng_filt2 : rng_filt1
hi_band = av_rf ? hi_band2 : hi_band1
lo_band = av_rf ? lo_band2 : lo_band1
ma_function(source, length, type) =>
if type == 'RMA'
ta.rma(source, length)
else if type == 'SMA'
ta.sma(source, length)
else if type == 'EMA'
ta.ema(source, length)
else if type == 'WMA'
ta.wma(source, length)
else if type == 'HMA'
if(length<2)
ta.hma(source,2)
else
ta.hma(source, length)
else
ta.vwma(source, length)
// Get Table Size
table_size(s) =>
switch s
"Auto" => size.auto
"Huge" => size.huge
"Large" => size.large
"Normal" => size.normal
"Small" => size.small
=> size.tiny
setup_group= "████████ Indicator Setup ████████"
signalexpiry = input.int(defval=3, title='Signal Expiry Candle Count',group=setup_group, inline='expiry',tooltip="Number of candles to wait for all indicators to confirm a signal. Default is 3 which means if leading indicator print the signal, it will wait for max 3 more candles for rest of the indicators to print signal, if not then this setup is invalided and will have to wait for another signal form the leading indicator.")
alternatesignal = input.bool (true, "Alternate Signal", group=setup_group, inline='alternate')
showsignal = input.bool (true, "Show Long/Short Signal", group=setup_group,inline='showsignal',tooltip="Option to turn on/off the Long/Short signal shown on the chart. by default it will print Long/ Short signal on the chart.")
showdashboard = input.bool (true, "Show Dashboard", group=setup_group,inline='dashboard')
string i_tab1Ypos = input.string('bottom', 'Dashboard Position',group=setup_group, inline='dashboard2', options= )
string i_tab1Xpos = input.string('right', '', inline='dashboard2', group=setup_group,options= )
in_dashboardtab_size = input.string(title="Dashboard Size ", defval="Normal",
options= ,
group= setup_group , inline= "dashboard3")
///////////////////////////////////////////////
///// Signal filters
/////////////////////////////////////////////
leadingindicator = input.string(title="Leading Indicator", defval="Range Filter",
options= , group='████████ Main Indicator (signal) ████████', inline='li')
confirmation_group = "████████ Confirmation Indicators (filter) ████████ "
ema_tooltip = "EMA filter for confirmation. Validates Long signal if price is above the EMA FILTER level, and validates Short signal if price is below the EMA FILTER level. Default is 200, you can change that to meet your requiremnt."
respectema = input.bool (false, "EMA Filter", group=confirmation_group, inline='respectema')
respectemaperiod = input.int(defval=200, minval=1, title='', group=confirmation_group, inline='respectema', tooltip=ema_tooltip)
ema2_tooltip = "Generates Long signal if Fast EMA cross above Slow EMA. Generates Short signal when Fast EMA cross below the Slow EMA. Default values are 50 and 200. you can change that to meet your requirement."
respect2ma = input.bool (false, "2 EMA Cross : ", group=confirmation_group, inline='2ma')
respect2maperiod_1 = input.int(defval=50, title='',group=confirmation_group, inline='2ma')
respect2maperiod_2 = input.int(defval=200, title='',group=confirmation_group, inline='2ma',tooltip=ema2_tooltip)
ema3_tooltip = "Generates Long signal if first EMA (Fastest) cross above 2nd and 3rd EMA and 2nd EMA cross above 3rd EMA. Generates Short signal if first EMA (Fastest) cross below 2nd and 3rd EMA and 2nd EMA cross below 3rd EMA . Default values are 9,21 and 55. you can change that to meet your requirement."
respect3ma = input.bool (false, "3 EMA Cross : ", group=confirmation_group, inline='3ma',tooltip=ema3_tooltip)
respect3maperiod_1 = input.int(defval=9, title='',group=confirmation_group, inline='3ma',tooltip=ema3_tooltip)
respect3maperiod_2 = input.int(defval=21, title='',group=confirmation_group, inline='3ma',tooltip=ema3_tooltip)
respect3maperiod_3 = input.int(defval=55, title='',group=confirmation_group, inline='3ma',tooltip=ema3_tooltip)
respectrf = input.bool (false, "Range Filter", group=confirmation_group, inline='rf')
rftype = input.string(title="", defval="Default", options= , group=confirmation_group, inline='rf')
respectrqk = input.bool (true, "Rational Quadratic Kernel (RQK)", group=confirmation_group, inline='rqk',tooltip="Nadaraya Watson: Rational Quadratic Kernel (RQK)")
respectst = input.bool (false, "SuperTrend", group=confirmation_group, inline='st')
respectht = input.bool (false, "Half Trend", group=confirmation_group, inline='ht')
respectdonchian = input.bool (false, "Donchian Trend Ribbon", group=confirmation_group, inline='donchian')
respectroc = input.bool (false, "Rate of Change (ROC)", group=confirmation_group, inline='roc')
respecttsi = input.bool (false, "True Strength Indicator (TSI)", group=confirmation_group, inline='tsi')
tsitooltip = "Signal Crossover: TSI crossover or greater than signal line for long, and TSI crossunder signal line for short. Zero Line Cross: TSI cross above zero line and signal line for long signal. Tsi Cross below zero and signal line for short signal."
tsitype = input.string(title="", defval="Signal Cross", options= ,tooltip=tsitooltip, group=confirmation_group, inline='tsi')
respecttdfi = input.bool (false, "Trend Direction Force Index (TDFI)", group=confirmation_group, inline='tdfi')
respectmd = input.bool (false, "McGinley Dynamic", group=confirmation_group, inline='md')
respectdpo = input.bool (false, "Detrended Price Oscillator (DPO)", group=confirmation_group, inline='dpo')
respectichi = input.bool (false, "Ichimoku Cloud", group=confirmation_group, inline='ichi')
respectsuperichi = input.bool (false, "SuperIchi", group=confirmation_group, inline='ichi',tooltip="Ichimoku Cloud Conditions: 1. Candle above cloud 2. Converstion Line above base line 3. Leading 26 bar cloud is green 4. lagging span is above the cloud")
respecttrendline_breakout = input.bool (false, "Trendline Breakout", group=confirmation_group, inline='tb')
respectrd = input.bool (false, "Range Detector", group=confirmation_group, inline='rd',tooltip="Range Detector: if used as leading indicator, it will be based on range breakout. If used as confirmation indicator, it will be used to filter entries within the active range area.")
respecthacolt = input.bool (false, "Heiken-Ashi Candlestick Oscillator", group=confirmation_group, inline='hacolt',tooltip="Vervoort LongTerm Heiken-Ashi Candlestick Oscillator: If oscilliation is above 0 line, then long signal is issued and if below zero line, short signal is issued.")
respectbx = input.bool (false, "B-Xtrender", group=confirmation_group, inline='bx')
bxtype = input.string(title="", defval="Short and Long term trend", options= , group=confirmation_group, inline='bx', tooltip = "Short term trend: ===================== For buy signal the short term trend line must turn green, and for the sell signal, the short term trend line must turn red. Short and Long term trend: ===================== For buy signal, the short term trend must change from red to green and long term trend cross above zero line, for Sell signal the short term trend must turn red and long term trend line cross down the zero line..")
respectbbpt = input.bool (false, "Bull bear Power Trend", group=confirmation_group, inline='bbpt')
bbpttype = input.string(title="", defval="Follow Trend", options= , group=confirmation_group, inline='bbpt', tooltip = "Follow Trend: ===================== Buy signal will be validated if the BBPT trend line is above 2, and Sell signal will be validated if BBPT trend line is below -2. Without Trend: ===================== Ignore the BBPT trend line.")
respectvwap = input.bool (false, "VWAP", group=confirmation_group, inline='vwap')
respectbbosc = input.bool (false, "BB Oscillator", group=confirmation_group, inline='bbosc')
bbtype = input.string(title="", defval="Entering Lower/Upper Band", options= , group=confirmation_group, inline='bbosc')
respecttm = input.bool (false, "Trend Meter", group=confirmation_group, inline='tm')
tmtype = input.string(title="", defval="3 TM and 2 TB change to same color", options= , group=confirmation_group, inline='tm')
respectce = input.bool (false, "Chandelier Exit", group=confirmation_group, inline='ce')
respectcci = input.bool (false, "CCI", group=confirmation_group, inline='cci')
respectao = input.bool (false, "Awesome Oscillator", group=confirmation_group, inline='ao')
aotype = input.string(title="", defval="Zero Line Cross", options= , group=confirmation_group, inline='ao', tooltip = "Zero Line Cross: If AO value cross the zero line up, Buy signal will be generated, and if AO value cross down the zero line, sell signal will be generated.")
respectadx = input.bool (false, "DMI (ADx)", group=confirmation_group, inline='adx')
adxtype = input.string(title="", defval="Adx & +Di -Di", options= , group=confirmation_group, inline='adx', tooltip = "Adx Only: If Adx value is above the defined level. Adx & +Di -DI : When Adx value is above the defined level and croseeover between +di and -di. Di will determine the direction of the movement. Advance: ")
respectsar = input.bool (false, "Parabolic SAR (PSAR)", group=confirmation_group, inline='sar')
respectwae = input.bool (false, "Waddah Attar Explosion", group=confirmation_group, inline='wae')
vo_tooltip = "Volatility Oscillator: ======================= If the spike line is above the upper line, buy signal is generated (or validated). If the spike line is below the lower line, sell signal is generated (or validated)."
respectvo = input.bool (false, "Volatility Oscillator", group=confirmation_group, inline='vo', tooltip = vo_tooltip)
ci_tooltip = "Choppiness index: ======================= If the index is below the defined threshold (default 61.8) then asset is considered trending and signal will be validated, if index is above 61.8 then asset is considered having sideway movement."
respectci = input.bool (false, "Choppiness Index ", group=confirmation_group, inline='ci')
ci_limit = input.float(61.8,title=" ", inline='ci',group=confirmation_group, tooltip = ci_tooltip)
respectdv = input.bool (false, "Damiani Volatility (DV)", group=confirmation_group, inline='dv')
dvtype = input.string(title="", defval="Simple", options= , group=confirmation_group, inline='dv', tooltip = "Simple Volatility is green. Threshold Volatility green and >1.1")
stochtooltip="CrossOver: ------------------ CrossOver of K and D line at any level. CrossOver in OB & OS levels: Generate buy signal if crossover happens in oversold area and crossing up oversold level. Generate sell signal on crossover in overbought area and cross down upper level. ------------------ %K above/below %D ------------------ : Generate Buy signal or validate other signal if %K is above %D and opposite for Sell Signal."
respectstochastic = input.bool (false, "Stochastic", group=confirmation_group, inline='stoch')
stochtype = input.string(title="", defval="CrossOver", options= ,tooltip=stochtooltip, group=confirmation_group, inline='stoch')
rsi_tooltip = "RSI MA Cross: ============= Generate buy signal when RSI cross up RSI MA line and sell signal when RSI cross down RSI MA line. RSI Exits OB/OS zones: ================== Generate Buy signal when RSI crosses down the overbough zone and sell signal when RSI crosses up the oversold zone. RSI Level: ========== Generate buy signal if RSI cross above the specific level and sell signal when RSI crossdown the level. +++++ You can change the setting to define the OB/OS and MidLine Levels"
respectrsi = input.bool (false, "RSI", group=confirmation_group, inline='rsi')
rsitype = input.string(title="", defval="RSI MA Cross", options= , tooltip=rsi_tooltip, group=confirmation_group, inline='rsi')
rsima_tooltip = "RSI MA Direction: ============= The buy and sell signal will respect the RSI MA direction. For buy signal, the RSI MA should be increasing or same compared to previous RSI MA. for SHORT, the RSI MA should be same or decreasing compared to last RSI MA"
respectrsima = input.bool (false, "RSI MA Direction", group=confirmation_group, inline='rsi2',tooltip=rsima_tooltip)
rsilimit_tooltip = "RSI Limit: ============= This is to allow you to set limit for the RSI value for long and short. default value for long is 40, which means if the RSI is 40 or above, only then BUY signal will be validated. for short if RSI is 60 or less, only then sell signal willbe validated."
respectrsilimit = input.bool (false, "RSI Limit : ", group=confirmation_group, inline='rsi3',tooltip=rsilimit_tooltip)
rsilimitup = input.int(40, title="Long",inline='rsi3', group=confirmation_group)
rsilimitdown = input.int(60, title="short",inline='rsi3', group=confirmation_group)
rsimalimit_tooltip = "RSI MA Limit: ============= This is to allow you to set limit for the RSI MA value for long and short. default value for long is 40, which means if the RSI MA is 40 or above, only then BUY signal will be validated. for short if RSI MA is 60 or less, only then sell signal willbe validated."
respectrsimalimit = input.bool (false, "RSI MA Limit : ", group=confirmation_group, inline='rsi4',tooltip=rsimalimit_tooltip)
rsimalimitup = input.int(40, title="Long",inline='rsi4', group=confirmation_group)
rsimalimitdown = input.int(60, title="short",inline='rsi4', group=confirmation_group)
macdtooltip="MACD Crossover: ------------------ CrossOver of MACD and the Signal line. Generates Long signal when MACD cross up Signal line and Short signal when MACD cross down Signal Line. . Zero line crossover: ------------------ Generate buy signal when MACD cross up the zero line and Sell signal when MACD cross down the zero line."
respectmacd = input.bool (false, "MACD", group=confirmation_group, inline='macd')
macdtype = input.string(title="", defval="MACD Crossover", options= ,tooltip=macdtooltip, group=confirmation_group, inline='macd')
respectssl = input.bool (false, "SSL Channel", group=confirmation_group, inline='ssl')
respectstc = input.bool (false, "Schaff Trend Cycle (STC)", group=confirmation_group, inline='stc')
respectchaikin = input.bool (false, "Chaikin Money Flow", group=confirmation_group, inline='chaikin')
respectvol = input.bool (false, "Volume", group=confirmation_group, inline='volume')
volumetype = input.string(title="", defval="volume above MA", options= , group=confirmation_group, inline='volume', tooltip = "Simple volume is comparing the up/down volme with previous candle. Volume delta will compare the delta or difference between up and down volume with previous candle. Example: up volume = 100 Down volume=-1100 Delta = -1000 Satisfy the bear flag condition if previous -ve delta is lower")
respectwolf = input.bool (false, "Wolfpack Id", group=confirmation_group, inline='wolf')
respectqqe = input.bool (false, "QQE Mod", group=confirmation_group, inline='qqe')
qqetype = input.string(title="", defval="Line", options= , group=confirmation_group, inline='qqe', tooltip = "Line: signal generated when QQE line is above or below 0. Bar: when Blue bar is above 0 or Red bar below 0 Line & Bar: Both Bar and Line to be above(bullist) or below (beari

Renko WPR Color ChangerChanges color when williams percent R is between 0 and -20 or when between -80 and -100. Works with renko, HA and regular candles. Can change color.

Сила быков и медведейThe indicator is based on the idea that the buyer's strength is represented on the chart as the distance from the bar's minimum to the close, and the seller's strength as the distance from the bar's maximum to the close.
The indicator finds the difference between the buyer's and seller's strength for each bar, and then the arithmetic mean for the given period.
If the indicator value is above 0, then the buyer was stronger than the seller over the given period.
If the indicator value is below 0, then the seller was stronger than the buyer over the given period.
Composite TECH Line (Debug) – v0.2 [Strategy]You can check now first version of strategy - Composite TECH Line V0.2

BarLibrary "Bar"
A comprehensive library for creating and managing custom multi-timeframe (MTF) candlestick bars without using request.security calls, providing enhanced visualization and analytical capabilities with improved performance
Candle()
Creates a new candle object initialized with current bar's OHLC data
Returns: A new _Candle instance with current market data
method body(this)
Calculates the absolute size of the candle body (distance between open and close)
Namespace types: _Candle
Parameters:
this (_Candle)
Returns: The absolute difference between closing and opening prices
method topWick(this)
Calculates the length of the upper wick (shadow above the candle body)
Namespace types: _Candle
Parameters:
this (_Candle)
Returns: The distance from the higher of open/close to the high price
method bottomWick(this)
Calculates the length of the lower wick (shadow below the candle body)
Namespace types: _Candle
Parameters:
this (_Candle)
Returns: The distance from the low price to the lower of open/close
method display(this, bullishColor, bearishColor, transp, borderWidth, lineWidth)
Renders the candle visually on the chart with customizable colors and styling options
Namespace types: _Candle
Parameters:
this (_Candle)
bullishColor (color)
bearishColor (color)
transp (int)
borderWidth (int)
lineWidth (int)
candles(tf, autoDisplay)
Creates and manages an array of custom timeframe candles with optional automatic display
Parameters:
tf (string) : Target timeframe string (e.g., "60", "240", "D") for candle aggregation
autoDisplay (bool)
Returns: Array containing all completed candles for the specified timeframe
_Candle
Custom candlestick data structure that stores OHLCV data with visual rendering components
Fields:
start (series int) : Opening timestamp of the candle period
end (series int) : Closing timestamp of the candle period
o (series float) : Opening price of the candle
h (series float) : Highest price reached during the candle period
l (series float) : Lowest price reached during the candle period
c (series float) : Closing price of the candle
v (series float) : Volume traded during the candle period
bodyBox (series box)
wickLine (series line)
Example Usage
// Change version with latest version
import EmreKb/Bar/1 as bar
// "240" for 4h timeframe
// true for auto display candles on chart (default: false)
candlesArr = bar.candles("240", true)

Trapped Traders [ScorsoneEnterprises]This indicator identifies and visualizes trapped traders - market participants caught on the wrong side of price movements with significant volume imbalances. By analyzing volume delta at specific price levels, it reveals where traders are likely experiencing unrealized losses and may be forced to exit their positions.
The point of this tool is to identify where the liquidity in a trend may be.
var lowerTimeframe = switch
useCustomTimeframeInput => lowerTimeframeInput
timeframe.isseconds => "1S"
timeframe.isintraday => "1"
timeframe.isdaily => "5"
=> "60"
= ta.requestVolumeDelta(lowerTimeframe)
price_quantity = map.new()
is_red_candle = close < open
is_green_candle = close > open
for i=0 to lkb-1 by 1
current_vol = price_quantity.get(close)
new_vol = na(current_vol) ? lastVolume : current_vol + lastVolume
price_quantity.put(close, new_vol)
if is_green_candle and new_vol < 0
price_quantity.put(close, new_vol)
else if is_red_candle and new_vol > 0
price_quantity.put(close, new_vol)
We see in this snippet, the lastVolume variable is the most recent volume delta we can receive from the lower timeframe, we keep updating the price level we're keeping track of with that lastVolume from the lower timeframe.
This is the bulk of the concept as this level and size gives us the idea of how many traders were on the wrong side of the trend, and acting as liquidity for the profitable entries. The more, the stronger.
There are 3 ways to visualize this. A basic label, that will display the size and if positive or negative next to the bar, a gradient line that goes 10 bars to the future to be used as a support or resistance line that includes the quantity, and a bubble chart with the quantity. The larger the quantity, the bigger the bubble.
We see in this example on NYMEX:CL1! that there are lines plotted throughout this price action that price interacts with in meaningful way. There are consistently many levels for us.
Here on CME_MINI:ES1! we see the labels on the chart, and the size set to large. It is the same concept just another way to view it.
This chart of CME_MINI:RTY1! shows the bubble chart visualization. It is a way to view it that is pretty non invasive on the chart.
Every timeframe is supported including daily, weekly, and monthly.
The included settings are the display style, like mentioned above. If the user would like to see the volume numbers on the chart. The text size along with the transparency percentage. Following that is the settings for which lower timeframe to calculate the volume delta on. Finally, if you would like to see your inputs in the status line.
No indicator is 100% accurate, use "Trapped Traders" along with your own discretion.

[blackcat] L3 Improved Dual Ehlers BPF for Volatility DetectionOVERVIEW
This script implements an advanced L3 Improved Dual Ehlers Bandpass Filter (BPF) for volatility detection, combining both L1 and L2 calculation methods to create a comprehensive trading signal. The script leverages John Ehlers' sophisticated digital signal processing techniques to identify market cycles and extract meaningful trading signals from price action. By combining multiple cycle detection methods and filtering approaches, it provides traders with a powerful tool for identifying trend changes, momentum shifts, and potential reversal points across various market conditions and timeframes. The L3 approach uniquely combines the outputs of both L1 (01 range) and L2 (-11 range) methods, creating a signal that ranges from -1~2 and provides enhanced sensitivity to market dynamics.
FEATURES
🔄 Dual Calculation Methods: Choose between L1 (01 range), L2 (-11 range), or combine both for L3 signal (-1~2 range) to match your trading style
📊 Multiple Cycle Detection: Seven different dominant cycle calculation methods including HoDyDC (Hilbert Transform Dominant Cycle), PhAcDC (Phase Accumulation Dominant Cycle), DuDiDC (Duane Dominant Cycle), CycPer (Cycle Period), BPZC (Bandpass Zero Crossing), AutoPer (Autocorrelation Period), and DFTDC (Discrete Fourier Transform Dominant Cycle)
🎛️ Flexible Mixing Options: Six sophisticated mixing methods including weighted averaging, simple sum, difference extraction, dominant-only, subdominant-only, and adaptive mixing that adjusts based on signal strength
🌊 Bandpass Filtering: Precise bandwidth control for both dominant and subdominant filters, allowing fine-tuning of frequency response characteristics
📈 Advanced Divergence Detection: Robust algorithm for identifying bullish and bearish divergences with customizable lookback periods and range constraints
🎨 Comprehensive Visualization: Extensive customization options for all signals, colors, plot styles, and display elements
🔔 Comprehensive Alert System: Built-in alerts for divergence signals, zero line crosses, and various market conditions
📊 Real-time Cycle Information: Optional display of dominant and subdominant cycle periods for educational purposes
🔄 Adaptive Signal Processing: Dynamic adjustment of parameters based on market conditions and volatility
🎯 Multiple Signal Outputs: Simultaneous generation of L1, L2, and L3 signals for different trading strategies
HOW TO USE
Select Calculation Method: Choose between "l1" (01 range), "l2" (-11 range), or "both" (L3, -1~2 range) in the Calculation Method settings based on your preferred signal characteristics
Configure Cycle Detection: Select your preferred Dominant Cycle Method from the seven available options and adjust the Cycle Part parameter (0.1-0.9) to fine-tune cycle sensitivity
Set Subdominant Parameters: Configure the subdominant cycle either as a ratio of the dominant cycle or as a fixed period, depending on your analysis approach
Adjust Filter Bandwidth: Fine-tune the bandwidth settings for both dominant and subdominant filters (0.1-1.0) to control the frequency response and signal smoothing
Choose Mixing Method: Select how to combine the filters - weighted averaging for balance, sum for maximum sensitivity, difference for trend isolation, or adaptive mixing for dynamic response
Configure Smoothing: Select from SMA, EMA, or HMA smoothing methods with adjustable length (1-20 bars) to reduce noise in the final signal
Customize Visualization: Enable/disable individual plots, divergence detection, zero line, fill areas, and customize all colors to match your chart preferences
Set Divergence Parameters: Configure lookback ranges (5-60 bars) for divergence detection to match your trading timeframe and style
Monitor Signals: Watch for crosses above/below zero line and divergence patterns, paying attention to signal strength and consistency
Set Up Alerts: Configure alerts for divergence signals, zero line crosses, and other market conditions to stay informed of trading opportunities
LIMITATIONS
The script requires the dc_ta library from blackcat1402 for several advanced cycle calculation methods (HoDyDC, PhAcDC, DuDiDC, CycPer, BPZC, AutoPer, DFTDC)
L1 method operates in 01 range while L2 method uses -11 range, requiring different interpretation approaches
Combined L3 signal ranges from -1~2 when both methods are selected, creating unique signal characteristics that traders must adapt to
Divergence detection accuracy depends on proper lookback period settings and market volatility conditions
Performance may be impacted with very long lookback ranges (>60 bars) or when multiple plots are simultaneously enabled
The script is designed for non-overlay use and may not display correctly on certain chart types or with conflicting indicators
Adaptive mixing method requires careful threshold tuning to avoid excessive signal fluctuation
Cycle detection algorithms may produce unreliable results during low volatility or highly choppy market conditions
The script assumes regular price data and may not perform optimally with irregular or gapped price sequences
NOTES
The script implements advanced mathematical calculations including bandpass filters, Hilbert transforms, and various cycle detection algorithms developed by John Ehlers
For optimal results, experiment with different cycle detection methods and bandwidth settings across various market conditions and timeframes
The adaptive mixing method automatically adjusts weights based on signal strength, providing dynamic response to changing market conditions
Divergence detection works best when the "Plot Divergence" option is enabled and when combined with other technical analysis tools
Zero line crosses can indicate potential trend changes or momentum shifts, especially when confirmed by volume or other indicators
The script includes commented code for cycle information display that can be enabled if you want to monitor cycle periods in real-time
Different calculation methods may perform better in different market environments - L1 tends to be smoother while L2 is more sensitive
The subdominant cycle helps filter out noise and provides additional confirmation for signals generated by the dominant cycle
Bandwidth settings control the filter's frequency response - lower values provide more smoothing while higher values increase sensitivity
Mixing methods offer different approaches to combining signals - weighted averaging is generally most reliable for most trading applications
THANKS
Special thanks to John Ehlers for his pioneering work in cycle analysis and digital signal processing for financial markets. This script implements and significantly improves upon his bandpass filter methodology, incorporating multiple advanced techniques from his extensive body of work. Also heartfelt thanks to blackcat1402 for the dc_ta library that provides essential cycle calculation methods and for maintaining such a valuable resource for the Pine Script community. Additional appreciation to the TradingView platform for providing the tools and environment that make sophisticated technical analysis accessible to traders worldwide. This script represents a collaborative effort in advancing the field of algorithmic trading and technical analysis.
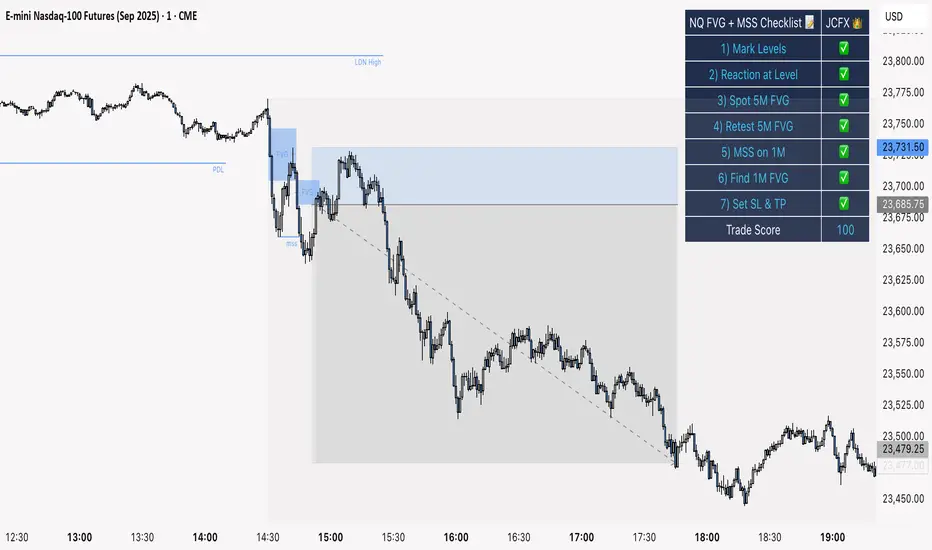
NQ FVG + MSS ChecklistThe NQ FVG + MSS Quick Checklist is a visual trading HUD for Nasdaq 100 (NQ) futures. It helps traders quickly track key setup elements: session & previous day levels, 5M FVG, retests, 1M MSS, and 1M FVG inside MSS.
Each step can be manually ticked, and a Trade Score shows setup strength at a glance. The checklist table sits on top of all chart elements for easy reference without interfering with your analysis.
Features:
Step-by-step NQ trading checklist
Manual inputs with visual ✅/❌
Trade Score for quick setup confirmation
Table overlay always on top of the chart
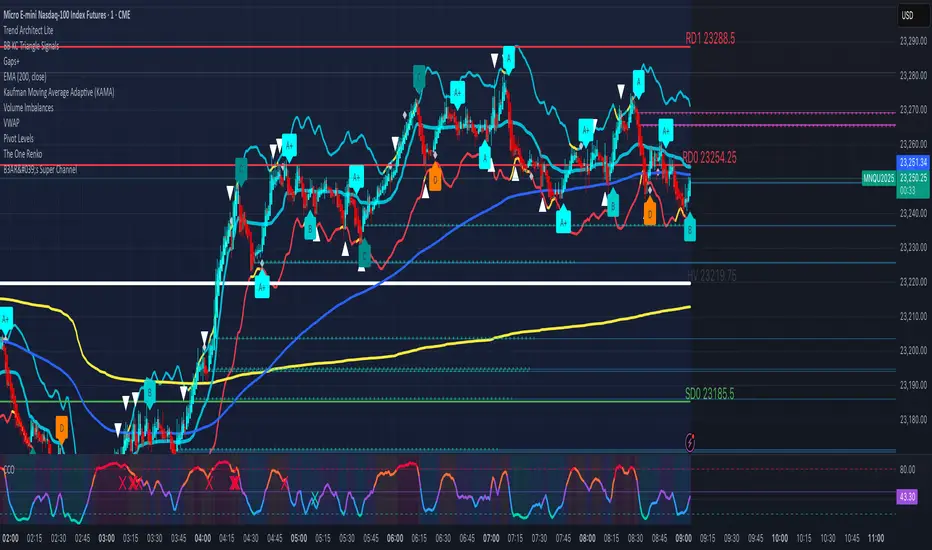
BB KC Triangle SignalsBased on Trader Oracle's engulfing candle off Bolinger Band.
I added keltner channels as well. So this prints a symbol ( I use triangles) over the engulfing candle at or near the bolinger band/ keltner channel. Don't have to have the bands printed on the screen for them to work. Seems to work on renko too.
PDH/PDL (prev RTH) + Current ETH High/LowDescription:
This indicator automatically plots the key levels of PDH/PDL (Previous Day High/Low from regular trading hours – RTH) and ETH High/Low (Extended Hours: pre-market + after-hours) in real time.
• PDH/PDL: calculated at the close of RTH (09:30–16:00 NYSE) and anchored until the next day.
• ETH High/Low: updated live during extended hours (04:00–09:29 and 16:00–20:00 NYSE) and “frozen” at the RTH open for reference during the regular session.
• Customization options: colors, line styles (solid/dashed/dotted), thickness, labels, and the ability to extend lines to the right.
• Levels can also be displayed directly on the price scale.
This script is designed for traders who want a quick visualization of the most relevant levels from the previous day and extended hours, making it easier to identify supports, resistances, and potential reaction zones in price action.
By: Miguel Arenas
