cd_HTF_bias_CxOverview:
No matter our trading style or model, to increase our success rate, we must move in the direction of the trend and align with the Higher Time Frame (HTF). Trading "gurus" call this the HTF bias. While we small fish tend to swim in all directions, the smart way is to flow with the big wave and the current. This indicator is designed to help us anticipate that major wave.
________________________________________
Details and Usage:
This indicator observes HTF price action across preferably seven different pairs, following specific rules. It confirms potential directional moves using CISD levels on a Medium Time Frame (MTF). In short, it forecasts the likely direction (HTF bias). The user can then search for trade opportunities aligned with this bias on a Lower Time Frame (LTF), using their preferred pair, entry model, and style.
________________________________________
Timeframe Alignment:
The commonly accepted LTF/MTF/HTF combinations include:
• 1m – 15m – H4
• 3m – H1 – Daily / 3m – 30m – Daily
• 5m – H1 – Daily
• 15m – H4 – Weekly
• H1 – Daily – Monthly
• H4 – Weekly – Quarterly
Example: If you're trading with a 3m model on a 30m/3m setup, you should seek trades in the direction of the H1/Daily bias.
________________________________________
How It Works:
The indicator first looks for sweeps on the selected HTF — when any of the last four candles are swept, the first condition is met.
The second step is confirmation with a CISD close on the MTF — once a candle closes above/below the CISD level, the second condition is fulfilled. This suggests the price has made its directional decision.
Example: If a previous HTF candle is swept and we receive a bearish CISD confirmation on H1, the HTF bias becomes bearish.
After this, you may switch to a more granular setup like HTF: 30m and MTF: 3m to look for trade entries aligned with the bias (e.g., 30m sweep + 3m CISD).
________________________________________
How Is Bias Determined?
• HTF Sweep + MTF CISD = SC (Sweep & CISD)
• Latest Bullish SC → Bias: Bullish
• Latest Bearish SC → Bias: Bearish
• Price closes above the last Bearish SC → Bias: Strong Bullish
• Price closes below the last Bullish SC → Bias: Strong Bearish
• Strong Bullish bias + Bearish CISD (without HTF sweep) → Bias: Bullish
• Strong Bearish bias + Bullish CISD (without HTF sweep) → Bias: Bearish
• Bearish price violates SC high, but Bullish SC is untouched → Bias: Bullish
• Bullish price violates SC low, but Bearish SC is untouched → Bias: Bearish
• If neither side generates SC → Bias: No Bias
The logic is built on the idea that a price overcoming resistance is stronger, and encountering resistance is weaker. This model is based on the well-known “Daily Bias” structure, but with personal refinements.
________________________________________
What’s on the Screen?
• Classic HTF zones (boxes)
• Potential MTF CISD levels
• Confirmed MTF lines
• Sweep zones when HTF sweeps occur
• Result table showing current bias status
________________________________________
Usage:
• Select HTF and MTF timeframes aligned with your trading timeframe.
• Adjust color and position settings as needed.
• Enter up to seven pairs to track via the menu.
• Use the checkbox next to each pair to enable/disable them.
• If “Ignore these assets” is checked, all pairs will be disabled, and only the currently open chart pair will be tracked.
________________________________________
Alerts:
You can choose alerts for Bullish, Bearish, Strong Bullish, or Strong Bearish conditions.
There are two types of alert sources:
1. From the indicator’s internal list
2. From TradingView’s watchlist
Visual example:
________________________________________
How I Use It:
• For spot trades, I use HTF: Weekly and MTF: H4 and look for Bullish or Strong Bullish pairs.
• For scalping, I follow bias from HTF: Daily and MTF: H1.
Example: If the indicator shows a Bearish HTF Bias, I switch to HTF: 30m and MTF: 3m and enter trades once bearish conditions are met (timeframe alignment).
________________________________________
Important Notes:
• The indicator defines CISD levels only at HTF high and low levels.
• If your chart is on a higher timeframe than your selected HTF/MTF, no data will appear.
Example: If HTF = H1 and MTF = 5m, opening a chart on H4 will result in a blank screen.
• The drawn CISD level on screen is the MTF CISD level.
• Not every alert should be traded. Always confirm with personal experience and visual validation.
• Receiving multiple Strong Bullish/Bearish alerts is intentional. (Trick 😊)
• Please share your feedback and suggestions!
________________________________________
And Most Importantly:
Don't leave street animals without water and food!
Happy trading!
Indicatori e strategie

Dark Pool Block Trades - Institutional Volume📊 Dark Pool Block Trades - Institutional Volume
Visualize where institutional money positions before major price moves occur. This indicator reveals hidden dark pool block trades that often precede significant price movements - because when smart money deploys millions and billions in strategic accumulation or distribution, retail traders need to see where it's happening.
🎯 WHY DARK POOL DATA MATTERS:
Institutions don't move large capital randomly. Dark pool block trades represent strategic positioning by sophisticated money managers with superior research and conviction. These trades create hidden support/resistance levels that often predict future price action.
The key principle: Follow institutional flow, don't fight it. When institutions get involved, they create high-probability trading opportunities.
💰 HOW INSTITUTIONS INFLUENCE PRICE:
- Large block trades establish hidden accumulation/distribution zones
- Smart money builds positions BEFORE retail awareness increases
- Institutional activity creates "footprints" at key technical levels
- These trades often signal conviction plays ahead of major moves
- Institutions typically add to winning positions throughout trends
🔍 WHAT THIS INDICATOR SHOWS:
- Visual overlay of dark pool block trades directly on price charts
- Track institutional positioning across major stocks and ETFs
- Identify accumulation/distribution zones before they become obvious to retail
- Spot high-conviction institutional trades in real-time visualization
- Customizable block trade size filters and timeframe selection
- Historical institutional activity up to 5 years or custom ranges
💡 THE TRADING ADVANTAGE:
Instead of guessing price direction, see where institutions are already positioning. When large block trades appear in dark pools, you're witnessing strategic institutional commitment that frequently leads to significant price movements.
⚡ HOW IT WORKS:
This Pine Script displays institutional dark pool transactions as visual markers on your charts. The script comes with sample data for immediate use. For expanded ticker coverage and real-time updates, external data services are available.
🎯 IDEAL FOR:
- Swing traders following institutional footprints
- Traders seeking setups backed by smart money conviction
- Position traders looking for accumulation zones
- Anyone wanting to align with institutional flow rather than fight it
🔄 SAMPLE DATA INCLUDED:
Pre-loaded with institutional activity data across popular tickers, updated daily to demonstrate how dark pool activity correlates with future price movements.
The script initially covers these tickers going back 6 months showing the top 10 trades by volume over 400,000 shares: AAPL, AMD, AMZN, ARKK, ARKW, BAC, BITO, COIN, COST, DIA, ETHA, GLD, GOOGL, HD, HYG, IBB, IWM, JNJ, JPM, LQD, MA, META, MSFT, NVDA, PG, QQQ, RIOT, SLV, SMCI, SMH, SOXX, SPY, TLT, TSLA, UNH, USO, V, VEA, VNQ, VOO, VTI, VWO, WMT, XLE, XLF, XLK, XLU, XLV, XLY

Smooth Cloud + RSI Liquidity Spectrum + Zig Zag Volume ProfileSmooth Cloud + RSI Liquidity Spectrum + Zig Zag++ Volume Profile" Indicator
| Advanced Trend & Liquidity Analysis.
---
📌 Key Features & Enhancements (Zig Zag++)
This advanced indicator combines **trend-following moving averages, RSI momentum with liquidity factors, and an improved Zig Zag++ algorithm with volume profiling** for precise swing detection.
🔹 Zig Zag++ Upgrades:
✅ **Dynamic Reversal Detection** – Adapts to volatility using percentage-based pivots.
✅ **Volume-Weighted Swing Points** – Highlights high-liquidity turning points.
✅ **Multi-Timeframe Confirmation** – Uses historical pivots for stronger signals.
✅ **Volume Profile Clustering** – Reveals key support/resistance zones based on traded volume.
---
📊 Indicator Components Breakdown
1️⃣ Smooth Cloud (Trend Filter)
- **Fast MA (20-period) & Slow MA (50-period)** – Configurable as EMA, SMA, or WMA.
- **Cloud Coloring** – Green when fast MA > slow MA (bullish), red otherwise (bearish).
- **Purpose**: Acts as a trend filter—only take trades in the direction of the cloud.
2️⃣ RSI Liquidity Spectrum (Momentum + Volume)
- **RSI (14-period default)** – Standard momentum oscillator.
- **Liquidity-Adjusted Momentum** = `(RSI + ROC(RSI,3)) * (Volume / SMA(Volume, RSI Length))`
- **Purpose**: Identifies overbought/oversold conditions with volume confirmation (high volume = stronger signal).
3️⃣ Zig Zag++ (Swing Detection & Volume Profiling)
📈 Zig Zag Logic:**
- **Percentage-Based Reversals** (default: 5%) – Only plots swings exceeding this threshold.
- **Pivot Tracking** – Stores price & bar index of each swing point in arrays.
- **Dynamic Line Drawing** – Connects swing points with yellow trendlines.
📊 Volume Profile at Swings:
- **Lookback Period** (200 bars default) – Analyzes volume distribution between Zig Zag turns.
- **10-Price Bin Clustering** – Splits the price range into 10 levels and calculates traded volume at each.
- **Transparency Scaling** – Higher volume zones appear darker (stronger support/resistance).
---
🎯 Step-by-Step Trading Strategies
📈 Strategy 1: Trend-Following with RSI Liquidity Confirmation**
1. **Enter Long** when:
- Smooth Cloud is **green** (fast MA > slow MA).
- RSI Liquidity Momentum crosses above **30** (bullish momentum + volume).
- Price pulls back to the **Volume Profile high-volume zone** (demand area).
2. **Enter Short** when:
- Smooth Cloud is **red** (fast MA < slow MA).
- RSI Liquidity Momentum crosses below **70** (bearish momentum + volume).
- Price rallies into the **Volume Profile high-volume zone** (supply area).
3. **Exit** when:
- Zig Zag++ detects a new reversal (5% move against position).
- RSI Liquidity Momentum crosses back mid-level (50).
---
📉 Strategy 2: Swing Trading with Zig Zag++ Pivots**
1. **Buy at Swing Lows** when:
- Zig Zag++ prints a **higher low** (bullish structure).
- Volume Profile shows **strong absorption** (high volume at the low).
- RSI Liquidity Momentum is rising from oversold (<30).
2. **Sell at Swing Highs** when:
- Zig Zag++ prints a **lower high** (bearish structure).
- Volume Profile shows **distribution** (high volume at the top).
- RSI Liquidity Momentum is falling from overbought (>70).
3. **Stop Loss**:
- Below the recent Zig Zag low (for longs).
- Above the recent Zig Zag high (for shorts).
---
📌 Additional Enhancements (Pro Tips)**
- **Combine with Higher Timeframe (HTF) Cloud** – Use a 4H/1D cloud to filter trades.
- **Divergence Detection** – Hidden bullish/bearish divergences between Zig Zag & RSI Liquidity.
- **Volume Spike Confirmation** – Only trade if volume exceeds SMA(volume, 20) at reversal points.
---
🚀 Conclusion
This **all-in-one indicator** provides:
✔ **Trend direction** (Smooth Cloud)
✔ **Momentum + Liquidity strength** (RSI Spectrum)
✔ **Precise swing points** (Zig Zag++)
✔ **Volume-based S/R zones** (Profile Clustering)
Best used on **15M-4H timeframes** for swing/day trading. Adjust parameters based on asset volatility.

Crypto Options Greeks & Volatility Analyzer [BackQuant]Crypto Options Greeks & Volatility Analyzer
Overview
The Crypto Options Greeks & Volatility Analyzer is a comprehensive analytical tool that calculates Black-Scholes option Greeks up to the third order for Bitcoin and Ethereum options. It integrates implied volatility data from VOLMEX indices and provides multiple visualization layers for options risk analysis.
Quick Introduction to Options Trading
Options are financial derivatives that give the holder the right, but not the obligation, to buy or sell an underlying asset at a predetermined price (strike price) within a specific time period (expiration date). Understanding options requires grasping two fundamental concepts:
Call Options : Give the right to buy the underlying asset at the strike price. Calls increase in value when the underlying price rises above the strike price.
Put Options : Give the right to sell the underlying asset at the strike price. Puts increase in value when the underlying price falls below the strike price.
The Language of Options: Greeks
Options traders use "Greeks" - mathematical measures that describe how an option's price changes in response to various factors:
Delta : How much the option price moves for each $1 change in the underlying
Gamma : How fast delta changes as the underlying moves
Theta : Daily time decay - how much value erodes each day
Vega : Sensitivity to implied volatility changes
Rho : Sensitivity to interest rate changes
These Greeks are essential for understanding risk. Just as a pilot needs instruments to fly safely, options traders need Greeks to navigate market conditions and manage positions effectively.
Why Volatility Matters
Implied volatility (IV) represents the market's expectation of future price movement. High IV means:
Options are more expensive (higher premiums)
Market expects larger price swings
Better for option sellers
Low IV means:
Options are cheaper
Market expects smaller moves
Better for option buyers
This indicator helps you visualize and quantify these critical concepts in real-time.
Back to the Indicator
Key Features & Components
1. Complete Greeks Calculations
The indicator computes all standard Greeks using the Black-Scholes-Merton model adapted for cryptocurrency markets:
First Order Greeks:
Delta (Δ) : Measures the rate of change of option price with respect to underlying price movement. Ranges from 0 to 1 for calls and -1 to 0 for puts.
Vega (ν) : Sensitivity to implied volatility changes, expressed as price change per 1% change in IV.
Theta (Θ) : Time decay measured in dollars per day, showing how much value erodes with each passing day.
Rho (ρ) : Interest rate sensitivity, measuring price change per 1% change in risk-free rate.
Second Order Greeks:
Gamma (Γ) : Rate of change of delta with respect to underlying price, indicating how quickly delta will change.
Vanna : Cross-derivative measuring delta's sensitivity to volatility changes and vega's sensitivity to price changes.
Charm : Delta decay over time, showing how delta changes as expiration approaches.
Vomma (Volga) : Vega's sensitivity to volatility changes, important for volatility trading strategies.
Third Order Greeks:
Speed : Rate of change of gamma with respect to underlying price (∂Γ/∂S).
Zomma : Gamma's sensitivity to volatility changes (∂Γ/∂σ).
Color : Gamma decay over time (∂Γ/∂T).
Ultima : Third-order volatility sensitivity (∂²ν/∂σ²).
2. Implied Volatility Analysis
The indicator includes a sophisticated IV ranking system that analyzes current implied volatility relative to its recent history:
IV Rank : Percentile ranking of current IV within its 30-day range (0-100%)
IV Percentile : Percentage of days in the lookback period where IV was lower than current
IV Regime Classification : Very Low, Low, High, or Very High
Color-Coded Headers : Visual indication of volatility regime in the Greeks table
Trading regime suggestions based on IV rank:
IV Rank > 75%: "Favor selling options" (high premium environment)
IV Rank 50-75%: "Neutral / Sell spreads"
IV Rank 25-50%: "Neutral / Buy spreads"
IV Rank < 25%: "Favor buying options" (low premium environment)
3. Gamma Zones Visualization
Gamma zones display horizontal price levels where gamma exposure is highest:
Purple horizontal lines indicate gamma concentration areas
Opacity scaling : Darker shading represents higher gamma values
Percentage labels : Shows gamma intensity relative to ATM gamma
Customizable zones : 3-10 price levels can be analyzed
These zones are critical for understanding:
Pin risk around expiration
Potential for explosive price movements
Optimal strike selection for gamma trading
Market maker hedging flows
4. Probability Cones (Expected Move)
The probability cones project expected price ranges based on current implied volatility:
1 Standard Deviation (68% probability) : Shown with dashed green/red lines
2 Standard Deviations (95% probability) : Shown with dotted green/red lines
Time-scaled projection : Cones widen as expiration approaches
Lognormal distribution : Accounts for positive skew in asset prices
Applications:
Strike selection for credit spreads
Identifying high-probability profit zones
Setting realistic price targets
Risk management for undefined risk strategies
5. Breakeven Analysis
The indicator plots key price levels for options positions:
White line : Strike price
Green line : Call breakeven (Strike + Premium)
Red line : Put breakeven (Strike - Premium)
These levels update dynamically as option premiums change with market conditions.
6. Payoff Structure Visualization
Optional P&L labels display profit/loss at expiration for various price levels:
Shows P&L at -2 sigma, -1 sigma, ATM, +1 sigma, and +2 sigma price levels
Separate calculations for calls and puts
Helps visualize option payoff diagrams directly on the chart
Updates based on current option premiums
Configuration Options
Calculation Parameters
Asset Selection : BTC or ETH (limited by VOLMEX IV data availability)
Expiry Options : 1D, 7D, 14D, 30D, 60D, 90D, 180D
Strike Mode : ATM (uses current spot) or Custom (manual strike input)
Risk-Free Rate : Adjustable annual rate for discounting calculations
Display Settings
Greeks Display : Toggle first, second, and third-order Greeks independently
Visual Elements : Enable/disable probability cones, gamma zones, P&L labels
Table Customization : Position (6 options) and text size (4 sizes)
Price Levels : Show/hide strike and breakeven lines
Technical Implementation
Data Sources
Spot Prices : INDEX:BTCUSD and INDEX:ETHUSD for underlying prices
Implied Volatility : VOLMEX:BVIV (Bitcoin) and VOLMEX:EVIV (Ethereum) indices
Real-Time Updates : All calculations update with each price tick
Mathematical Framework
The indicator implements the full Black-Scholes-Merton model:
Standard normal distribution approximations using Abramowitz and Stegun method
Proper annualization factors (365-day year)
Continuous compounding for interest rate calculations
Lognormal price distribution assumptions
Alert Conditions
Four categories of automated alerts:
Price-Based : Underlying crossing strike price
Gamma-Based : 50% surge detection for explosive moves
Moneyness : Deep ITM alerts when |delta| > 0.9
Time/Volatility : Near expiration and vega spike warnings
Practical Applications
For Options Traders
Monitor all Greeks in real-time for active positions
Identify optimal entry/exit points using IV rank
Visualize risk through probability cones and gamma zones
Track time decay and plan rolls
For Volatility Traders
Compare IV across different expiries
Identify mean reversion opportunities
Monitor vega exposure across strikes
Track higher-order volatility sensitivities
Conclusion
The Crypto Options Greeks & Volatility Analyzer transforms complex mathematical models into actionable visual insights. By combining institutional-grade Greeks calculations with intuitive overlays like probability cones and gamma zones, it bridges the gap between theoretical options knowledge and practical trading application.
Whether you're:
A directional trader using options for leverage
A volatility trader capturing IV mean reversion
A hedger managing portfolio risk
Or simply learning about options mechanics
This tool provides the quantitative foundation needed for informed decision-making in cryptocurrency options markets.
Remember that options trading involves substantial risk and complexity. The Greeks and visualizations provided by this indicator are tools for analysis - they should be combined with proper risk management, position sizing, and a thorough understanding of options strategies.
As crypto options markets continue to mature and grow, having professional-grade analytics becomes increasingly important. This indicator ensures you're equipped with the same analytical capabilities used by institutional traders, adapted specifically for the unique characteristics of 24/7 cryptocurrency markets.

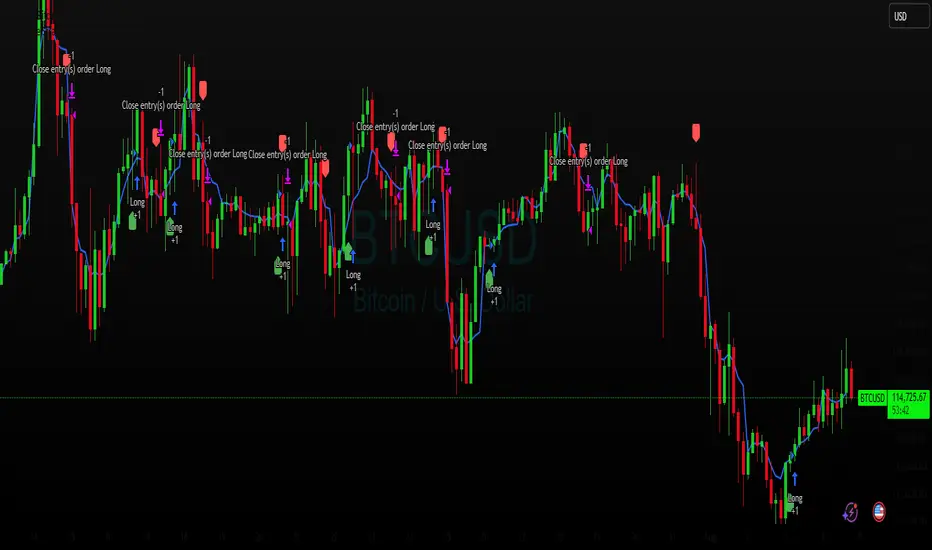
Profitable Pullback Strategy Mark804📝 Strategy Description: Pullback Trading Strategy v2.0 by Mark804
Overview
This strategy is a refined, trend-following pullback system designed to identify high-probability entry points within an established trend. Based on **EMA stacking**, it captures short-term retracements (pullbacks) in the direction of the larger trend. It has been fully updated to **Pine Script v5** with dynamic inputs, clear visualization, backtesting functionality, and risk management via stop loss and take profit.
---
🔧 How It Works
1. **Trend Detection**
The strategy first identifies a trend using a combination of four EMAs:
* **Fast EMA**
* **Signal EMA**
* **Medium EMA**
* **Slow EMA** (optional filter)
A valid trend is defined by **EMA stacking**:
* **Uptrend**: Fast > Signal > Medium (> Slow, if enabled)
* **Downtrend**: Fast < Signal < Medium (< Slow, if enabled)
This ensures the strategy trades **only in the direction of the dominant trend**, avoiding countertrend setups.
---
2. **Pullback Entry Conditions**
The strategy looks for pullbacks (retracements) within the confirmed trend:
*Buy Setup (Long Pullback)**:
* In an uptrend
* Price **closes below** the Signal EMA on the previous bar
* Then **closes back above** the Signal EMA on the current bar
* **Sell Setup (Short Pullback)**:
* In a downtrend
* Price **closes above** the Signal EMA on the previous bar
* Then **closes back below** the Signal EMA on the current bar
These conditions aim to enter on price dips or rallies that offer better entries while staying aligned with trend momentum.
---
3. **Entry & Exit Logic**
When a pullback signal is detected:
* A **market order** is placed in the trend direction
* A **take profit** and **stop loss** is applied immediately based on percentage inputs
Example:
* Take Profit: 2% above entry (for long)
* Stop Loss: 1% below entry (for long)
This creates a favorable **risk-to-reward ratio** and clear exit strategy.
---
4. **Customizable Inputs**
All key parameters can be tuned via the script’s settings panel:
* `maSrc`: Source for EMAs (default: `close`)
* `fastLen`, `signalLen`, `mediumLen`, `slLen`: EMA lengths
* `slEnabled`: Toggle to include the slow EMA as a trend filter
* `takeProfitPct`, `stopLossPct`: % values for TP and SL
* `showRibbon`: Toggle visibility of EMA lines (the "ribbon")
This flexibility allows optimization for different timeframes, assets, or market conditions.
---
5. **Visuals & Alerts**
* **EMA Ribbon**: Optionally plots all 4 EMAs in distinct colors
* **Alerts**: Configurable alerts for both Buy and Sell pullback signals
* **Strategy Tester**: Fully compatible with TradingView’s backtester to review performance
---
✅ Key Features
* Pine Script **v5** compatible
* Simple yet powerful **trend-pullback strategy**
* Built-in **risk management** (TP/SL)
* Highly **customizable** and easy to optimize
* Works on **any timeframe or market** (stocks, crypto, forex, etc.)
* Optional **EMA Ribbon** and slow filter for visual context
---
📊 Strategy Use Cases
* Intraday trading
* Swing trading
* Trend continuation setups
* Building automated systems in TradingView
* Manual trade confirmation for other systems
---
⚙️ Example Settings
| Parameter | Value |
| ----------------- | --------- |
| Fast EMA Length | 8 |
| Signal EMA Length | 13 |
| Medium EMA Length | 21 |
| Slow EMA Length | 55 |
| Take Profit (%) | 2.0 |
| Stop Loss (%) | 1.0 |
| Use Slow EMA | ✅ Enabled |
---
📌 Important Notes
* This is a **trend-following strategy**. Best results occur in trending markets.
* In sideways or choppy markets, false signals may occur. Consider using higher timeframes or combining with volume filters.
* You can expand this strategy further by integrating:
* Multi-timeframe trend confirmation
* Additional filters (e.g. RSI, MACD)
* Trailing stop loss for dynamic exits
* Visual overlays (e.g. pivot points, fractals) for added context

Moby Tick Prints - version 1.0.0Prints are aggregated by date and price. If there are multiple trades on the same day at the same price, they are added and represented in the Shares column

Fibonacci-Based Volume Flow (VFI)Fibonacci-based Volume Flow is an advanced next-generation evolution of LazyBear’s original VFI script that calculates and averages up to 21 Fibonacci-based VFI pairings to create a smoothed composite volume flow signal. This unique and powerful approach reduces noise, adapts to volatility, and provides a clearer view of trend strength and market structure across all timeframes. It also includes dynamic fibonacci guide levels, adaptive lookbacks, EMA crossovers, and structure-aware pivot labeling to help traders identify high-quality reversals, confirm directional bias, and detect divergences with greater precision. It's ideal for traders looking to enhance momentum analysis through volume-based confirmation.
🧠 Key Features🧠
🔹 Multi-VFI Fibonacci Fusion🔹
Blends up to 21 VFI signals (5, 13, 21, 34… up to 610) into smartly paired averages (e.g., 13/34, 55/144) — forming a smoothed composite VFI that’s more adaptive, less noisy, and highly responsive across market conditions.
🔸🔸 Dynamic Lookbacks🔸 🔸
Automatically adjusts histogram high/low tracking based on your chart’s timeframe — no more static tuning. Perfect for scalping fast charts or confirming long-term trends.
🟥🟩 Color-Coded Histogram🟥🟩
Visualizes VFI momentum with gradient coloring.
🧩🧩 Signal Crossovers 🧩🧩
Color-coded crossover lines persistently show bullish or bearish dominance.
Includes three powerful crossover systems:
➖5/13 VFI: Fast, early reversal detection
➖8/21 VFI: Swing-trading sweet spot
➖55/144 VFI: Trend confirmation across long cycles
🏷️ 🏷️Pivot Structure Labels🏷️🏷️
Labels oscillator swings with full structural logic:
➖HH, HL, LH, LL, EQ
➖Displays percent change, price at pivot, oscillator reading
➖Smart coloring detects divergence & trend continuation
📈 📈Dynamic Histogram Guides📈📈
Optional zero and ±50% bands anchor histogram levels based on real histogram extremes, not static thresholds — visually frame momentum shifts with context.
📍 📍Persistent High/Low Pivot Lines📍📍
Track the most significant histogram pivots (not price) across time, with smart labels:
➖Volume flow structure zones
➖Label shows price at pivot, oscillator level, and bars since event
➖Ideal for spotting divergence zones, momentum failures, and trend exhaustion.
🔍 🔍Volatility Table (ATR%)🔍🔍
💡Shows real-time volatility compression or expansion
💡Uses multiple ATR periods (e.g., 14 & 55) for short- and medium-term comparison
💡Helps traders understand whether momentum is likely to continue or stall
🔩🔩Volume-weighted VFI baselines🔩🔩
🟢A daily session-based VWAP of the VFI, which resets each day and highlights intraday volume flow context.
🟠A rolling VWA of VFI, which acts like a VWMA over a fixed window (e.g., 55 bars), smoothing short-term fluctuations and supporting trend/momentum confirmation.
These VWAP-style overlays help traders identify strength vs. weakness relative to volume-weighted baselines — useful for divergence spotting, mean reversion setups, or breakout confirmation.
🧰 🧰Under the Hood: How It Works🧰🧰
🔧 Core VFI Logic
Based on LazyBear’s foundational VFI:
➖Uses log returns of price (HLC3)
➖Filters insignificant moves using volatility-weighted thresholds
➖Normalizes volume via adaptive capping (e.g., 2.5× average)
🌀 Composite Blend System
Each VFI instance is smoothed and then fused via user-selectable pairs. This creates a customizable average VFI representing short, mid, and long-term pressure — one value, many time horizons.
📊 EMA Signal Layer
Crosses trigger persistent color shifts in signal lines, making trend strength clear at a glance.
VFI blend feeds into EMA crossovers. You can toggle visibility for:
➖Fast (5/13)
➖Medium (8/21)
➖Slow (55/144)
🧭 Pivot Framework
Structure logic only compares pivots on same-side polarity:
➖Highs compare to highs above zero
➖Lows compare to lows below zero
This avoids nonsensical comparisons and preserves logical sequences (HH → LH → HL).
🧱 Dynamic Labels
All pivots and persistent levels display:
➖Oscillator value
➖Price value
➖Structure tag (e.g., LH, HL)
➖% change from prior pivot
➖Lookback info
➖Bar age
Unlike traditional VFI:
✅ It blends timeframes with Fibonacci precision
✅ Uses dynamic, volatility-aware logic
✅ Embeds visual structure & divergence intelligence
✅ Enhances entry confidence and exit timing
🔧 This isn’t just an indicator — it’s a volume-informed decision engine.
Ideal For:
🔶Trend-followers wanting cleaner volume-based confirmation
🔶Reversal traders spotting structure + divergence
🔶Scalpers or investors needing adaptable signals
🔶Those who loved LazyBear's VFI
📌 Final Note:
As powerful as Fibonacci Blended Volume Flow is, no single indicator should be used in isolation. For best results, combine it with price action analysis, higher-timeframe context, and complementary tools like trendlines, moving averages, or support/resistance levels. Use it as part of a well-rounded trading approach to confirm setups — not to define them alone.

PulseWave Strategy Markking77PulseWave Strategy (Markking77) — Description & Indicator Roadmap
PulseWave Strategy (Markking77) is a sleek, straightforward trading system that fuses three powerful market indicators — VWAP, MACD, and RSI — into one harmonious tool. Designed for traders who want clear, actionable signals, this strategy captures trend direction, momentum shifts, and market strength to help you spot optimal entry and exit points.
Step 1: VWAP — The Market Trend Compass (Color: Blue)
What it does:
The Volume Weighted Average Price (VWAP) is the average price a security has traded at throughout the day, weighted by volume. It acts as a dynamic benchmark that many institutional traders rely on.
Why it matters:
Price above the VWAP (blue line) signals bullish momentum — buyers dominate.
Price below the VWAP signals bearish momentum — sellers in control.
PulseWave use:
VWAP sets the trend foundation — we trade in the direction the price sits relative to VWAP.
Step 2: MACD — Momentum Confirmation (Colors: Orange & Blue)
What it does:
MACD tracks momentum by comparing short-term and long-term moving averages, using the MACD line and a signal line to indicate shifts.
Why it matters:
When the MACD line (orange) crosses above the Signal line (blue), it signals rising momentum — a bullish cue.
When the MACD line crosses below the signal line, it signals weakening momentum — bearish cue.
PulseWave use:
MACD confirms momentum that aligns with the VWAP trend before entering trades.
Step 3: RSI — The Strength Filter (Color: Purple)
What it does:
The Relative Strength Index (RSI) measures how fast prices are changing to indicate overbought or oversold conditions.
Why it matters:
RSI above 70 = overbought (possible reversal or pause).
RSI below 30 = oversold (potential bounce).
PulseWave use:
RSI filters out trades taken at extreme price levels, avoiding entries that are too stretched.
Color-Coded Roadmap Summary:
Step Indicator Role Buy Signal Sell Signal Color
1 VWAP Trend Direction Price > VWAP (bullish) Price < VWAP (bearish) Blue
2 MACD Momentum Confirmation MACD line crosses above Signal line MACD line crosses below Signal line Orange & Blue
3 RSI Entry Filter RSI < 70 (not overbought) RSI > 30 (not oversold) Purple
How PulseWave Strategy Works:
Buy when price sits above VWAP, MACD line crosses above the Signal line, and RSI is below 70.
Sell (exit) when price drops below VWAP, MACD line crosses below the Signal line, and RSI is above 30.
This layered approach ensures you only trade when trend, momentum, and strength align — reducing false signals and improving your edge.
Why Use PulseWave Strategy?
Clear & Simple: No guesswork — clear color-coded signals guide your decisions.
Robust: Combines trend, momentum, and strength in one system.
Versatile: Fits day trading and swing trading styles alike.
Visual: Easily interpreted signals with minimal clutter.
Hurst Exponent Adaptive Filter (HEAF) [PhenLabs]📊 PhenLabs - Hurst Exponent Adaptive Filter (HEAF)
Version: PineScript™ v6
📌 Description
The Hurst Exponent Adaptive Filter (HEAF) is an advanced Pine Script indicator designed to dynamically adjust moving average calculations based on real time market regimes detected through the Hurst Exponent. The intention behind the creation of this indicator was not a buy/sell indicator but rather a tool to help sharpen traders ability to distinguish regimes in the market mathematically rather than guessing. By analyzing price persistence, it identifies whether the market is trending, mean-reverting, or exhibiting random walk behavior, automatically adapting the MA length to provide more responsive alerts in volatile conditions and smoother outputs in stable ones. This helps traders avoid false signals in choppy markets and capitalize on strong trends, making it ideal for adaptive trading strategies across various timeframes and assets.
Unlike traditional moving averages, HEAF incorporates fractal dimension analysis via the Hurst Exponent to create a self-tuning filter that evolves with market conditions. Traders benefit from visual cues like color coded regimes, adaptive bands for volatility channels, and an information panel that suggests appropriate strategies, enhancing decision making without constant manual adjustments by the user.
🚀 Points of Innovation
Dynamic MA length adjustment using Hurst Exponent for regime-aware filtering, reducing lag in trends and noise in ranges.
Integrated market regime classification (trending, mean-reverting, random) with visual and alert-based notifications.
Customizable color themes and adaptive bands that incorporate ATR for volatility-adjusted channels.
Built-in information panel providing real-time strategy recommendations based on detected regimes.
Power sensitivity parameter to fine-tune adaptation aggressiveness, allowing personalization for different trading styles.
Support for multiple MA types (EMA, SMA, WMA) within an adaptive framework.
🔧 Core Components
Hurst Exponent Calculation: Computes the fractal dimension of price series over a user-defined lookback to detect market persistence or anti-persistence.
Adaptive Length Mechanism: Maps Hurst values to MA lengths between minimum and maximum bounds, using a power function for sensitivity control.
Moving Average Engine: Applies the chosen MA type (EMA, SMA, or WMA) to the adaptive length for the core filter line.
Adaptive Bands: Creates upper and lower channels using ATR multiplied by a band factor, scaled to the current adaptive length.
Regime Detection: Classifies market state with thresholds (e.g., >0.55 for trending) and triggers alerts on regime changes.
Visualization System: Includes gradient fills, regime-colored MA lines, and an info panel for at-a-glance insights.
🔥 Key Features
Regime-Adaptive Filtering: Automatically shortens MA in mean-reverting markets for quick responses and lengthens it in trends for smoother signals, helping traders stay aligned with market dynamics.
Custom Alerts: Notifies on regime shifts and band breakouts, enabling timely strategy adjustments like switching to trend-following in bullish regimes.
Visual Enhancements: Color-coded MA lines, gradient band fills, and an optional info panel that displays market state and trading tips, improving chart readability.
Flexible Settings: Adjustable lookback, min/max lengths, sensitivity power, MA type, and themes to suit various assets and timeframes.
Band Breakout Signals: Highlights potential overbought/oversold conditions via ATR-based channels, useful for entry/exit timing.
🎨 Visualization
Main Adaptive MA Line: Plotted with regime-based colors (e.g., green for trending) to visually indicate market state and filter position relative to price.
Adaptive Bands: Upper and lower lines with gradient fills between them, showing volatility channels that widen in random regimes and tighten in trends.
Price vs. MA Fills: Color-coded areas between price and MA (e.g., bullish green above MA in trending modes) for quick trend strength assessment.
Information Panel: Top-right table displaying current regime (e.g., "Trending Market") and strategy suggestions like "Follow trends" or "Trade ranges."
📖 Usage Guidelines
Core Settings
Hurst Lookback Period
Default: 100
Range: 20-500
Description: Sets the period for Hurst Exponent calculation; longer values provide more stable regime detection but may lag, while shorter ones are more responsive to recent changes.
Minimum MA Length
Default: 10
Range: 5-50
Description: Defines the shortest possible adaptive MA length, ideal for fast responses in mean-reverting conditions.
Maximum MA Length
Default: 200
Range: 50-500
Description: Sets the longest adaptive MA length for smoothing in strong trends; adjust based on asset volatility.
Sensitivity Power
Default: 2.0
Range: 1.0-5.0
Description: Controls how aggressively the length adapts to Hurst changes; higher values make it more sensitive to regime shifts.
MA Type
Default: EMA
Options: EMA, SMA, WMA
Description: Chooses the moving average calculation method; EMA is more responsive, while SMA/WMA offer different weighting.
🖼️ Visual Settings
Show Adaptive Bands
Default: True
Description: Toggles visibility of upper/lower bands for volatility channels.
Band Multiplier
Default: 1.5
Range: 0.5-3.0
Description: Scales band width using ATR; higher values create wider channels for conservative signals.
Show Information Panel
Default: True
Description: Displays regime info and strategy tips in a top-right panel.
MA Line Width
Default: 2
Range: 1-5
Description: Adjusts thickness of the main MA line for better visibility.
Color Theme
Default: Blue
Options: Blue, Classic, Dark Purple, Vibrant
Description: Selects color scheme for MA, bands, and fills to match user preferences.
🚨 Alert Settings
Enable Alerts
Default: True
Description: Activates notifications for regime changes and band breakouts.
✅ Best Use Cases
Trend-Following Strategies: In detected trending regimes, use the adaptive MA as a trailing stop or entry filter for momentum trades.
Range Trading: During mean-reverting periods, monitor band breakouts for buying dips or selling rallies within channels.
Risk Management in Random Markets: Reduce exposure when random walk is detected, using tight stops suggested in the info panel.
Multi-Timeframe Analysis: Apply on higher timeframes for regime confirmation, then drill down to lower ones for entries.
Volatility-Based Entries: Use upper/lower band crossovers as signals in adaptive channels for overbought/oversold trades.
⚠️ Limitations
Lagging in Transitions: Regime detection may delay during rapid market shifts, requiring confirmation from other tools.
Not a Standalone System: Best used in conjunction with other indicators; random regimes can lead to whipsaws if traded aggressively.
Parameter Sensitivity: Optimal settings vary by asset and timeframe, necessitating backtesting.
💡 What Makes This Unique
Hurst-Driven Adaptation: Unlike static MAs, it uses fractal analysis to self-tune, providing regime-specific filtering that's rare in standard indicators.
Integrated Strategy Guidance: The info panel offers actionable tips tied to regimes, bridging analysis and execution.
Multi-Regime Visualization: Combines adaptive bands, colored fills, and alerts in one tool for comprehensive market state awareness.
🔬 How It Works
Hurst Exponent Computation:
Calculates log returns over the lookback period to derive the rescaled range (R/S) ratio.
Normalizes to a 0-1 value, where >0.55 indicates trending, <0.45 mean-reverting, and in-between random.
Length Adaptation:
Maps normalized Hurst to an MA length via a power function, clamping between min and max.
Applies the selected MA type to close prices using this dynamic length.
Visualization and Signals:
Plots the MA with regime colors, adds ATR-based bands, and fills areas for trend strength.
Triggers alerts on regime changes or band crosses, with the info panel suggesting strategies like momentum riding in trends.
💡 Note:
For optimal results, backtest settings on your preferred assets and combine with volume or momentum indicators. Remember, no indicator guarantees profits—use with proper risk management. Access premium features and support at PhenLabs.

Sat Stacking Strategies Simulation (SSSS)Sat Stacking Strategies Simulation (SSSS)
This indicator simulates and compares different Bitcoin stacking strategies over time, allowing you to visualize performance, cost basis, and stacking behavior directly on your chart.
Core Features:
Three Stacking Strategies
• Trend-Based – Stack only when price is above/below a long-term SMA.
• Stack the Dip – Buy during sharp pullbacks or oversold conditions.
• Price Zone – Stack only in “cheap”, “fair”, or “expensive” zones based on a simulated Short-Term Holder (STH) cost basis.
Always Stack Benchmark
Compare your chosen strategy against a simple “Always Stack” approach for a real-world DCA reference.
Performance Metrics Table
Track:
• Total Fiat Added
• Total BTC Accumulated
• Current Value
• Average Cost per BTC
• PnL %
• CAGR
• Sharpe Ratio & Stdev
• Stack Events & Time Underwater
Advanced Options
• Simulate cash-secured puts on unused fiat.
• Simulate covered calls on BTC holdings.
• Roll over unused stacking amounts for future buys.
This tool is designed for Bitcoiners, stackers, and DCA enthusiasts who want to backtest and visualize their stacking plan—whether you keep it simple or go full quant.
Sometimes the best alpha is just showing up every week with your wallet open… and occasionally wearing a helmet. 🪖💰

Ayman – Full Smart Suite Auto/Manual Presets + PanelIndicator Name
Ayman – Full Smart Suite (OB/BoS/Liq/FVG/Pin/ADX/HTF) + Auto/Manual Presets + Panel
This is a multi-condition trading tool for TradingView that combines advanced Smart Money Concepts (SMC) with classic technical filters.
It generates BUY/SELL signals, draws Stop Loss (SL) and Take Profit (TP1, TP2) levels, and displays a control panel with all active settings and conditions.
1. Main Features
Smart Money Concepts Filters:
Order Block (OB) Zones
Break of Structure (BoS)
Liquidity Sweeps
Fair Value Gaps (FVG)
Pin Bar patterns
ADX filter
Higher Timeframe EMA filter (HTF EMA)
Two Operating Modes:
Auto Presets: Automatically adjusts all settings (buffers, ATR multipliers, RR, etc.) based on your chart timeframe (M1/M5/M15).
Manual Mode: Fully customize all parameters yourself.
Trade Management Levels:
Stop Loss (SL)
TP1 – partial profit
TP2 – full profit
Visual Panel showing:
Current settings
Filter status
Trend direction
Last swing levels
SL/TP status
Alerts for BUY/SELL conditions
2. Entry Conditions
A BUY signal is generated when all these are true:
Trend: Price above EMA (bullish)
HTF EMA: Higher timeframe trend also bullish
ADX: Trend strength above threshold
OB: Price in a valid bullish Order Block zone
BoS: Structure break to the upside
Liquidity Sweep: Sweep of recent lows in bullish context
FVG: A bullish Fair Value Gap is present
Pin Bar: Bullish Pin Bar pattern detected (if enabled)
A SELL signal is generated when the opposite conditions are met.
3. Stop Loss & Take Profits
SL: Placed just beyond the last swing low (BUY) or swing high (SELL), with a small ATR buffer.
TP1: Partial profit target, defined as a ratio of the SL distance.
TP2: Full profit target, based on Reward:Risk ratio.
4. How to Use
Step 1 – Apply Indicator
Open TradingView
Go to your chart (recommended: XAUUSD, M1/M5 for scalping)
Add the indicator script
Step 2 – Choose Mode
AUTO Mode: Leave “Use Auto Presets” ON – parameters adapt to your timeframe.
MANUAL Mode: Turn Auto OFF and adjust all lengths, buffers, RR, and filters.
Step 3 – Filters
In the Filters On/Off section, enable/disable specific conditions (OB, BoS, Liq, FVG, Pin Bar, ADX, HTF EMA).
Step 4 – Trading the Signals
Wait for a BUY or SELL arrow to appear.
SL and TP levels will be plotted automatically.
TP1 can be used for partial close and TP2 for full exit.
Step 5 – Alerts
Set alerts via BUY Signal or SELL Signal to receive notifications.
5. Best Practices
Scalping: Use M1 or M5 with AUTO mode for gold or forex pairs.
Swing Trading: Use M15+ and adjust buffers/ATR manually.
Combine with price action confirmation before entering trades.
For higher accuracy, wait for multiple filter confirmations rather than acting on the first arrow.
6. Summary Table
Feature Purpose Can Disable?
Order Block Finds key supply/demand zones ✅
Break of Structure Detects trend continuation ✅
Liquidity Sweep Finds stop-hunt moves ✅
Fair Value Gap Confirms imbalance entries ✅
Pin Bar Price action reversal filter ✅
ADX Trend strength filter ✅
HTF EMA Higher timeframe confirmation ✅

ZenAlgo - ADXThis open-source indicator builds upon the official Average Directional Index (ADX) implementation by TradingView. It preserves the core logic of the original ADX while introducing additional visualization features, configurability, and analytical overlays to assist with directional strength analysis.
Core Calculation
The script computes the ADX, +DI, and -DI based on smoothed directional movement and true range over a user-defined length. The smoothing is performed using Wilder’s method, as in the original implementation.
True Range is calculated from the current high, low, and previous close.
Directional Movement components (+DM, -DM) are derived by comparing the change in highs and lows between consecutive bars.
These values are then smoothed, and the +DI and -DI are expressed as percentages of the smoothed True Range.
The difference between +DI and -DI is normalized to derive DX, which is further smoothed to yield the ADX value.
The indicator includes a selectable signal line (SMA or EMA) applied to the ADX for crossover-based visualization.
Visualization Enhancements
Several plots and conditions have been added to improve interpretability:
Color-coded histograms and lines visualize DI relative to a configurable threshold (default: 25). Colors follow the ZenAlgo color scheme.
Dynamic opacity and gradient coloring are used for both ADX and DI components, allowing users to distinguish weak/moderate/strong directional trends visually.
Mirrored ADX is internally calculated for certain overlays but not directly plotted.
The script also provides small circles and diamonds to highlight:
Crossovers between ADX and its signal line.
DI crossing above or below the 25 threshold.
Rising ADX confirmed by rising DI values, with point size reflecting ADX strength.
Divergence Detection
The indicator includes optional detection of fractal-based divergences on the DI curve:
Regular and hidden bullish and bearish divergences are identified based on relative fractal highs/lows in both price and DI.
Detected divergences are optionally labeled with 'R' (Regular) or 'H' (Hidden), and color-coded accordingly.
Fractal points are defined using 5-bar patterns to ensure consistency and reduce false positives.
ADX/DI Table
When enabled, a floating table displays live values and summaries:
ADX value , trend direction (rising/falling), and qualitative strength.
DI composite , trend direction, and relative strength.
Contextual power dynamics , describing whether bulls or bears are gaining or losing strength.
The background colors of the table reflect current trend strength and direction.
Interpretation Guidelines
ADX indicates the strength of a trend, regardless of its direction. Values below 20 are often considered weak, while those above 40 suggest strong trending conditions.
+DI and -DI represent bullish and bearish directional movements, respectively. Crossovers between them are used to infer trend direction.
When ADX is rising and either +DI or -DI is dominant and increasing, the trend is likely strengthening.
Divergences between DI and price may suggest potential reversals but should be interpreted cautiously and not in isolation.
The threshold line (default 25) provides a basic filter for ignoring low-strength conditions. This can be adjusted depending on the market or timeframe.
Added Value over Existing Indicators
Fully color-graded ADX and DI display for better visual clarity.
Optional signal MA over ADX with crossover markers.
Rich contextual labeling for both divergence and threshold events.
Power dynamics commentary and live table help users contextualize current momentum.
Customizable options for smoothing type, divergence display, table position, and visual offsets.
These additions aim to improve situational awareness without altering the fundamental meaning of ADX/DI values.
Limitations and Disclaimers
As with any ADX-based tool, this indicator does not indicate market direction alone —it measures strength, not trend bias.
Divergence detection relies on fractal patterns and may lag or produce false positives in sideways markets.
Signal MA crossovers and DI threshold breaks are not entry signals , but contextual markers that may assist with timing or filtering other systems.
The table text and labels are for visual assistance and do not replace proper technical analysis or market context.

Multi-Timeframe SFP + SMTImportant: Please Read First
This indicator is not a "one size fits all" solution. It is a professional and complex tool that requires you to learn how to use it, in addition to backtesting different settings to discover what works best for your specific trading style and the assets you trade. The default settings provided are my personal preferences for trading higher-timeframe setups, but you are encouraged to experiment and find your own optimal configuration.
Please note that while this initial version is solid, it may still contain small errors or bugs. I will be actively working on improving the indicator over time. Also, be aware that the script is not written for maximum efficiency and may be resource-intensive, but this should not pose a problem for most users.
The source code for this indicator is open. If you truly want to understand precisely how all the logic works, you can copy and paste the code into an AI assistant like Gemini or ChatGPT and ask it to explain any part of the script to you.
Author's Preferred Settings (Guideline)
As a starting point, here are the settings I personally use for my trading:
SFP Timeframe: 4-Hour (Strength: 5-5)
Max Lookback: 35 Bars
Raid Expiration: 1 Bar
SFP Lines Limit: 1
SMT Timeframe 1: 30-Minute (Strength: 2-2) with 3-Minute LTF Detection.
SMT Timeframe 2: 15-Minute (Strength: 3-3) with 3-Minute LTF Detection.
SMT Timeframe 3: 1-Hour (Strength: 1-1) with 3-Minute LTF Detection.
SMT Timeframe 4: 15-Minute (Strength: 1-1) with 3-Minute LTF Detection.
Multi-Timeframe SMT: An Overview
This indicator is a powerful tool designed to identify high-probability trading setups by combining two key institutional concepts: Swing Failure Patterns (SFP) on a higher timeframe and Smart Money Technique (SMT) divergences on a lower timeframe. A key feature is the ability to configure and run up to four independent SMT analyses simultaneously, allowing you to monitor for divergences across multiple timeframes (e.g., 15m, 1H, 4H) from a single indicator.
Its primary purpose is to generate automated signals through TradingView's alert system. By setting up alerts, the script runs server-side, monitoring the market for you. When a setup presents itself, it will send a push notification to your device, allowing you to personally evaluate the trade without being tied to your screen.
The Strategy: HTF Liquidity Sweeps into LTF SMT
The core strategy is built on a classic institutional trading model:
Wait for a liquidity sweep on a significant high timeframe (e.g., 4-hour, Daily).
Once liquidity is taken, look for a confirmation of a shift in market structure on a lower timeframe.
This indicator uses an SMT divergence as that confirmation signal, indicating that smart money may be stepping in to reverse the price.
How It Works: The Two-Step Process
The indicator's logic follows a precise two-step process to generate a signal:
Step 1: The Swing Failure Pattern (SFP)
First, the indicator identifies a high-timeframe liquidity sweep. This is configured in the "Swing Failure Pattern (SFP) Timeframe" settings.
It looks for a candle that wicks above a previous high (or below a previous low) but then closes back within the range of that pivot. This action is known as a "raid" or a "swing failure," suggesting the move failed to find genuine momentum.
Step 2: The SMT Divergence
The moment a valid SFP is confirmed, the indicator's multiple SMT engines activate.
Each engine begins monitoring the specific SMT timeframe you have configured (e.g., "SMT Timeframe 1," "SMT Timeframe 2," etc.) for a Smart Money Technique (SMT) divergence.
An SMT divergence occurs when two closely correlated assets fail to move in sync. For example, after a raid on a high, Asset A makes a new high, but Asset B fails to do so. This disagreement suggests weakness and a potential reversal.
When the script finds this divergence, it plots the SMT line and triggers an alert.
The Power of Alerts
The true strength of this indicator lies in its alert capabilities. You can create alerts for both unconfirmed and confirmed SMTs.
Enable Alerts LTF Detection: These alerts trigger when an unconfirmed, potential SMT is spotted on the lower "LTF Detection" timeframe. While not yet confirmed, these early alerts can notify you of a potential move before it fully happens, allowing you to be ahead of the curve and find the best possible trade entries.
Enable Alerts Confirmed SMT: These alerts trigger only when a permanent, confirmed SMT line is plotted on your chosen SMT timeframe. These signals are more reliable but occur later than the early detection alerts.
Key Concepts Explained
What is Pivot Strength?
Pivot Strength determines how significant a high or low needs to be to qualify as a valid structural point. A setting of 5-5, for example, means that for a candle's high to be considered a valid pivot high, its high must be higher than the highs of the 5 candles to its left and the 5 candles to its right.
Higher Strength (e.g., 5-5, 8-8): Creates fewer, but more significant, pivots. This is ideal for identifying major structural highs and lows on higher timeframes.
Lower Strength (e.g., 2-2, 3-3): Creates more pivots, making it suitable for identifying the smaller shifts in momentum on lower timeframes.
Raid Expiration & Validity
An SFP signal is not valid forever. The "Raid Expiration" setting determines how many SFP timeframe bars can pass after a raid before that signal is considered "stale" and can no longer be used to validate an SMT. This ensures your SMT divergences are always in response to recent liquidity sweeps.
Why You Must Be on the Right Chart Timeframe to See SMT Lines
Pine Script™ has a fundamental rule: an indicator running on a chart can only "see" the bars of that chart's timeframe or higher.
When the SMT logic is set to the 15-minute timeframe, it calculates its pivots based on 15-minute data. To accurately plot lines connecting these pivots, you must be on a 15-minute chart or lower (e.g., 5-minute, 1-minute).
If you are on a higher timeframe chart, like the 1-hour, the 15-minute bars do not exist on that chart, so the indicator has no bars to draw the lines on.
This is precisely why the alert system is so powerful. You can set your alert to run on the 15-minute timeframe, and TradingView's servers will monitor that timeframe for you, sending a notification regardless of what chart you are currently viewing.

Ayman Entry Signal – Ultimate PRO (Scalping Gold Settings)1. Overview
This indicator is a professional gold scalping tool built for TradingView using Pine Script v6.
It combines multiple price action and technical filters to generate high-probability Buy/Sell signals with built-in trade management features (TP1, TP2, SL, Break Even, Partial Close, Stats tracking).
It is optimized for XAUUSD but can be applied to other assets with proper setting adjustments.
2. Key Features
Multi-Condition Trade Signals – EMA trend, Break of Structure, Order Blocks, FVG, Liquidity Sweeps, Pin Bars, Higher Timeframe confirmation, Trend Cloud, SMA Cross, and ADX.
Full Trade Management – Auto-calculates lot size, SL, TP1, TP2, Break Even, Partial Close.
Dynamic Chart Drawing – Entry lines, SL/TP lines, trade boxes, and real-time PnL.
Statistics Panel – Tracks wins, losses, breakeven trades, and total PnL over selected dates.
Customizable Filters – All filters can be turned ON/OFF to match your strategy.
3. Main Inputs & Settings
Account Settings
Capital ($) – Total trading capital.
Risk Percentage (%) – Risk per trade.
TP to SL Ratio – Risk-to-reward ratio.
Value Per Point ($) – Value per pip/point for lot size calculation.
SL Buffer – Extra points added to SL to avoid stop hunts.
Take Profit Settings
TP1 % of Full Target – Fraction of TP1 compared to TP2.
Move SL to Entry after TP1? – Activates Break Even after TP1.
Break Even Buffer – Extra points when moving SL to BE.
Take Partial Close at TP1 – Option to close half at TP1.
Signal Filters
ATR Period – For SL/TP calculation buffer.
EMA Trend – Uses EMA 9/21 crossover for trend.
Break of Structure (BoS) – Requires structure break confirmation.
Order Block (OB) – Validates trades within OB zones.
Fair Value Gap (FVG) – Confirms trades inside FVGs.
Liquidity Sweep – Checks if liquidity zones are swept.
Pin Bar Confirmation – Uses candlestick patterns for extra confirmation.
Pin Bar Body Ratio – Controls strictness of Pin Bar filter.
Higher Timeframe Filters (HTF)
HTF EMA Confirmation – Confirms lower timeframe trades with higher timeframe trend.
HTF BoS – Confirms with higher timeframe structure break.
HTF Timeframe – Selects higher timeframe.
Advanced Filters
SuperTrend Filter – Confirms trades based on SuperTrend.
ADX Filter – Filters out low volatility periods.
SMA Cross Filter – Uses SMA 8/9 cross as filter.
Trend Cloud Filter – Uses EMA 50/200 as a cloud trend filter.
4. How It Works
Buy Signal Conditions
EMA 9 > EMA 21 (trend bullish)
Optional filters (BoS, OB, FVG, Liquidity Sweep, Pin Bar, HTF confirmations, ADX, SMA Cross, Trend Cloud) must pass if enabled.
When all active filters pass → Buy signal triggers.
Sell Signal Conditions
EMA 9 < EMA 21 (trend bearish)
Same filtering process but for bearish conditions.
When all active filters pass → Sell signal triggers.
5. Trade Execution & Management
When a signal triggers:
Lot size is auto-calculated based on risk % and SL distance.
SL is placed beyond recent swing high/low + ATR buffer.
TP1 and TP2 are calculated from the SL using the reward-to-risk ratio.
Break Even: If enabled, SL moves to entry price after TP1 is hit.
Partial Close: If enabled, half of the position closes at TP1.
Trade Exit: Full exit at TP2, SL hit, or partial close at TP1.
6. Chart Display
Entry Line – Shows entry price.
SL Line – Red dashed line at stop loss level.
TP1 Line – Lime dashed line for TP1.
TP2 Line – Green dashed line for TP2.
PnL Labels – Displays real-time profit/loss in $.
Trade Box – Visual area showing trade range.
Pin Bar Shapes – Optional, marks Pin Bars.
7. Statistics Panel
Stats Header – Shows “Stats”.
Total Trades
Wins
Losses
Breakeven Trades
Total PnL
Can be reset or filtered by date.
8. How to Use
Load the Indicator in TradingView.
Select Gold (XAUUSD) on your preferred scalping timeframe (1m, 5m, 15m).
Adjust settings:
Use default gold scalping settings for quick start.
Enable/disable filters according to your style.
Wait for a Buy/Sell alert.
Confirm visually that all desired conditions align.
Place trade with calculated lot size, SL, and TP levels shown on chart.
Let trade run – the indicator manages Break Even & Partial Close if enabled.
9. Recommended Timeframes
Scalping: 1m, 5m, 15m
Day Trading: 15m, 30m, 1H
Swing: 4H, Daily (adjust settings accordingly)

ZigZag Volume Profile [ChartPrime]⯁ OVERVIEW
ZigZag Volume Profile combines swing structure with volume analytics by plotting a ZigZag of major price swings and overlaying a detailed volume profile around each swing. At the end of each swing, it highlights the Point of Control (POC) — the price level with the highest traded volume — and extends it forward to identify key areas of potential support or resistance.
⯁ KEY FEATURES
ZigZag Swing Detection:
Automatically detects swing highs and lows based on a user-defined length, creating clean visual segments of market structure.
These segments act as boundaries for volume profile calculations.
swingHigh = ta.highest(swingLength)
swingLow = ta.lowest(swingLength)
ZigZag Channel Visualization:
The ZigZag structure is connected with sloped lines, forming a visual “channel” of the price movement.
The ZigZag can optionally, scaled by ATR.
Volume Profile Around Each Swing:
For every completed swing (high to low or low to high), the indicator constructs a full volume profile using user-defined bin counts.
It scans volume across price levels in the swing and plots histogram-style bins using a gradient color to indicate volume magnitude.
Dynamic Bin Width and Slope Adjustment:
Bins are distributed across a vertical ATR-based range, and their width is adjusted based on the percentage of total swing volume.
The volume fill direction is adapted to the swing’s slope for visually aligned plotting.
POC Detection and Extension:
The highest volume bin in each swing is identified as the Point of Control (POC).
This level is plotted with a thicker line and extended horizontally into the future as a key reaction level.
Automatic POC Expiry on Price Interaction:
POC lines are continuously extended unless breached by price.
When price crosses the POC level, the extension is terminated — signaling that the level may have been absorbed.
Clean Volume Bin Visualization:
Bin colors range from green (low volume) to blue (higher volume), with the POC always marked in red by default for easy identification.
Volume percentages are optionally labeled at each bin level.
Flexible Swing Profile Parameters:
Users can control:
Number of volume bins
Bin width
Channel width (ATR factor)
Visibility of the swing channel or POC lines
Efficient Memory Handling:
Old POC lines and volume profiles are automatically removed from memory after a threshold to keep charts clean and performant.
⯁ USAGE
Use ZigZag swings to define market structure visually.
Analyze volume profile around each swing to understand where most trading activity occurred.
Use POC extensions as dynamic support/resistance zones for entries, stops, or take-profits.
Watch for price interaction with extended POC lines — breaks may suggest absorbed liquidity or breakout potential.
Use the ATR-based channel width to adapt profiles based on market volatility.
⯁ CONCLUSION
ZigZag Volume Profile offers a powerful fusion of structure and volume. By plotting detailed volume profiles over each price swing and extending the POC as actionable S/R levels, this tool provides deep insight into market participation zones — giving traders a tactical edge in both ranging and trending environments.

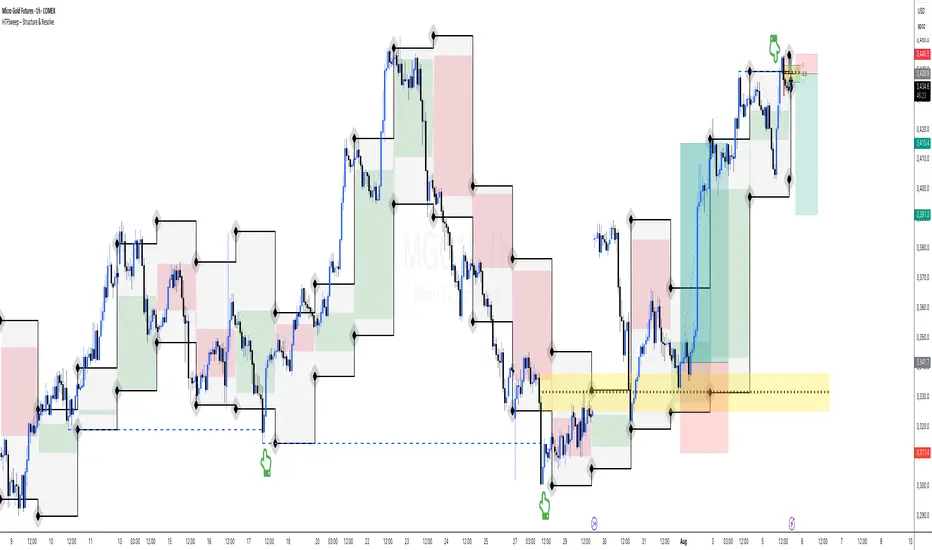
HTFSweep – Structure & ResolveThis indicator isolates higher timeframe Open, High, Low, and Close levels and projects them onto lower timeframes.
It is designed as a structural lens, not a trading signal — a tool for experienced operators who study how intraday price interacts with higher‑timeframe liquidity anchors.
Key Features:
Selectable higher timeframe (default: Daily).
Plots Open, High, Low, Close lines across intraday charts.
Bullish/Bearish candle bodies shaded for context.
Background fill between High and Low for zone visualization.
Purpose:
This script is not a “buy/sell” tool. It is a scope, intentionally minimal, highlighting a repeating place of structural and liquidity significance. Use it to track sweeps of higher‑timeframe levels and confirm structural shifts intraday.
⚠️ Disclaimer: This script provides market structure visualization only. It does not generate trading signals or financial advice.
COMEX_MINI:MGC1!
Options Strategy V2.0📈 Options Strategy V2.0 – Intraday Reversal-Resilient Momentum System
Overview:
This strategy is designed specifically for intraday SPY, TSLA, MSFT, etc. options trading (0DTE or 1DTE), using high-probability signals derived from a confluence of technical indicators: EMA crossovers, RSI thresholds, ATR-based risk control, and volume spikes. The strategy aims to capture strong directional moves while avoiding overtrading, thanks to a built-in cooldown logic and optional time/session filters.
⚙️ Core Concept
The strategy executes trades only in the direction of the prevailing trend, determined by short- and long-term Exponential Moving Averages (EMA). Entry signals are generated when the Relative Strength Index (RSI) confirms momentum in the direction of the trend, and volume spikes suggest institutional activity.
To increase adaptability and user control, it includes a highly customizable parameter set for both long and short entries independently.
📌 Key Features
✅ Trend-Following Logic
Long entries are only allowed when EMA(short) > EMA(long)
Short entries are only allowed when EMA(short) < EMA(long)
✅ RSI Confirmation
Long: Requires RSI crossover above a configurable threshold
Short: Requires RSI crossunder below a configurable threshold
Optional rejection filters: Entry blocked above/below specific RSI extremes
✅ Volume Spike Filter
Confirms institutional participation by comparing current volume to an average multiplied by a user-defined factor.
✅ ATR-Based Risk Management
Both Stop Loss (SL) and Take Profit (TP) are dynamically calculated using ATR × a multiplier.
TP/SL ratio is fully configurable.
✅ Cooldown Control
After every trade, the system waits for a set number of bars before allowing new entries.
This prevents overtrading and increases signal quality.
Optionally, cooldown is ignored for reversal trades, ensuring the system can react immediately to a confirmed trend change.
✅ Candle Body Filter (Noise Control)
Avoids trades on candles with too small bodies relative to wicks (often noise or indecision candles).
✅ VWAP Confirmation (Optional)
Ensures price is trading above VWAP for long entries, or below for short entries.
✅ Time & Session Filters
Trades only during regular market hours (09:30–16:00 EST).
No-trade zone (e.g., 14:15–15:45 EST) to avoid low-liquidity traps or late-day whipsaws.
✅ End-of-Day Auto Close
All open positions are force-closed at 15:55 EST, protecting against overnight risk (especially relevant for 0DTE options).
📊 Visual Aids
EMA plots show trend direction
VWAP line provides real-time mean-reversion context
Stop Loss and Take Profit lines appear dynamically with each trade
Alerts notify of entry signals and exit triggers
🔧 Customization Panel
Nearly every element of the strategy can be tailored:
EMA lengths (short and long, for both sides)
RSI thresholds and length
ATR length, SL multiplier, and TP/SL ratio
Volume spike sensitivity
Minimum EMA distance filter
Candle body ratio filter
Session restrictions
Cooldown logic (duration + reversal exception)
This makes the strategy extremely versatile, allowing both conservative and aggressive configurations depending on the trader’s profile and the market context.
📌 Example Use Case: SPY Options (0DTE or 1DTE)
This system was designed and tested specifically for SPY and other intraday options trading, where:
Delta is around 0.50 or higher
Trades are short-lived (often 1–5 candles)
You aim to trade 1–3 signals per day, filtering out weak entries
🚫 Important Notes
It is not a scalping strategy; it relies on confirmed breakouts with trend support
No pyramiding or re-entries without cooldown to preserve risk integrity
Should be used with real-time alerts and manual broker execution
📈 Alerts Included
📈 Long Entry Signal
📉 Short Entry Signal
⚠️ Auto-closed all positions at 15:55 EST
✅ Proven Settings – Real Trades + Backtest Results
The current version of the strategy includes the optimal settings I’ve arrived at through extensive backtesting, as well as 3 months of real trading with consistent profitability. These results reflect real-world execution under live market conditions using 0DTE SPY options, with disciplined trade management and risk control.
🧠 Final Thoughts
Options Strategy V2.0 is a robust, highly tunable intraday strategy that blends momentum, trend-following, and volume confirmation. It is ideal for disciplined traders focused on SPY or other 0DTE/1DTE options, and it includes guardrails to reduce false signals and improve execution timing.
Perfect for those who seek precision, flexibility, and risk-defined setups—not blind automation.

BSC XTrender Signal Engine📈 BSC XTrender Signal Engine
The BSC XTrender Signal Engine is a precision-built momentum and trend confirmation tool that generates high-probability long/short alerts based on three key components:
🔹 BSC XTrender Engine – A dual-timeframe oscillator that visualizes both short- and long-term trend pressure in a unified color-coded ribbon.
🔹 EMA Trend Filter – Confirms price structure alignment using fast and slow exponential moving averages.
🔹 MACD Directional Bias – Validates momentum direction by checking for histogram agreement with price.
🚨 Trade Signals:
Long Trigger: BSC XTrender turns green, price above EMAs, MACD rising
Short Trigger: BSC XTrender turns red, price below EMAs, MACD falling
All conditions must align for a confirmed signal.
🧠 Designed for:
Futures, crypto, and equities traders who want clear entry signals backed by multi-layered logic. Perfect for both intraday scalping and swing trading strategies.

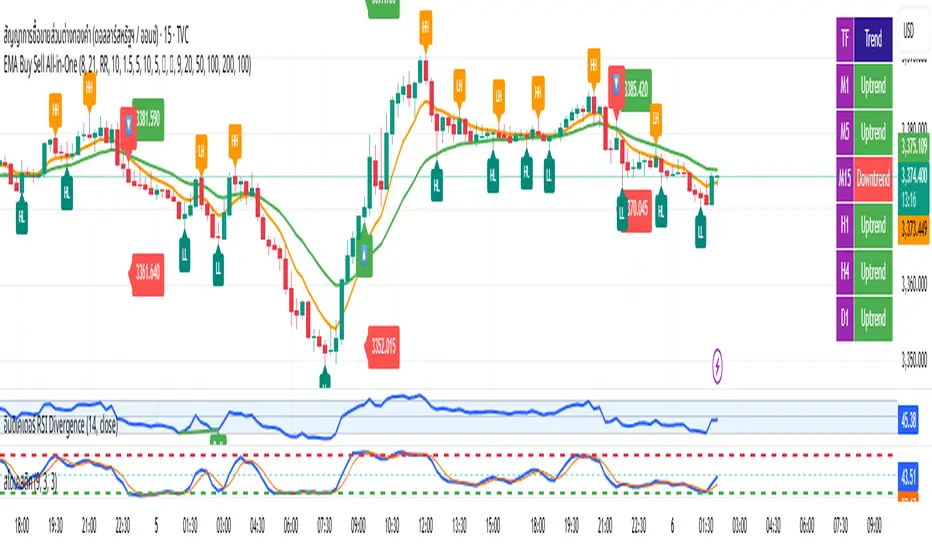
EMA Buy Sell All-in-One✨ Description (แนะนำให้ใช้ตอนกด Publish):
This all-in-one indicator combines several powerful trading tools into one script:
• EMA Cross Entry System: Customizable fast/slow EMA cross for buy/sell signals
• Dynamic SL/TP System: Choose between swing-based or custom SL/TP; auto-calculated RR support
• HH, HL, LH, LL Labels: Market structure points marked directly on chart (toggle ON/OFF)
• Multi-Timeframe Trend Table: Visual overview of EMA trends across D1 → M1 timeframes
• H1 Trend Change Icons: Alerts when the hourly trend flips direction
➤ Clean and responsive display
➤ Fully customizable via input panel
➤ Great for intraday or swing traders following trend + structure alignment
Feel free to fork or modify. Made for those who want clarity and confluence in one view.
Hilega-Milega by NK Sir (DalRoti)he "Hilega-Milega" indicator is a visual tool to:
Show RSI strength around the 50 level.
Highlight momentum visually with color fills.
Plot fast and slow moving averages of RSI (EMA 3 and WMA 21), giving insight into:
Short-term momentum vs. long-term strength
Potential reversals or trend continuation zones

Signal Strength Technical AnalysisSignal Strength Technical Analysis – Study Material & Usage Guide
Overview:
This tool is a multi-layered TradingView indicator developed to help traders identify high-probability trade setups using order block detection, dynamic trendlines, volume and volatility filters, and ATR-based target projections. This guide outlines each feature, its formulaic foundation, and how to use the tool effectively in live markets.
________________________________________
Key Features and How to Use Them
1. Order Block Detection:
The script identifies institutional-level buying/selling zones using sequences of directional candles.
• You define the number of consecutive candles to qualify an order block.
• A move qualifies as an order block if:
• Price Move % = |Close(n) - Close(1)| / Close(n) × 100 ≥ Threshold
• Bullish Order Block: A down candle followed by multiple up candles.
• Bearish Order Block: An up candle followed by multiple down candles.
These blocks are plotted and used for trade entry confirmation and support/resistance analysis.
________________________________________
2. Trendline Logic:
Support and resistance lines are drawn dynamically using pivots.
• Pivot highs/lows are identified over a user-defined period (e.g., 10 bars).
• Trendline slope is calculated using:
• Slope = (Pivot_new - Pivot_old) / (Time_new - Time_old)
• Current projected support or resistance:
• Price = StartPrice + Slope × (CurrentTime - StartTime)
Breakouts beyond these levels are interpreted as potential trade signals when confirmed by other filters.
________________________________________
3. Volume and ATR Filters:
These filters help eliminate weak or low-conviction signals.
• Average Volume:
• AvgVol = SMA(Volume, 20)
• Volume Spike Detection:
• Volume > AvgVol × VolumeThreshold
• ATR Volatility Filter (ATR over 14 bars):
• (High - Low) > ATR × ATRMultiplier
If both filters pass, the market is considered active and eligible for trade setup.
________________________________________
4. Signal Generation Logic:
• Bullish Signal: Triggered when:
o Price breaks above resistance or a bullish order block
o Volume and ATR filters are passed
o Trend is confirmed: EMA9 > EMA21 > EMA50
• Bearish Signal: Triggered when:
o Price breaks below support or a bearish order block
o Volume and ATR filters are passed
o Trend is confirmed: EMA9 < EMA21 < EMA50
________________________________________
5. Target and Stop Loss Projection:
Based on the Average True Range (ATR):
• For Long Trades:
• TP = High + (ATR × 2)
• SL = Low - (ATR × 1)
• For Short Trades:
• TP = Low - (ATR × 2)
• SL = High + (ATR × 1)
Targets and stops are plotted on the chart and update dynamically.
________________________________________
6. Trade Management and Win Rate Calculation:
• Once in a trade, the script monitors price:
o Hits TP → Recorded as win
o Hits SL → Recorded as loss
• Win Rate Calculation:
• Win Rate = (Wins / Total Signals) × 100%
This helps track the strategy's live effectiveness and improve decision-making.
________________________________________
How to Use the Indicator – Practical Steps
1. Setup
o Add the indicator to your TradingView chart
o Configure OB periods, trendline pivots, volume and ATR multipliers
o Adjust display preferences
2. Wait for Signal
o Look for a “BUY” or “SELL” label to appear
o Confirm with:
EMA trend alignment
RSI and MACD momentum
Volume and ATR filters
3. Execute Trade
o Enter on the next bar after confirmation
o Use the plotted TP/SL levels as risk management
o Adjust position sizing according to your trading rules
4. Manage Trade
o Monitor PnL and win rate live
o Exit manually or let price hit TP/SL
o Respect the indicator’s environment reading (avoid trading in low-volatility or sideways zones)
________________________________________
Alerts and Automation
• The script includes built-in alert conditions for:
o Buy/Sell signal confirmation
o Take-profit level reached
o Stop-loss triggered
Enable alerts in TradingView to receive real-time notifications to your mobile, email, or connected services.
________________________________________
Disclaimer from aiTrendview
This tool is provided for educational and research purposes only. It is not intended as financial advice or an investment recommendation. Trading in financial markets involves substantial risk. Past performance does not guarantee future results. The user alone is responsible for all trading decisions, including risk management and strategy selection. We strongly recommend testing this tool on a demo account before applying it to real capital and consulting a licensed financial advisor where necessary.


SMC Structures and FVGสวัสดีครับ! ผมจะอธิบายอินดิเคเตอร์ "SMC Structures and FVG + MACD" ที่คุณให้มาอย่างละเอียดในแต่ละส่วน เพื่อให้คุณเข้าใจการทำงานของมันอย่างถ่องแท้ครับ
อินดิเคเตอร์นี้เป็นการผสมผสานแนวคิดของ Smart Money Concept (SMC) ซึ่งเน้นการวิเคราะห์โครงสร้างตลาด (Market Structure) และ Fair Value Gap (FVG) เข้ากับอินดิเคเตอร์ MACD เพื่อใช้เป็นตัวกรองหรือตัวยืนยันสัญญาณ Choch/BoS (Change of Character / Break of Structure)
1. ภาพรวมอินดิเคเตอร์ (Overall Purpose)
อินดิเคเตอร์นี้มีจุดประสงค์หลักคือ:
ระบุโครงสร้างตลาด: ตีเส้นและป้ายกำกับ Choch (Change of Character) และ BoS (Break of Structure) บนกราฟโดยอัตโนมัติ
ผสานการยืนยันด้วย MACD: สัญญาณ Choch/BoS จะถูกพิจารณาก็ต่อเมื่อ MACD Histogram เกิดการตัดขึ้นหรือลง (Zero Cross) ในทิศทางที่สอดคล้องกัน
แสดง Fair Value Gap (FVG): หากเปิดใช้งาน จะมีการตีกล่อง FVG บนกราฟ
แสดงระดับ Fibonacci: คำนวณและแสดงระดับ Fibonacci ที่สำคัญตามโครงสร้างตลาดปัจจุบัน
ปรับตาม Timeframe: การคำนวณและการแสดงผลทั้งหมดจะปรับตาม Timeframe ที่คุณกำลังใช้งานอยู่โดยอัตโนมัติ
2. ส่วนประกอบหลักของโค้ด (Code Breakdown)
โค้ดนี้สามารถแบ่งออกเป็นส่วนหลัก ๆ ได้ดังนี้:
2.1 Inputs (การตั้งค่า)
ส่วนนี้คือตัวแปรที่คุณสามารถปรับแต่งได้ในหน้าต่างการตั้งค่าของอินดิเคเตอร์ (คลิกที่รูปฟันเฟืองข้างชื่ออินดิเคเตอร์บนกราฟ)
MACD Settings (ตั้งค่า MACD):
fast_len: ความยาวของ Fast EMA สำหรับ MACD (ค่าเริ่มต้น 12)
slow_len: ความยาวของ Slow EMA สำหรับ MACD (ค่าเริ่มต้น 26)
signal_len: ความยาวของ Signal Line สำหรับ MACD (ค่าเริ่มต้น 9)
= ta.macd(close, fast_len, slow_len, signal_len): คำนวณค่า MACD Line, Signal Line และ Histogram โดยใช้ราคาปิด (close) และค่าความยาวที่กำหนด
is_bullish_macd_cross: ตรวจสอบว่า MACD Histogram ตัดขึ้นเหนือเส้น 0 (จากค่าลบเป็นบวก)
is_bearish_macd_cross: ตรวจสอบว่า MACD Histogram ตัดลงใต้เส้น 0 (จากค่าบวกเป็นลบ)
Fear Value Gap (FVG) Settings:
isFvgToShow: (Boolean) เปิด/ปิดการแสดง FVG บนกราฟ
bullishFvgColor: สีสำหรับ Bullish FVG
bearishFvgColor: สีสำหรับ Bearish FVG
mitigatedFvgColor: สีสำหรับ FVG ที่ถูก Mitigate (ลดทอน) แล้ว
fvgHistoryNbr: จำนวน FVG ย้อนหลังที่จะแสดง
isMitigatedFvgToReduce: (Boolean) เปิด/ปิดการลดขนาด FVG เมื่อถูก Mitigate
Structures (โครงสร้างตลาด) Settings:
isStructBodyCandleBreak: (Boolean) หากเป็น true การ Break จะต้องเกิดขึ้นด้วย เนื้อเทียน ที่ปิดเหนือ/ใต้ Swing High/Low หากเป็น false แค่ไส้เทียนทะลุก็ถือว่า Break
isCurrentStructToShow: (Boolean) เปิด/ปิดการแสดงเส้นโครงสร้างตลาดปัจจุบัน (เส้นสีน้ำเงินในภาพตัวอย่าง)
pivot_len: ความยาวของแท่งเทียนที่ใช้ในการมองหาจุด Pivot (Swing High/Low) ยิ่งค่าน้อยยิ่งจับ Swing เล็กๆ ได้, ยิ่งค่ามากยิ่งจับ Swing ใหญ่ๆ ได้
bullishBosColor, bearishBosColor: สีสำหรับเส้นและป้าย BOS ขาขึ้น/ขาลง
bosLineStyleOption, bosLineWidth: สไตล์ (Solid, Dotted, Dashed) และความหนาของเส้น BOS
bullishChochColor, bearishChochColor: สีสำหรับเส้นและป้าย CHoCH ขาขึ้น/ขาลง
chochLineStyleOption, chochLineWidth: สไตล์ (Solid, Dotted, Dashed) และความหนาของเส้น CHoCH
currentStructColor, currentStructLineStyleOption, currentStructLineWidth: สี, สไตล์ และความหนาของเส้นโครงสร้างตลาดปัจจุบัน
structHistoryNbr: จำนวนการ Break (Choch/BoS) ย้อนหลังที่จะแสดง
Structure Fibonacci (จากโค้ดต้นฉบับ):
เป็นชุด Input สำหรับเปิด/ปิด, กำหนดค่า, สี, สไตล์ และความหนาของเส้น Fibonacci Levels ต่างๆ (0.786, 0.705, 0.618, 0.5, 0.382) ที่จะถูกคำนวณจากโครงสร้างตลาดปัจจุบัน
2.2 Helper Functions (ฟังก์ชันช่วยทำงาน)
getLineStyle(lineOption): ฟังก์ชันนี้ใช้แปลงค่า String ที่เลือกจาก Input (เช่น "─", "┈", "╌") ให้เป็นรูปแบบ line.style_ ที่ Pine Script เข้าใจ
get_structure_highest_bar(lookback): ฟังก์ชันนี้พยายามหา Bar Index ของแท่งเทียนที่ทำ Swing High ภายในช่วง lookback ที่กำหนด
get_structure_lowest_bar(lookback): ฟังก์ชันนี้พยายามหา Bar Index ของแท่งเทียนที่ทำ Swing Low ภายในช่วง lookback ที่กำหนด
is_structure_high_broken(...): ฟังก์ชันนี้ตรวจสอบว่าราคาปัจจุบันได้ Break เหนือ _structureHigh (Swing High) หรือไม่ โดยพิจารณาจาก _highStructBreakPrice (ราคาปิดหรือราคา High ขึ้นอยู่กับการตั้งค่า isStructBodyCandleBreak)
FVGDraw(...): ฟังก์ชันนี้รับ Arrays ของ FVG Boxes, Types, Mitigation Status และ Labels มาประมวลผล เพื่ออัปเดตสถานะของ FVG (เช่น ถูก Mitigate หรือไม่) และปรับขนาด/ตำแหน่งของ FVG Box และ Label บนกราฟ
2.3 Global Variables (ตัวแปรทั่วทั้งอินดิเคเตอร์)
เป็นตัวแปรที่ประกาศด้วย var ซึ่งหมายความว่าค่าของมันจะถูกเก็บไว้และอัปเดตในแต่ละแท่งเทียน (persists across bars)
structureLines, structureLabels: Arrays สำหรับเก็บอ็อบเจกต์ line และ label ของเส้น Choch/BoS ที่วาดบนกราฟ
fvgBoxes, fvgTypes, fvgLabels, isFvgMitigated: Arrays สำหรับเก็บข้อมูลของ FVG Boxes และสถานะต่างๆ
structureHigh, structureLow: เก็บราคาของ Swing High/Low ที่สำคัญของโครงสร้างตลาดปัจจุบัน
structureHighStartIndex, structureLowStartIndex: เก็บ Bar Index ของจุดเริ่มต้นของ Swing High/Low ที่สำคัญ
structureDirection: เก็บสถานะของทิศทางโครงสร้างตลาด (1 = Bullish, 2 = Bearish, 0 = Undefined)
fiboXPrice, fiboXStartIndex, fiboXLine, fiboXLabel: ตัวแปรสำหรับเก็บข้อมูลและอ็อบเจกต์ของเส้น Fibonacci Levels
isBOSAlert, isCHOCHAlert: (Boolean) ใช้สำหรับส่งสัญญาณ Alert (หากมีการตั้งค่า Alert ไว้)
2.4 FVG Processing (การประมวลผล FVG)
ส่วนนี้จะตรวจสอบเงื่อนไขการเกิด FVG (Bullish FVG: high < low , Bearish FVG: low > high )
หากเกิด FVG และ isFvgToShow เป็น true จะมีการสร้าง box และ label ใหม่เพื่อแสดง FVG บนกราฟ
มีการจัดการ fvgBoxes และ fvgLabels เพื่อจำกัดจำนวน FVG ที่แสดงตาม fvgHistoryNbr และลบ FVG เก่าออก
ฟังก์ชัน FVGDraw จะถูกเรียกเพื่ออัปเดตสถานะของ FVG (เช่น การถูก Mitigate) และปรับการแสดงผล
2.5 Structures Processing (การประมวลผลโครงสร้างตลาด)
Initialization: ที่ bar_index == 0 (แท่งเทียนแรกของกราฟ) จะมีการกำหนดค่าเริ่มต้นให้กับ structureHigh, structureLow, structureHighStartIndex, structureLowStartIndex
Finding Current High/Low: highest, highestBar, lowest, lowestBar ถูกใช้เพื่อหา High/Low ที่สุดและ Bar Index ของมันใน 10 แท่งล่าสุด (หรือทั้งหมดหากกราฟสั้นกว่า 10 แท่ง)
Calculating Structure Max/Min Bar: structureMaxBar และ structureMinBar ใช้ฟังก์ชัน get_structure_highest_bar และ get_structure_lowest_bar เพื่อหา Bar Index ของ Swing High/Low ที่แท้จริง (ไม่ใช่แค่ High/Low ที่สุดใน lookback แต่เป็นจุด Pivot ที่สมบูรณ์)
Break Price: lowStructBreakPrice และ highStructBreakPrice จะเป็นราคาปิด (close) หรือราคา Low/High ขึ้นอยู่กับ isStructBodyCandleBreak
isStuctureLowBroken / isStructureHighBroken: เงื่อนไขเหล่านี้ตรวจสอบว่าราคาได้ทำลาย structureLow หรือ structureHigh หรือไม่ โดยพิจารณาจากราคา Break, ราคาแท่งก่อนหน้า และ Bar Index ของจุดเริ่มต้นโครงสร้าง
Choch/BoS Logic (ส่วนสำคัญที่ถูกผสานกับ MACD):
if(isStuctureLowBroken and is_bearish_macd_cross): นี่คือจุดที่ MACD เข้ามามีบทบาท หากราคาทำลาย structureLow (สัญญาณขาลง) และ MACD Histogram เกิด Bearish Zero Cross (is_bearish_macd_cross เป็น true) อินดิเคเตอร์จะพิจารณาว่าเป็น Choch หรือ BoS
หาก structureDirection == 1 (เดิมเป็นขาขึ้น) หรือ 0 (ยังไม่กำหนด) จะตีเป็น "CHoCH" (เปลี่ยนทิศทางโครงสร้างเป็นขาลง)
หาก structureDirection == 2 (เดิมเป็นขาลง) จะตีเป็น "BOS" (ยืนยันโครงสร้างขาลง)
มีการสร้าง line.new และ label.new เพื่อวาดเส้นและป้ายกำกับ
structureDirection จะถูกอัปเดตเป็น 1 (Bullish)
structureHighStartIndex, structureLowStartIndex, structureHigh, structureLow จะถูกอัปเดตเพื่อกำหนดโครงสร้างใหม่
else if(isStructureHighBroken and is_bullish_macd_cross): เช่นกันสำหรับขาขึ้น หากราคาทำลาย structureHigh (สัญญาณขาขึ้น) และ MACD Histogram เกิด Bullish Zero Cross (is_bullish_macd_cross เป็น true) อินดิเคเตอร์จะพิจารณาว่าเป็น Choch หรือ BoS
หาก structureDirection == 2 (เดิมเป็นขาลง) หรือ 0 (ยังไม่กำหนด) จะตีเป็น "CHoCH" (เปลี่ยนทิศทางโครงสร้างเป็นขาขึ้น)
หาก structureDirection == 1 (เดิมเป็นขาขึ้น) จะตีเป็น "BOS" (ยืนยันโครงสร้างขาขึ้น)
มีการสร้าง line.new และ label.new เพื่อวาดเส้นและป้ายกำกับ
structureDirection จะถูกอัปเดตเป็น 2 (Bearish)
structureHighStartIndex, structureLowStartIndex, structureHigh, structureLow จะถูกอัปเดตเพื่อกำหนดโครงสร้างใหม่
การลบเส้นเก่า: d.delete_line (หากไลบรารีทำงาน) จะถูกเรียกเพื่อลบเส้นและป้ายกำกับเก่าออกเมื่อจำนวนเกิน structHistoryNbr
Updating Structure High/Low (else block): หากไม่มีการ Break เกิดขึ้น แต่ราคาปัจจุบันสูงกว่า structureHigh หรือต่ำกว่า structureLow ในทิศทางที่สอดคล้องกัน (เช่น ยังคงเป็นขาขึ้นและทำ High ใหม่) structureHigh หรือ structureLow จะถูกอัปเดตเพื่อติดตาม High/Low ที่สุดของโครงสร้างปัจจุบัน
Current Structure Display:
หาก isCurrentStructToShow เป็น true อินดิเคเตอร์จะวาดเส้น structureHighLine และ structureLowLine เพื่อแสดงขอบเขตของโครงสร้างตลาดปัจจุบัน
Fibonacci Display:
หาก isFiboXToShow เป็น true อินดิเคเตอร์จะคำนวณและวาดเส้น Fibonacci Levels ต่างๆ (0.786, 0.705, 0.618, 0.5, 0.382) โดยอิงจาก structureHigh และ structureLow ของโครงสร้างตลาดปัจจุบัน
Alerts:
alertcondition: ใช้สำหรับตั้งค่า Alert ใน TradingView เมื่อเกิดสัญญาณ BOS หรือ CHOCH
plot(na):
plot(na) เป็นคำสั่งที่สำคัญในอินดิเคเตอร์ที่ไม่ได้ต้องการพล็อต Series ของข้อมูลบนกราฟ (เช่น ไม่ได้พล็อตเส้น EMA หรือ RSI) แต่ใช้วาดอ็อบเจกต์ (Line, Label, Box) โดยตรง
การมี plot(na) ช่วยให้ Pine Script รู้ว่าอินดิเคเตอร์นี้มีเอาต์พุตที่แสดงผลบนกราฟ แม้ว่าจะไม่ได้เป็น Series ที่พล็อตตามปกติก็ตาม
3. วิธีใช้งาน
คัดลอกโค้ดทั้งหมด ที่อยู่ในบล็อก immersive ด้านบน
ไปที่ TradingView และเปิดกราฟที่คุณต้องการ
คลิกที่เมนู "Pine Editor" ที่อยู่ด้านล่างของหน้าจอ
ลบโค้ดเดิมที่มีอยู่ และ วางโค้ดที่คัดลอกมา ลงไปแทน
คลิกที่ปุ่ม "Add to Chart"
อินดิเคเตอร์จะถูกเพิ่มลงในกราฟของคุณโดยอัตโนมัติ คุณสามารถคลิกที่รูปฟันเฟืองข้างชื่ออินดิเคเตอร์บนกราฟเพื่อเข้าถึงหน้าต่างการตั้งค่าและปรับแต่งตามความต้องการของคุณได้
Hello! I will explain the "SMC Structures and FVG + MACD" indicator you provided in detail, section by section, so you can fully understand how it works.This indicator combines the concepts of Smart Money Concept (SMC), which focuses on analyzing Market Structure and Fair Value Gaps (FVG), with the MACD indicator to serve as a filter or confirmation for Choch (Change of Character) and BoS (Break of Structure) signals.1. Overall PurposeThe main purposes of this indicator are:Identify Market Structure: Automatically draw lines and label Choch (Change of Character) and BoS (Break of Structure) on the chart.Integrate MACD Confirmation: Choch/BoS signals will only be considered when the MACD Histogram performs a cross (Zero Cross) in the corresponding direction.Display Fair Value Gap (FVG): If enabled, FVG boxes will be drawn on the chart.Display Fibonacci Levels: Calculate and display important Fibonacci levels based on the current market structure.Adapt to Timeframe: All calculations and displays will automatically adjust to the timeframe you are currently using.2. Code BreakdownThis code can be divided into the following main sections:2.1 Inputs (Settings)This section contains variables that you can adjust in the indicator's settings window (click the gear icon next to the indicator's name on the chart).MACD Settings:fast_len: Length of the Fast EMA for MACD (default 12)slow_len: Length of the Slow EMA for MACD (default 26)signal_len: Length of the Signal Line for MACD (default 9) = ta.macd(close, fast_len, slow_len, signal_len): Calculates the MACD Line, Signal Line, and Histogram using the closing price (close) and the specified lengths.is_bullish_macd_cross: Checks if the MACD Histogram crosses above the 0 line (from negative to positive).is_bearish_macd_cross: Checks if the MACD Histogram crosses below the 0 line (from positive to negative).Fear Value Gap (FVG) Settings:isFvgToShow: (Boolean) Enables/disables the display of FVG on the chart.bullishFvgColor: Color for Bullish FVG.bearishFvgColor: Color for Bearish FVG.mitigatedFvgColor: Color for FVG that has been mitigated.fvgHistoryNbr: Number of historical FVG to display.isMitigatedFvgToReduce: (Boolean) Enables/disables reducing the size of FVG when mitigated.Structures (โครงสร้างตลาด) Settings:isStructBodyCandleBreak: (Boolean) If true, the break must occur with the candle body closing above/below the Swing High/Low. If false, a wick break is sufficient.isCurrentStructToShow: (Boolean) Enables/disables the display of the current market structure lines (blue lines in the example image).pivot_len: Lookback length for identifying Pivot points (Swing High/Low). A smaller value captures smaller, more frequent swings; a larger value captures larger, more significant swings.bullishBosColor, bearishBosColor: Colors for bullish/bearish BOS lines and labels.bosLineStyleOption, bosLineWidth: Style (Solid, Dotted, Dashed) and width of BOS lines.bullishChochColor, bearishChochColor: Colors for bullish/bearish CHoCH lines and labels.chochLineStyleOption, chochLineWidth: Style (Solid, Dotted, Dashed) and width of CHoCH lines.currentStructColor, currentStructLineStyleOption, currentStructLineWidth: Color, style, and width of the current market structure lines.structHistoryNbr: Number of historical breaks (Choch/BoS) to display.Structure Fibonacci (from original code):A set of inputs to enable/disable, define values, colors, styles, and widths for various Fibonacci Levels (0.786, 0.705, 0.618, 0.5, 0.382) that will be calculated from the current market structure.2.2 Helper FunctionsgetLineStyle(lineOption): This function converts the selected string input (e.g., "─", "┈", "╌") into a line.style_ format understood by Pine Script.get_structure_highest_bar(lookback): This function attempts to find the Bar Index of the Swing High within the specified lookback period.get_structure_lowest_bar(lookback): This function attempts to find the Bar Index of the Swing Low within the specified lookback period.is_structure_high_broken(...): This function checks if the current price has broken above _structureHigh (Swing High), considering _highStructBreakPrice (closing price or high price depending on isStructBodyCandleBreak setting).FVGDraw(...): This function takes arrays of FVG Boxes, Types, Mitigation Status, and Labels to process and update the status of FVG (e.g., whether it's mitigated) and adjust the size/position of FVG Boxes and Labels on the chart.2.3 Global VariablesThese are variables declared with var, meaning their values are stored and updated on each bar (persists across bars).structureLines, structureLabels: Arrays to store line and label objects for Choch/BoS lines drawn on the chart.fvgBoxes, fvgTypes, fvgLabels, isFvgMitigated: Arrays to store FVG box data and their respective statuses.structureHigh, structureLow: Stores the price of the significant Swing High/Low of the current market structure.structureHighStartIndex, structureLowStartIndex: Stores the Bar Index of the start point of the significant Swing High/Low.structureDirection: Stores the status of the market structure direction (1 = Bullish, 2 = Bearish, 0 = Undefined).fiboXPrice, fiboXStartIndex, fiboXLine, fiboXLabel: Variables to store data and objects for Fibonacci Levels.isBOSAlert, isCHOCHAlert: (Boolean) Used to trigger alerts in TradingView (if alerts are configured).2.4 FVG ProcessingThis section checks the conditions for FVG formation (Bullish FVG: high < low , Bearish FVG: low > high ).If FVG occurs and isFvgToShow is true, a new box and label are created to display the FVG on the chart.fvgBoxes and fvgLabels are managed to limit the number of FVG displayed according to fvgHistoryNbr and remove older FVG.The FVGDraw function is called to update the FVG status (e.g., whether it's mitigated) and adjust its display.2.5 Structures ProcessingInitialization: At bar_index == 0 (the first bar of the chart), structureHigh, structureLow, structureHighStartIndex, and structureLowStartIndex are initialized.Finding Current High/Low: highest, highestBar, lowest, lowestBar are used to find the highest/lowest price and its Bar Index of it in the last 10 bars (or all bars if the chart is shorter than 10 bars).Calculating Structure Max/Min Bar: structureMaxBar and structureMinBar use get_structure_highest_bar and get_structure_lowest_bar functions to find the Bar Index of the true Swing High/Low (not just the highest/lowest in the lookback but a complete Pivot point).Break Price: lowStructBreakPrice and highStructBreakPrice will be the closing price (close) or the Low/High price, depending on the isStructBodyCandleBreak setting.isStuctureLowBroken / isStructureHighBroken: These conditions check if the price has broken structureLow or structureHigh, considering the break price, previous bar prices, and the Bar Index of the structure's starting point.Choch/BoS Logic (Key Integration with MACD):if(isStuctureLowBroken and is_bearish_macd_cross): This is where MACD plays a role. If the price breaks structureLow (bearish signal) AND the MACD Histogram performs a Bearish Zero Cross (is_bearish_macd_cross is true), the indicator will consider it a Choch or BoS.If structureDirection == 1 (previously bullish) or 0 (undefined), it will be labeled "CHoCH" (changing structure direction to bearish).If structureDirection == 2 (already bearish), it will be labeled "BOS" (confirming bearish structure).line.new and label.new are used to draw the line and label.structureDirection will be updated to 1 (Bullish).structureHighStartIndex, structureLowStartIndex, structureHigh, structureLow will be updated to define the new structure.else if(isStructureHighBroken and is_bullish_macd_cross): Similarly for bullish breaks. If the price breaks structureHigh (bullish signal) AND the MACD Histogram performs a Bullish Zero Cross (is_bullish_macd_cross is true), the indicator will consider it a Choch or BoS.If structureDirection == 2 (previously bearish) or 0 (undefined), it will be labeled "CHoCH" (changing structure direction to bullish).If structureDirection == 1 (already bullish), it will be labeled "BOS" (confirming bullish structure).line.new and label.new are used to draw the line and label.structureDirection will be updated to 2 (Bearish).structureHighStartIndex, structureLowStartIndex, structureHigh, structureLow will be updated to define the new structure.Deleting Old Lines: d.delete_line (if the library works) will be called to delete old lines and labels when their number exceeds structHistoryNbr.Updating Structure High/Low (else block): If no break occurs, but the current price is higher than structureHigh or lower than structureLow in the corresponding direction (e.g., still bullish and making a new high), structureHigh or structureLow will be updated to track the highest/lowest point of the current structure.Current Structure Display:If isCurrentStructToShow is true, the indicator draws structureHighLine and structureLowLine to show the boundaries of the current market structure.Fibonacci Display:If isFiboXToShow is true, the indicator calculates and draws various Fibonacci Levels (0.786, 0.705, 0.618, 0.5, 0.382) based on the structureHigh and structureLow of the current market structure.Alerts:alertcondition: Used to set up alerts in TradingView when BOS or CHOCH signals occur.plot(na):plot(na) is an important statement in indicators that do not plot data series directly on the chart (e.g., not plotting EMA or RSI lines) but instead draw objects (Line, Label, Box).Having plot(na) helps Pine Script recognize that this indicator has an output displayed on the chart, even if it's not a regularly plotted series.3. How to UseCopy all the code in the immersive block above.Go to TradingView and open your desired chart.Click on the "Pine Editor" menu at the bottom of the screen.Delete any existing code and paste the copied code in its place.Click the "Add to Chart" button.The indicator will be added to your chart automatically. You can click the gear icon next to the indicator's name on the chart to access the settings window and customize it to your needs.I hope this explanation helps you understand this indicator in detail. If anything is unclear, or you need further adjustments, please let me know.
