Cerca negli script per "alert"


[ALERTS] lamBOTghiniIt is a script based on changes in trend of EMAs.
You can copy it, modify it to your liking and maybe even buy a lambo.
Try it and if you can think of how to improve it please comment.
Enjoy!!!

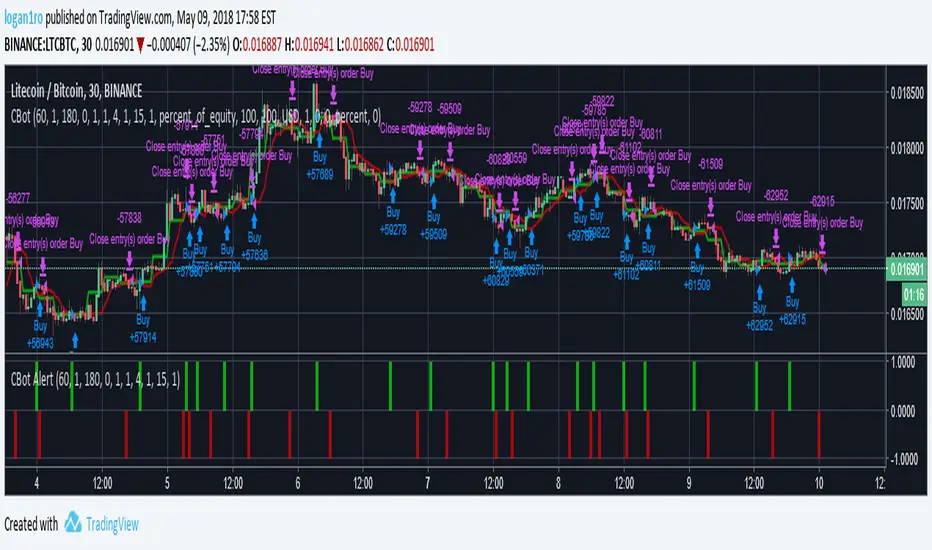
Alerts for Dragon-Bot beta breakout scriptThis is a work in progress for Alerts for a breakout script


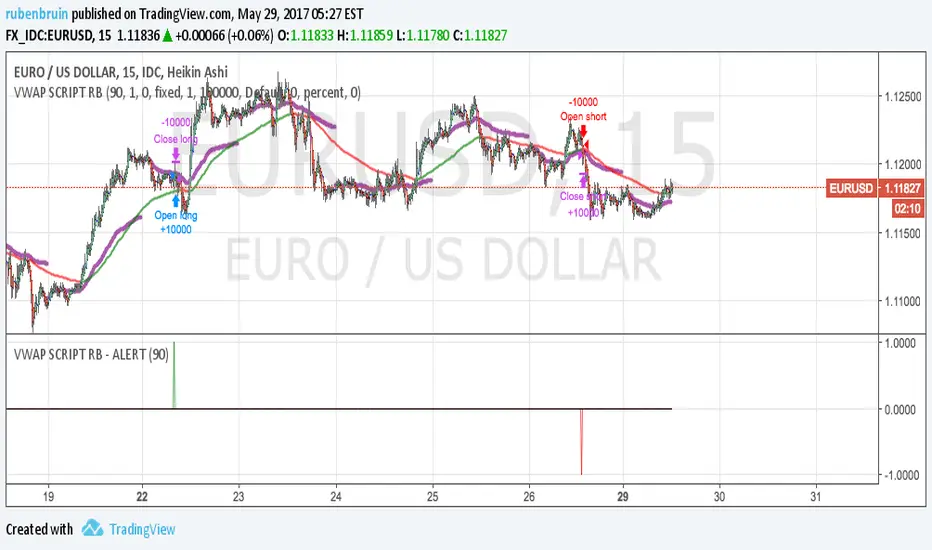
Alexandre Harkins Alerts/IndicatorAlerts and arrows when:
- SMA short crossover SMA long and DI+ over level and Stochastic below level.
- SMA short crossunder SMA long and DI- over level and Stochastic above level.

Kinetic RSI [Vel + Accel] + AlertsThe Problem with Standard RSI
Most traders use the Relative Strength Index (RSI) to see if a market is "Overbought" (above 70) or "Oversold" (below 30). The problem? A strong trend can stay overbought for days, burning short sellers, or an asset can stay oversold while price continues to crash. Standard RSI tells you where the price is, but it doesn't tell you how hard it is moving.
The Solution: Kinetic RSI
This script reimagines RSI by applying basic physics concepts: Velocity and Acceleration.
Instead of asking "Is RSI below 30?", this indicator asks: "Is RSI below 35 AND did it just make a violent, high-speed turn upwards?"
It filters out lazy, drifting price action and only signals when momentum is accelerating in a new direction.
How It Works (The Math)
Velocity: We calculate the speed of the RSI change (Current RSI - Previous RSI).
Acceleration: We calculate if that speed is increasing (Current Velocity - Previous Velocity).
The Trigger: A signal is only generated if the RSI is in an extreme zone (<35 or >65) AND it has high Velocity AND positive Acceleration.
How to Trade It
1. The "Kick" Signals (Background Highlights)
🟢 Green Background (Bullish Kick): The RSI was low, but buyers stepped in aggressively. The momentum is not just positive; it is accelerating upward. This is often a "V-Bottom" catch.
🔴 Red Background (Bearish Kick): The RSI was high, but sellers slammed the price down. Momentum is accelerating downward.
2. The Line Color
Lime Line: Velocity is positive (Momentum is rising).
Fuchsia Line: Velocity is negative (Momentum is falling).
Usage: If the background flashes Green (Buy Signal), but the line turns back to Fuchsia (Red) a few bars later, the move has failed—exit the trade.
Settings & Alerts
RSI Length: Standard 14 (Adjustable).
Velocity Threshold: Controls sensitivity.
Lower (e.g., 2-3): More signals, catches smaller reversals.
Higher (e.g., 5+): Fewer signals, catches only massive "shocks" to the price.
Alerts Included: You can set alerts for "Bullish Kick," "Bearish Kick," or "Any Kick" to get notified of volatility spikes.
Best Practices
Wait for the Close: This indicator measures the closing velocity. Always wait for the bar to close to confirm the background color signal.
Trend Filtering: This works best as a "Reversal" indicator. If the market is in a super-strong uptrend, ignore the Bearish (Red) signals and only take the Bullish (Green) dips.

Heeger Alert | Didi's Needles setup [HeegerBot]Indicator based on Color Candles - Didi's Needles setup , but now exclusively focused on generating alerts.
With this indicator, you can set up alerts and notifications on TradingView for up to 15 assets based on Didi Aguiar's setup. Additionally, you can specify whether the alert should trigger at the candle close or X minutes before the close.
A session filter has also been added, allowing you to configure alerts to trigger only during a specific session.
Description of monitored signals:
The setup involves the crossing of three moving averages, along with the trend analysis in the ADX and the open Bollinger Bands.
The moving averages will be named "Didi Index". We will have the 3-period average as "Fast Average", the 8-period average as "Median Average", and the 20-period average as "Slow Average". When the Fast Average crosses the Median Average, we will have an alert, and when the Slow Average crosses the Median Average, we will have a confirmation. To adjust the Didi Index in the signals, the Median Average was normalized, that is, it will always be equal to 0. For the Slow and Fast Average, we will only consider the percentage difference in relation to the Median Average.
In addition to the moving averages, we analyze whether the ADX is rising, with DI+ above DI- to indicate an uptrend, or if the ADX is rising, with DI- above DI+ to indicate a downtrend. We also check if the Bollinger Bands are open. With these conditions, we will have a Needle.
Now I'm going to detail how I set this up on the indicator and some filters that I inserted for my personal use, along with some additional signals from the setup.
# Needle Alert
Firstly, we have the "Needle Alert" signal. This signal occurs when the Fast Average crosses the Median Average, along with the trend confirmation in the ADX and the opening of the Bollinger Bands. The filter is set at "1", which means we will only consider the needle alert when the percentage difference between the Slow Average and the Median Average is below 1%. This signal can be used as an entry point or to monitor the asset. Let's go through the examples:
• For a "Buy Alert", the Fast Average must cross the Median Average from bottom to top, and the percentage difference between the Slow Average and the Median Average should be less than +1% and greater than 0, as indicated by the Didi Index.
• For a "Sell Alert", the Fast Average must cross the Median Average from top to bottom, and the percentage difference between the Slow Average and the Median Average should be greater than -1% and less than 0, as indicated by the Didi Index.
We also have the alert projection, which serves as a signal to attract attention and monitor the asset. I use a "0.1" filter, which means that the percentage difference between the Fast Average and the Median Average must be equal to or less than 0.1%. Let's look at the example:
• For a "Buy Alert Projection", the Fast Average should be below the Median Average, and the percentage difference between the Fast Average and the Median Average should be greater than -0.1% and less than 0. In addition, the Slow Average should be above the Median Average in the Didi Index.
• For a "Buy Alert Projection", the Fast Average should be below the Median Average, and the percentage difference between the Fast Average and the Median Average should be greater than -0.1% and less than 0. In addition, the Slow Average should be above the Median Average in the Didi Index.
# Needle
After the Needle Alert, we have the Needle Confirmation, which occurs when the Slow Average crosses the Median Average after the alert. This signal is used to enter the operation. Let's divide this signal into two parts:
1. Needle: We use a filter of "3" (adjustable). This means that, to be considered a "Needle", the candle distance between the Alert (crossing of the Fast Average with the Median Average) and the Confirmation (crossing of the Slow Average with the Median Average) must be equal to or less than 3 candles. Also, there needs to be a trend on the ADX and the Bollinger Bands should be open.
2. Queijo Minas Needle (QM): Essentially, it's a Needle that occurs outside of the filter, with a candle distance between the Alert and the Confirmation above "3" candles. A trend on the ADX and open Bollinger Bands are also necessary.
To anticipate the Needle Confirmation, we use the "Needle Projection" signal. This signal has two filters: the "Needle Projection with Alert", set as "0.1%", and the "Needle Projection after the Alert", set as "0.3%".
1. The "Needle Projection with Alert" generates the signal when the "Needle Alert" occurs (crossing of the Fast Average with the Median Average), as long as the difference between the Slow Average and the Median Average is less than 0.1%.
2. The "Needle Projection after the Alert" generates the signal when the Fast Average has already crossed the Median Average, and the difference between the Slow Average and the Median Average should be less than 0.3%.
# BJMA (Spider Woman's Kiss)
There is another variation of the needle called BJMA. Essentially, it occurs when the Fast Average and the Slow Average approach the Median Average (each on one pole), but do not cross the Median and return to where they came from. In this signal, we have two filters: "Delta BJMA previous candle" and "Delta BJMA current candle". Let's see an example:
• Buy BJMA: First, we observe the previous candle, where the Fast Average must be above 0 (above the Median Average) and the percentage difference should be less than 0.02. In relation to the Slow Average, the configuration is the same, but in the negative sense, that is, it should be below 0 and above -0.02. Now, in the current candle, the Fast Average should be above 0 and below 0.05, while the Slow Average should be below 0 and above -0.05.
• Sell BJMA: First, we observe the previous candle, where the Fast Average must be below 0 (below the Median Average) and the percentage difference should be greater than -0.02. In relation to the Slow Average, the configuration is the same, but in the positive sense, that is, it should be above 0 and below 0.02. Now, in the current candle, the Fast Average should be below 0 and above -0.05, while the Slow Average should be above 0 and below 0.05.
Now, let's look at two signals that are commonly used to stay in a position.
# Fake Point
The Fake Point is primarily used to identify retracements before a continuation of the prevailing trend. Typically, it is preceded by a Needle Confirmation or BJMA signal. Here are some examples:
• Fake Sell (Signal to Maintain a Buy Position): The Fast Average crosses the Median from top to bottom (entering the negative pole of the Didi Index), while the Slow Average, which is already below the Median (below 0), continues to decline further, increasing the percentage difference between the Fast and Slow Averages in the negative pole.
• Fake Buy (Signal to Maintain a Sell Position): It is the same as the fake sell scenario but in the positive pole. The Fast Average crosses the Median, entering the positive pole of the Didi Index, while the Slow Average, which was already above the Median, continues to increase the percentage difference with the Median. For example, if the Slow Average was at +1 on the Didi Index, it would now be at +1.3.
There is also another variation of the Fake Breakout that takes into consideration the ADX (Average Directional Index) to confirm the trend direction. In other words, if we have a fake sell signal that suggests a buy position, we want the ADX to indicate a buying trend, and vice versa.
# Bought and Sold
This signal basically checks whether the indicators continue to confirm the previous signals. There are two variations: "Bought/Sold" and "Bought/Sold without Bollinger Bands". Let's see an example:
• Bought: The Didi Index is in the buying position, which means the Fast Average is above the Median Average (above 0), and the Slow Average is below the Median Average. Additionally, the ADX is indicating a buying trend and the Bollinger Bands are open.
• Sold: The Didi Index is in the selling position, which means the Fast Average is below 0 and the Slow Average is above 0. Moreover, the ADX is indicating a selling trend and the Bollinger Bands are open.
• Bought/Sold without Bollinger Bands: It's the same signal, but without considering whether the Bollinger Bands are open or not.
We can also consider the "Bought/Sold" signal based on the Trix and Stochastic, which would be additional confirmations of the movement.
Personally, I do not activate the Bought/Sold signal.
Now we come to signals to exit the position or take partial profits.
# Close
This exit signal is based on the following indicators: ADX, Bollinger Bands, Trix, and Stochastic. We wait for the ADX Kick or the falling ADX, along with the Bollinger Bands closing, and the Trix and Stochastic changing to the opposite side. Let's see some examples:
• Close a Buy: The ADX was in a buying trend (ADX rising and DI+ above DI-), but then the ADX Kick occurs or the ADX starts to fall. In addition, the Bollinger Bands close, and the Trix and Stochastic should switch to the sell signal.
• Close a Sell: The ADX was in a selling trend (ADX rising and DI- above DI+), but then the ADX Kick occurs or the ADX starts to fall. Also, the Bollinger Bands close, and the Trix and Stochastic should switch to the buy signal.
All indicators must provide signals together, but it is not necessary for all to occur in the exact same candle. For example:
1. The ADX Kick may occur, and the Trix and Stochastic switch to the buy signal, but the Bollinger Bands still remain open. In this case, we still do not have the exit signal.
2. In the next candle, the ADX continues to fall (after the Kick), the Trix and Stochastic continue to indicate buying, but this time the Bollinger Bands close. In this case, we have the "Close a Sell" signal.
It is important that all indicators are in accordance with the necessary signals, even if they occur in different candles, in order for the exit signal to be triggered.
# Close with Alert
This signal occurs when the Didi Index switches to the opposite side from where it was, along with a trend on the ADX, provided it's not a fake point. Let's see some examples:
• Close Buy - Sell Alert: Suppose we were in a buy position on the previous candle. In the current candle, the Fast Average crosses the Median Average from top to bottom, and the ADX indicates a sell trend. In this case, we completely close our buy position or make a partial realization.
• Close Sell - Buy Alert: Suppose we were in a sell position on the previous candle. In the current candle, the Fast Average crosses the Median Average from bottom to top, and the ADX indicates a buy trend. In this case, we completely close our sell position or make a partial realization.
------------------------------------------------------------------------------------------------------------------------------------------------------------------------------------------------------------------
Indicador baseado no Color Candles - Didi's Needles setup , mas agora focado exclusivamente na geração de alertas.
Com esse indicador, você pode configurar alertas e notificações no TradingView para até 15 ativos com base no setup de Didi Aguiar. Além disso, é possível definir se o alerta deve ser acionado no fechamento do candle ou X minutos antes do fechamento.
Também foi adicionado um filtro de sessão que permite configurar os alertas para serem acionados apenas durante uma sessão específica.
Descrição dos sinais monitorados:
O setup consiste no cruzamento de 3 médias móveis, juntamente com a análise da tendência no ADX e das bandas de Bollinger abertas.
As médias móveis serão nomeadas "Didi Index". Teremos a média de 3 períodos como "Média Rápida", a média de 8 períodos como "Média Mediana" e a média de 20 períodos como "Média Lenta". Quando a Média Rápida cruzar a Média Mediana, teremos um alerta e, quando a Média Lenta cruzar a Média Mediana, teremos uma confirmação. Para ajustar o Didi Index nos sinais, a Média Mediana foi normalizada, isto é, ela sempre será igual a 0. Para a Média Lenta e a Média Rápida, levaremos em consideração apenas a diferença percentual em relação à Média Mediana.
Além das médias móveis, analisamos se o ADX está em ascensão, com o DI+ acima do DI- para indicar uma tendência de alta, ou se o ADX está subindo, com o DI- acima do DI+ para indicar uma tendência de baixa. Também verificamos se as bandas de Bollinger estão abertas. Com essas condições, teremos uma Agulhada.
Agora vou detalhar como estabeleci isso no indicador e alguns filtros que inseri para o meu uso pessoal, além de alguns sinais adicionais do setup.
# Alerta de Agulhada
Primeiramente, temos o sinal de "Alerta de Agulhada". Este sinal acontece quando a Média Rápida cruza a Média Mediana, junto com a confirmação da tendência no ADX e a abertura das Bandas de Bollinger. O filtro está ajustado em "1", o que significa que só levaremos em consideração o alerta de agulhada quando a diferença percentual entre a Média Lenta e a Média Mediana estiver abaixo de 1%. Esse sinal pode ser utilizado como um ponto de entrada ou para monitorar o ativo. Vamos aos exemplos:
• Para um "Alerta de Compra", a Média Rápida deve cruzar a Média Mediana de baixo para cima, e a diferença percentual entre a Média Lenta e a Média Mediana deve ser menor que +1% e maior que 0, conforme indicado pelo Didi Index.
• Para um "Alerta de Venda", a Média Rápida deve cruzar a Média Mediana de cima para baixo, e a diferença percentual entre a Média Lenta e a Média Mediana deve ser maior que -1% e menor que 0, conforme indicado pelo Didi Index.
Também temos a projeção do alerta, que serve como um sinal para chamar atenção e monitorar o ativo. Eu uso um filtro de "0.1", o que significa que a diferença percentual entre a Média Rápida e a Média Mediana deve ser igual ou menor que 0.1%. Vamos ver o exemplo:
• Para uma "Projeção de Alerta de Compra", a Média Rápida deve estar abaixo da Média Mediana, e a diferença percentual entre a Média Rápida e a Média Mediana deve ser maior que -0.1% e menor que 0. Além disso, a Média Lenta deve estar acima da Média Mediana no Didi Index.
• Para uma "Projeção de Alerta de Compra", a Média Rápida deve estar abaixo da Média Mediana, e a diferença percentual entre a Média Rápida e a Média Mediana deve ser maior que -0.1% e menor que 0. Além disso, a Média Lenta deve estar acima da Média Mediana no Didi Index.
# Agulhada
Após o Alerta de Agulhada, temos a confirmação da Agulhada, que ocorre quando a Média Lenta cruza a Média Mediana após o alerta. Esse sinal é utilizado para entrar na operação. Vamos dividir esse sinal em duas partes:
1. Agulhada: Utilizamos um filtro de "3" (ajustável). Isso significa que, para ser considerada uma "Agulhada", a distância em velas entre o Alerta (cruzamento da Média Rápida com a Média Mediana) e a Confirmação (cruzamento da Média Lenta com a Média Mediana) deve ser igual ou menor que 3 velas. Além disso, é necessário ter uma tendência no ADX e as Bandas de Bollinger devem estar abertas.
2. Agulhada Queijo Minas (QM): Basicamente, é uma agulhada que ocorre fora do filtro, com uma distância em velas entre o Alerta e a Confirmação acima de "3" velas. Também é necessário ter uma tendência no ADX e as Bandas de Bollinger devem estar abertas.
Para antecipar a confirmação da Agulhada, utilizamos o sinal de "Projeção de Agulhada". Esse sinal possui dois filtros: o "Projeção de Agulhada com Alerta", configurado como "0.1%", e o "Projeção de Agulhada após o Alerta", configurado como "0.3%".
1. "Projeção de Agulhada com Alerta" gera o sinal quando ocorre o "Alerta de Agulhada" (cruzamento da Média Rápida com a Média Mediana), desde que a diferença entre a Média Lenta e a Média Mediana seja menor que 0.1%.
2. "Projeção de Agulhada após o Alerta" gera o sinal quando a Média Rápida já cruzou a Média Mediana, e a diferença entre a Média Lenta e a Média Mediana deve ser menor que 0.3%.
# BJMA (Beijo da Mulher Aranha)
Existe uma outra variação da agulhada chamada BJMA. Essencialmente, ocorre quando a Média Rápida e a Média Lenta se aproximam da Média Mediana (cada uma em um polo), mas não cruzam a Mediana e voltam para o lado de onde vieram. Nesse sinal, temos dois filtros: "Delta BJMA vela anterior" e "Delta BJMA vela atual". Vejamos um exemplo:
• BJMA de Compra: Primeiramente, observamos a vela anterior, onde a Média Rápida deve estar acima de 0 (acima da Média Mediana) e a diferença percentual deve ser menor que 0.02. Em relação à Média Lenta, a configuração é a mesma, porém no sentido negativo, ou seja, ela deve estar abaixo de 0 e acima de -0.02. Agora, na vela atual, a Média Rápida deve estar acima de 0 e abaixo de 0.05, enquanto a Média Lenta deve estar abaixo de 0 e acima de -0.05.
• BJMA de Venda: Primeiramente, observamos a vela anterior, onde a Média Rápida deve estar abaixo de 0 (abaixo da Média Mediana) e a diferença percentual deve ser maior que -0.02. Em relação à Média Lenta, a configuração é a mesma, porém no sentido positivo, ou seja, ela deve estar acima de 0 e abaixo de 0.02. Agora, na vela atual, a Média Rápida deve estar abaixo de 0 e acima de -0.05, enquanto a Média Lenta deve estar acima de 0 e abaixo de 0.05.
Agora vamos abordar dois sinais que são normalmente utilizados para manter uma posição.
# Ponto Falso (Fake Point)
O Ponto Falso é usado para identificar uma retração antes de retomar o movimento. Geralmente, ele ocorre após um sinal de Agulhada ou BJMA. Vejamos exemplos:
• Venda Falsa (sinal para manter uma posição de compra): A Média Rápida cruza a Média Mediana de cima para baixo (entrando no polo negativo do Didi Index), enquanto a Média Lenta, que já está abaixo da Média Mediana (abaixo de 0), continua caindo, aumentando assim a diferença percentual entre a Média Lenta e a Média Mediana no polo negativo.
• Compra Falsa (sinal para manter uma posição de venda): O cenário é semelhante, mas no polo positivo. A Média Rápida cruza a Média Mediana, passando para o lado positivo do Didi Index, enquanto a Média Lenta, que já estava acima da Média Mediana, continua aumentando a diferença percentual em relação à Média Mediana. Por exemplo, se a Média Lenta estava em +1 no Didi Index, agora ela está em +1.3.
Também existe uma variação do Ponto Falso em que verificamos se a tendência no ADX está se mantendo na mesma direção. Ou seja, se tivermos uma Venda Falsa (que seria um sinal para permanecermos em uma posição de compra), é importante que o ADX esteja indicando uma tendência de compra, e vice-versa. Dessa forma, consideramos não apenas o cruzamento das médias, mas também a confirmação da tendência no ADX. Essa variação é chamada de Ponto Falso com Tendência (Fake Point with Trend).
# Comprado e Vendido
Esse sinal, essencialmente, verifica se os indicadores estão mantendo a confirmação dos sinais anteriores. Existem duas variações: "Comprado/Vendido" e "Comprado/Vendido sem Bandas de Bollinger". Vejamos um exemplo:
• Comprado: O Didi Index está em compra, o que significa que a Média Rápida está acima da Média Mediana (acima de 0) e a Média Lenta está abaixo da Média Mediana. Além disso, o ADX está indicando uma tendência de compra e as Bandas de Bollinger estão abertas.
• Vendido: O Didi Index está em venda, o que significa que a Média Rápida está abaixo de 0 e a Média Lenta está acima de 0. Além disso, o ADX está indicando uma tendência de venda e as Bandas de Bollinger estão abertas.
• Comprado/Vendido sem Bollinger: É o mesmo sinal, porém sem considerar se as Bandas de Bollinger estão abertas ou não.
Podemos também considerar o "Comprado/Vendido" com base no Trix e no Estocástico, que seriam confirmações adicionais do movimento.
Eu, pessoalmente, não deixo ativado o sinal de Comprado/Vendido.
Agora chegamos aos sinais de saída da posição ou de realização parcial.
# Fechar (Close)
Este sinal de saída baseia-se nos seguintes indicadores: ADX, Bandas de Bollinger, Trix e Estocástico. Aguardamos o Kick do ADX ou o ADX em queda, juntamente com as Bandas de Bollinger se fechando, e o Trix e o Estocástico mudando para o lado oposto. Vamos ver alguns exemplos:
• Fechar uma Compra (Close Buy): O ADX estava em uma tendência de compra (ADX subindo e DI+ acima do DI-), mas em seguida ocorre o Kick do ADX ou o ADX começa a cair. Além disso, as Bandas de Bollinger se fecham e o Trix e o Estocástico devem mudar para o sinal de venda.
• Fechar uma Venda (Close Sell): O ADX estava em uma tendência de venda (ADX subindo e DI- acima do DI+), mas em seguida ocorre o Kick do ADX ou o ADX começa a cair. Além disso, as Bandas de Bollinger se fecham e o Trix e o Estocástico devem mudar para o sinal de compra.
Todos os indicadores devem fornecer os sinais em conjunto, mas não é necessário que todos ocorram exatamente na mesma vela. Por exemplo:
1. Pode ocorrer o Kick do ADX e o Trix e o Estocástico mudarem para o sinal de compra, mas as Bandas de Bollinger ainda permanecerem abertas. Nesse caso, ainda não teremos o sinal de saída.
2. No candle seguinte, o ADX continua caindo (após o Kick), o Trix e o Estocástico continuam indicando compra, mas desta vez as Bandas de Bollinger se fecham. Nesse caso, teremos o sinal de "Fechamento de uma Venda".
É importante que todos os indicadores estejam em conformidade com os sinais necessários, mesmo que ocorram em velas diferentes, para que seja acionado o sinal de saída.
# Fechar com Alerta (Close with Alert)
Esse sinal ocorre quando o Didi Index muda para o lado oposto do que estava, juntamente com uma tendência no ADX, desde que não seja um ponto falso. Vejamos exemplos:
• Fechar Compra - Alerta de Venda: Suponha que estávamos em uma posição de compra no candle anterior. No candle atual, a Média Rápida cruza a Média Mediana de cima para baixo, e o ADX indica uma tendência de venda. Nesse caso, encerramos completamente nossa posição de compra ou realizamos uma realização parcial.
• Fechar Venda – Alerta de Compra: Suponha que estávamos em uma posição de venda no candle anterior. No candle atual, a Média Rápida cruza a Média Mediana de baixo para cima, e o ADX indica uma tendência de compra. Nesse caso, encerramos completamente nossa posição de venda ou realizamos uma realização parcial.

Superior-Range Bound Renko - Alerts - 11-29-25 - Signal LynxSuperior-Range Bound Renko – Alerts Edition with Advanced Risk Management Template
Signal Lynx | Free Scripts supporting Automation for the Night-Shift Nation 🌙
1. Overview
This is the Alerts & Indicator Edition of Superior-Range Bound Renko (RBR).
The Strategy version is built for backtesting inside TradingView.
This Alerts version is built for automation: it emits clean, discrete alert events that you can route into webhooks, bots, or relay engines (including your own Signal Lynx-style infrastructure).
Under the hood, this script contains the same core engine as the strategy:
Adaptive Range Bounding based on volatility
Renko Brick Emulation on standard candles
A stack of Laguerre Filters for impulse detection
K-Means-style Adaptive SuperTrend for trend confirmation
The full Signal Lynx Risk Management Engine (state machine, layered exits, AATS, RSIS, etc.)
The difference is in what we output:
Instead of placing historical trades, this version:
Plots the entry and RM signals in a separate pane (overlay = false)
Exposes alertconditions for:
Long Entry
Short Entry
Close Long
Close Short
TP1, TP2, TP3 hits (Staged Take Profit)
This makes it ideal as the signal source for automated execution via TradingView Alerts + Webhooks.
2. Quick Action Guide (TL;DR)
Best Timeframe:
4H and above. This is a swing-trading / position-trading style engine, not a micro-scalper.
Best Assets:
Volatile but structured markets, e.g.:
BTC, ETH, XAUUSD (Gold), GBPJPY, and similar high-volatility majors or indices.
Script Type:
indicator() – Alerts & Visualization Only
No built-in order placement
All “orders” are emitted as alerts for your external bot or manual handling
Strategy Type:
Volatility-Adaptive Trend Following + Impulse Detection
using Renko-like structure and multi-layer Laguerre filters.
Repainting:
Designed to be non-repainting on closed candles.
The underlying Risk Management engine is built around previous-bar data (close , high , low ) for execution-critical logic.
Intrabar values can move while the bar is forming (normal for any advanced signal), but once a bar closes, the alert logic is stable.
Recommended Alert Settings:
Condition: one of the built-in signals (see section 3.B)
Options: “Once Per Bar Close” is strongly recommended for automation
Message: JSON, CSV, or simple tokens – whatever your webhook / relay expects
3. Detailed Report: How the Alerts Edition Works
A. Relationship to the Strategy Version
The Alerts Edition shares the same internal logic as the strategy version:
Same Adaptive Lookback and volatility normalization
Same Range and Close Range construction
Same Renko Brick Emulator and directional memory (renkoDir)
Same Fib structures, Laguerre stack, K-Means SuperTrend, and Baseline signals (B1, B2)
Same Risk Management Engine and layered exits
In the strategy script, these signals are wired into strategy.entry, strategy.exit, and strategy.close.
In the alerts script:
We still compute the final entry/exit signals (Fin, CloseEmAll, TakeProfit1Plot, etc.)
Instead of placing trades, we:
Plot them for visual inspection
Expose them via alertcondition(...) so that TradingView can fire alerts.
This ensures that:
If you use the same settings on the same symbol/timeframe, the Alerts Edition and Strategy Edition agree on where entries and exits occur.
(Subject only to normal intrabar vs. bar-close differences.)
B. Signals & Alert Conditions
The alerts script focuses on discrete, automation-friendly events.
Internally, the main signals are:
Fin – Final entry decision from the RM engine
CloseEmAll – RM-driven “hard close” signal (for full-position exits)
TakeProfit1Plot / 2Plot / 3Plot – One-time event markers when each TP stage is hit
On the chart (in the separate indicator pane), you get:
plot(Fin) – where:
+2 = Long Entry event
-2 = Short Entry event
plot(CloseEmAll) – where:
+1 = “Close Long” event
-1 = “Close Short” event
plot(TP1/TP2/TP3) (if Staged TP is enabled) – integer tags for TP hits:
+1 / +2 / +3 = TP1 / TP2 / TP3 for Longs
-1 / -2 / -3 = TP1 / TP2 / TP3 for Shorts
The corresponding alertconditions are:
Long Entry
alertcondition(Fin == 2, title="Long Entry", message="Long Entry Triggered")
Fire this to open/scale a long position in your bot.
Short Entry
alertcondition(Fin == -2, title="Short Entry", message="Short Entry Triggered")
Fire this to open/scale a short position.
Close Long
alertcondition(CloseEmAll == 1, title="Close Long", message="Close Long Triggered")
Fire this to fully exit a long position.
Close Short
alertcondition(CloseEmAll == -1, title="Close Short", message="Close Short Triggered")
Fire this to fully exit a short position.
TP 1 Hit
alertcondition(TakeProfit1Plot != 0, title="TP 1 Hit", message="TP 1 Level Reached")
First staged take profit hit (either long or short). Your bot can interpret the direction based on position state or message tags.
TP 2 Hit
alertcondition(TakeProfit2Plot != 0, title="TP 2 Hit", message="TP 2 Level Reached")
TP 3 Hit
alertcondition(TakeProfit3Plot != 0, title="TP 3 Hit", message="TP 3 Level Reached")
Together, these give you a complete trade lifecycle:
Open Long / Short
Optionally scale out via TP1/TP2/TP3
Close remaining via Close Long / Close Short
All while the Risk Management Engine enforces the same logic as the strategy version.
C. Using This Script for Automation
This Alerts Edition is designed for:
Webhook-based bots
Execution relays (e.g., your own Lynx-Relay-style engine)
Dedicated external trade managers
Typical setup flow:
Add the script to your chart
Same symbol, timeframe, and settings you use in the Strategy Edition backtests.
Configure Inputs:
Longs / Shorts enabled
Risk Management toggles (SL, TS, Staged TP, AATS, RSIS)
Weekend filter (if you do not want weekend trades)
RBR-specific knobs (Adaptive Lookback, Brick type, ATR vs Standard Brick, etc.)
Create Alerts for Each Event Type You Need:
Long Entry
Short Entry
Close Long
Close Short
TP1 / TP2 / TP3 (optional, if your bot handles partial closes)
For each:
Condition: the corresponding alertcondition
Option: “Once Per Bar Close” is strongly recommended
Message:
You can use structured JSON or a simple token set like:
{"side":"long","event":"entry","symbol":"{{ticker}}","time":"{{timenow}}"}
or a simpler text for manual trading like:
LONG ENTRY | {{ticker}} | {{interval}}
Wire Up Your Bot / Relay:
Point TradingView’s webhook URL to your execution engine
Parse the messages and map them into:
Exchange
Symbol
Side (long/short)
Action (open/close/partial)
Size and risk model (this script does not position-size for you; it only signals when, not how much.)
Because the alerts come from a non-repainting, RM-backed engine that you’ve already validated via the Strategy Edition, you get a much cleaner automation pipeline.
D. Repainting Protection (Alerts Edition)
The same protections as the Strategy Edition apply here:
Execution-critical logic (trailing stop, TP triggers, SL, RM state changes) uses previous bar OHLC:
open , high , low , close
No security() with lookahead or future-bar dependencies.
This means:
Alerts are designed to fire on states that would have been visible at bar close, not on hypothetical “future history.”
Important practical note:
Intrabar: While a bar is forming, internal conditions can oscillate.
Bar Close: With “Once Per Bar Close” alerts, the fired signal corresponds to the final state of the engine for that candle, matching your Strategy Edition expectations.
4. For Developers & Modders
You can treat this Alerts script as an ”RM + Alert Framework” and inject any signal logic you want.
Where to plug in:
Find the section:
// BASELINE & SIGNAL GENERATION
You’ll see how B1 and B2 are built from the RBR stack and then combined:
baseSig = B2
altSig = B1
finalSig = sigSwap ? baseSig : altSig
To use your own logic:
Replace or wrap the code that sets baseSig / altSig with your own conditions:
e.g., RSI, MACD, Heikin Ashi filters, candle patterns, volume filters, etc.
Make sure your final decision is still:
2 → Long / Buy signal
-2 → Short / Sell signal
0 → No trade
finalSig is then passed into the RM engine and eventually becomes Fin, which:
Drives the Long/Short Entry alerts
Interacts with the RM state machine to integrate properly with AATS, SL, TS, TP, etc.
Because this script already exposes alertconditions for key lifecycle events, you don’t need to re-wire alerts each time — just ensure your logic feeds into finalSig correctly.
This lets you use the Signal Lynx Risk Management Engine + Alerts wrapper as a drop-in chassis for your own strategies.
5. About Signal Lynx
Automation for the Night-Shift Nation 🌙
Signal Lynx builds tools and templates that help traders move from:
“I have an indicator” → “I have a structured, automatable strategy with real risk management.”
This Superior-Range Bound Renko – Alerts Edition is the automation-focused companion to the Strategy Edition. It’s designed for:
Traders who backtest with the Strategy version
Then deploy live signals with this Alerts version via webhooks or bots
While relying on the same non-repainting, RM-driven logic
We release this code under the Mozilla Public License 2.0 (MPL-2.0) to support the Pine community with:
Transparent, inspectable logic
A reusable Risk Management template
A reference implementation of advanced adaptive logic + alerts
If you are exploring full-stack automation (TradingView → Webhooks → Exchange / VPS), keep Signal Lynx in your search.
License: Mozilla Public License 2.0 (Open Source).
If you build improvements or helpful variants, please consider sharing them back with the community.

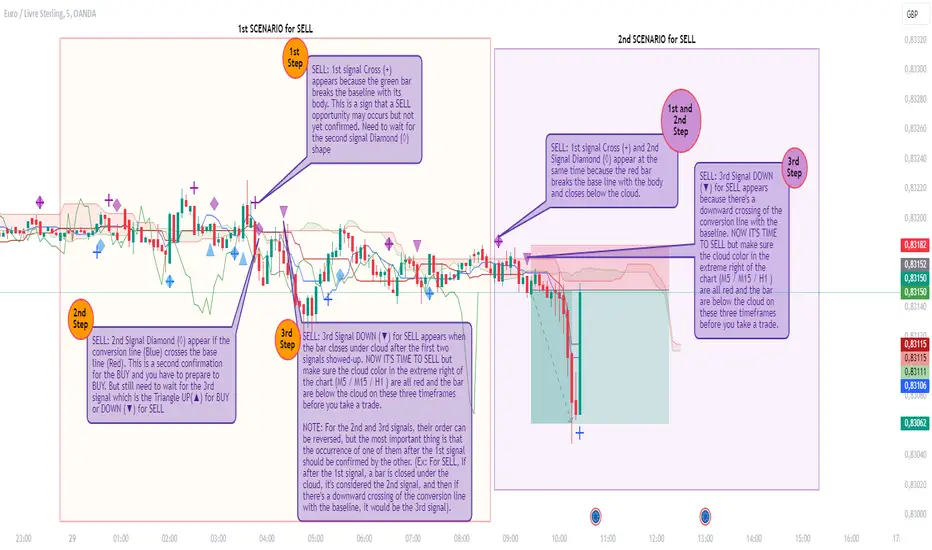
Rado Ichi Alerts v1.2This indicator is based on the “Ichimuko Cloud” indicator, but in addition, it can display signals in graphs and can also send you an alert for each signal.
Indeed, this script uses the open-source Ichimoku Cloud standard. However, the additional features I've implemented, such as the display of different signals (e. g : Cross (+) “First signal” to warn about BUY or SELL opportunities that could arise, Diamond (◊) “Second signal” to warn about BUY or SELL preparation and Triangle UP(▲) or DOWN (▼) “Third and last signal” for BUY or SELL NOW action) as well as the ability to configure ALERTS related to these signals are not included in the standard Ichimoku Cloud script and are also not reproduced by the Ichimuko Cloud script.
The logic behind these signals is based on a customized Ichimoku strategy that we've been able to develop over a long period of back-testing.
What makes this script unique and original is its capacity to display signals and at the same time send alerts for each signal. This can help traders to not sit in front of their screens all the time and only take action when the third signal appears with an alert. Then, traders visually check whether the signal is valid in relation to the strategy before placing a trade.
This is the reason why I put my script in Closed-source.
Types of Signals and Alerts: (See also the chart for more explanation)
1) Cross (+): This means that an opportunity arises when it appears (BUY or SELL). The alert associated with this signal is the “1st Alert”, which you can view and configure in the alerts dialog box during its creation. Default message for this alert: “Ichi_Opportunity_(BUY or SELL) ”.
2) Diamond (◊): This means you should get ready to (BUY or SELL). Normally, this signal appears after the Cross (+) but it can appear at the same time as the Cross (+).The alert associated with this signal is the “2nd Alert” which you can see and configure in the alerts dialog box during its creation. Default message for this alert: “Ichi_Prepare_to_(BUY or SELL) ”.
3) Rectangle Up or Down (▲ / ▼): This means you should (BUY or SELL) now. Normally, this signal appears after the Diamond (◊) but it can appear at the same time as the Diamond (◊). The alert associated with this signal is the “3rd Alert”, which you can view and configure in the alerts dialog box during its creation. Default message for this alert: “Ichi_(BUY or SELL)_NOW ”.
Alerts can be configured for BUY or SELL only, depending on your needs (and the bias you've chosen). Alert messages can also be customized.
You can also choose the alerts that interest you, (e.g. 2nd Alert only so you can prepare, or 3rd Alert only if you only need to be alerted when you should take action to buy or sell). But you can combine all three alerts on a single chart.
CORRECTIVE :
- Correction to display missing signals (which are not displayed sometimes) on each step of the strategy.
IMPROVEMENTS :
- A new function has been added to the indicator dialog to change the reset time for the first two signals if they are not triggered within 10 bars (default value) after their last execution. This feature is necessary to better organize (visualize) the display of signals.
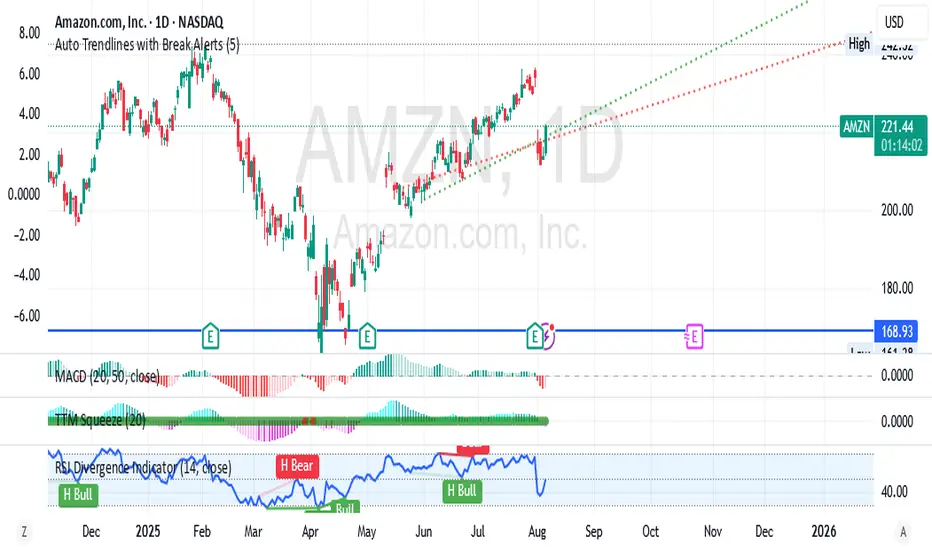
Auto Trendlines with Break AlertsIdentify the two most recent significant swing highs and swing lows based on a customizable pivot length.
Draw trendlines extending from these points.
Provide an optional visual signal (a small diamond on the chart) and a alertcondition for sound/push notifications when a trendline is broken.
Configure: Once the indicator is on your chart, you can click on the gear icon (⚙️) next to its name to adjust the settings. You will see a checkbox to enable/disable alerts and a slider to change the pivot length.
Configuring Alerts in TradingView
The alertcondition lines in the code allow you to set up official TradingView alerts for sound and push notifications.
Create an Alert: Click the clock icon (⏰) on the right-side toolbar of your TradingView chart.
Set the Condition: In the "Condition" field, select the name of the indicator: "Auto Trendlines with Break Alerts".
Choose the Alert Type: A second dropdown will appear. Select either "High Trendline Broken" or "Low Trendline Broken" to specify which break you want to be alerted for.
Select Notification Options: In the "Notifications" section, you can check the boxes for "Play sound," "Send email," "Send push notification," etc.
Create the Alert: Click "Create" to save your alert.
TheStrat AlertsFinally, an indicator that will monitor and send notification for any potential 'TheStrat' candle combination setups.
Explanation of 'TheStrat' trading technique
‘ TheStrat ’ technique works off the basis of labelling whether the focus candle did or did not break any of the previous candles high or low values. There are three possible label definitions; either a 1 candle, 2 candle or a 3 candle.
1 bar (inside) - If price movement on the new candle remains within the high and low of previous candle.
3 bar (outside) – If price movement went above both the high and the low of the previous candle.
2 bar (directional) – If price movement only broke with the high (called a 2-up) or if price movement only broke the low of the previous candle (called a 2-down).
Once labelled the technique then looks for certain combination of these labelled candles (called actionable setups) such as: 2-1-2, 1-2-2, 3-1-2.
How does the indicator work?
This indicator will monitor and alert you when a possible ‘ TheStrat ’ actionable combination is identified on any ticker and timeframe you add the indicator to and then register an alert. The key decisions are which TICKER and which TIMEFRAME to register the alert and lastly what actionable ‘ TheStrat ’ combination to enable in the indicator settings.
When a registered alert is running it will continually monitor for the enabled ' TheStrat ' conditions and upon the bar close of a defined condition, it generates the alert notification using the existing built-in TradingView alert feature. This indicator is not market or timeframe specific, in fact this alerting indicator can be used to register alerts on multiple tickers and timeframes simultaneously.
Example of how to use the indicator
Assume you are interested in being alerted for any ‘2-1-2’ combination on AAPL on the 30min timeframe. You would simply go to that chart (APPL on 30 min), add ' TheStrat Alerts ' indicator to the chart. Ensure the 2-1-x condition is enabled in the indicator setting. Then using the built-in TradingView - 'Create Alert' feature to register the alert that will listening to 'TheStrat Alerts' indicator monitored events. In this example the alert will specifically trigger if it finds a 2-1 bar setup and send the alert of a possible 2-1-2 setup allowing you to jump to the chart to review.
Description of the script
The script work by monitoring the development of new candles and when it finds a potential developing combination it will generate an alert prior to the completion of the actionable signal.
The following 'TheStrat' combinations have been coded.
2-1-? candle setup (expect 2-1-2)
3-1-? candle setup (expect 3-1-2)
1-2-? candle setup (expect 1-2-2 rev)
3-2-? candle setup (expect 3-2-2 rev)
2d-2d-? or 2u-2u-? (expect 2-2 rev)
"Randy Jackson" 2u-2u-2d-? or 2d-2d-2u-? candle setup
5 consecutive 2u or 5 consecutive 2d "Pivot Machine Gun" candle setup
50% retracement after a 2u
50% retracement after a 2d
Failed 2u - candle that closed red, instead of green
Failed 2d - candle that closed green, instead of red.
1-3 "Nirvana" candle setup
1 candle and 3 candle formation
How is this useful to a trader?
This unequivocally original and useful indicator relieves the need to sit and monitor all the tickers and timeframes you can simply place the alert indicator, enable the conditions under which you wish to be alerted and let it monitor for you.
The clear value of the indicator is the increased ability to find potential setups to trade when certain conditions have been identified.
TO ENABLE, please follow these steps:
1) Add indicator to your TICKER choice and TIMEFRAME of your choice.
2) Open the indicator options/settings (cog wheel of indicator) and select the checkboxes to enable which conditions you want to be alerted on. Start off with a few specific setups to get the hang of the indicator. Then OK the indicator setting window to close it.
3) Next find along the of the screen the 'Create Alert' icon (watch icon with + symbol). Click it will open the ' Create Alert ' settings.
4) For CONDITION , drop down and select ' TheStrat Alerts ' so that the alert will listen for the alerts you selected in the indicator settings.
5) Expand 'More options' to select notification preference like pop-up, sound or email
6) Finally click on ' CREATE ' to register the alerts
The indicator will now generate alerts for the options you enabled in the indicator. Please delete and re-register the alert if you changed any settings in the indicator, for example a different condition.
This indicator is not merging multiple indicators as it uses only the default TradingView alert functionality, and the source code is based on my other highly successful free indicator. The indicator does not infer future performance but does notify of the potential actionable ' TheStrat ' setup prior to the completion of the ' TheStrat ' combination. It is also an independent and standalone indicator and does not rely on any of my other published indicators.
This is a paid private invite-only indicator, if you want a trial, please contact me by sending a private message through TradingView.
Good Luck with trading and I hope this indicator helps to increase the profitability of your portfolio. Happy Trading.

Volume Crisis Created by Alphaomega18
🎯 What is the Crisis Detector Pro?
The Crisis Detector Pro is an advanced multi-component indicator that detects market crisis situations by simultaneously analyzing:
Volume: Anomalies and volume spikes
VIX: Volatility Index (S&P 500)
ATR: True volatility (all assets)
Open Interest: Estimated open interest (futures contracts)
The indicator calculates a Composite Crisis Score (0-100) that combines these elements to alert you to critical market moments.
📊 Indicator Components
1️⃣ Volume Analysis
Anomaly detection: Compares current volume to its moving average
Classification:
🟡 Moderate: 1.5x - 2x average
🟠 High: 2x - 3x average
🔴 Extreme: > 3x average
Bollinger Bands: Detects volume breakouts
Clusters: Identifies 3+ consecutive days of anomalies
2️⃣ VIX (Fear Index)
S&P 500 only
Default thresholds:
🟡 Moderate: VIX > 20
🟠 High: VIX > 30
🔴 Extreme: VIX > 40
3️⃣ ATR (Average True Range)
Measures true volatility
Compatible with all assets (stocks, futures, forex, crypto)
Compares current ATR to its average
4️⃣ Open Interest (OI)
Estimation based on Volume / 2
Detects changes > 25%
Inverted colors:
🔴 Red: OI increase (new positions)
🟢 Green: OI decrease (position closing)
⚙️ Main Parameters
Calculations:
Moving Average Period: 20 (default)
Standard Deviation Period: 20
ATR Period: 14
Volume Thresholds:
Moderate: 1.5x
High: 2.0x
Extreme: 3.0x
Composite Score (Weights):
Volume: 35%
VIX: 25%
ATR: 20%
Open Interest: 20%
📈 Visual Signals
Top of Chart:
🟡 Yellow triangle: Moderate alert (Score 50-70)
🟠 Orange triangle: High alert (Score 70-85)
🔴 Red triangle: EXTREME CRISIS (Score 85-100)
⚠️ Purple cross: Reinforced signal (Volume + Volatility simultaneous)
Bottom of Chart:
💎 Purple diamond: 50-day volume record
⬛ Fuchsia square: Cluster (3+ abnormal days)
Volume Bars:
Gray: Normal volume
🟡 Yellow: Moderate volume
🟠 Orange: High volume
🔴 Red: Extreme volume
Open Interest Curve:
🔵 Blue: Normal variation
🔴 Red: Increase > 25%
🟢 Green: Decrease > 25%
🎯 How to Use the Indicator
1. Initial Setup
For S&P 500 / US Indices:
Enable VIX ✅
Enable ATR ✅
Enable OI ✅
Composite Score ✅
For Other Assets (Forex, Crypto, Stocks):
Disable VIX ❌
Enable ATR ✅
Enable OI (optional)
Composite Score ✅
2. Crisis Score Interpretation
ScoreLevelMeaningAction0-50Normal ✅Calm marketNormal trading50-70Vigilance 🟡Volatility risingIncreased monitoring70-85Danger 🟠Critical situationReduce exposure85-100Crisis 🔴MAXIMUM ALERTCapital protection
3. Trading Strategies
Directional Trading:
Reinforced signal ⚠️ = Powerful move in progress
Enter in direction of movement with confirmation
Tight stops, quick targets
Risk Management:
Score > 70 → Reduce position size by 50%
Score > 85 → Stop trading or ultra-short positions
Cluster detected → Avoid new trades
Scalping/Day Trading:
Extreme volume 🔴 = Scalping opportunities
Wait for confirmation before entering
Exit quickly on spikes
Swing Trading:
Avoid opening swings during crises
Protect existing positions (trailing stops)
Wait for return to normal (Score < 50)
4. Open Interest (Futures):
OI Increase (🔴 Red):
New positions opened
Strong market conviction
Movement may intensify
OI Decrease (🟢 Green):
Position closing
Profit-taking or stop losses
Possible reversal
🔔 Configurable Alerts
The indicator includes 8 types of alerts:
🟡 Moderate Crisis Alert: Score 50-70
🟠 HIGH Crisis ALERT: Score 70-85
🔴 MAJOR CRISIS: Score 85-100
⚠️ REINFORCED SIGNAL: Extreme Volume + Volatility simultaneous
💎 RECORD Volume: Highest volume over 50 days
📊 Cluster DETECTED: 3+ consecutive abnormal days
📈 OI SPIKE >25%: Sharp Open Interest increase
📉 OI DECLINE >25%: Sharp Open Interest decrease
Setup: Right-click on chart → "Add Alert" → Select alert
💡 Optimization Tips
Scalping (1-5min):
MA Period: 10-15
Moderate Threshold: 1.3x
High Threshold: 1.8x
Volume Weight: 50%
Day Trading (15min-1H):
MA Period: 20 (default)
Thresholds: Default
Composite Score: Enabled
Swing Trading (4H-Daily):
MA Period: 30-50
StdDev Multiplier: 2.5
ATR Period: 20
Volatile Markets (Crypto):
Moderate Threshold: 1.8x
High Threshold: 2.5x
Extreme Threshold: 4.0x
ATR Weight: 30%
📊 Statistics Table
The real-time table displays:
Crisis Score: 0-100 with color coding
Current volume: Value and ratio
Volume Score: Contribution to total score
Open Interest: Estimated value and % change
VIX: Current value (if enabled)
ATR: Ratio to average
Global STATUS: Normal ✅ / Vigilance 🟡 / Danger 🟠 / Crisis 🔴
⚠️ Warnings and Limitations
❌ Limitations:
Open Interest is estimated (Volume / 2), not real value
VIX only works for S&P 500
False signals possible in very volatile markets
✅ Best Practices:
Always combine with classic technical analysis
Never trade solely on alerts
Adapt thresholds to your asset and timeframe
Backtest before using live
Respect your risk management plan
🎓 Real Use Cases
Example 1: Flash Crash
Extreme volume 🔴 + Extreme ATR 🔴 + Reinforced signal ⚠️
Composite score > 90
Action: No new trades, protect existing positions
Example 2: Fed Announcement
VIX > 35 + Moderate volume 🟡 + OI rising 🔴
Composite score: 65
Action: Reduce position size, widen stops
Example 3: Volatility Squeeze
Cluster detected + Volume record 💎 + OI declining 🟢
Action: Scalping opportunity in breakout direction
📈 Performance
Real-time detection (0 lag)
Compatible all markets and timeframes
Low resource consumption
Complete history preserved

Supertrend + MACD Trend Change with AlertsDetailed Guide
1. Indicator Overview
Purpose:
This script combines the Supertrend and MACD indicators to help you detect potential trend changes. It plots a Supertrend line (green for bullish, red for bearish) and marks the chart with shapes when a trend reversal is signaled by both indicators. In addition, it includes alert conditions so that you can be notified when a potential trend change occurs.
How It Works:
Supertrend: Uses the Average True Range (ATR) to determine dynamic support and resistance levels. When the price crosses these levels, it signals a possible change in trend.
MACD: Focuses on the crossover between the MACD line and the signal line. A bullish crossover (MACD line crossing above the signal line) suggests upward momentum, while a bearish crossover (MACD line crossing below the signal line) suggests downward momentum.
2. Supertrend Component
Key Parameters:
Factor:
Function: Multiplies the ATR to create an offset from the mid-price (hl2).
Adjustment Impact: Lower values make the indicator more sensitive (producing more frequent signals), while higher values result in fewer, more confirmed signals.
ATR Period:
Function: Sets the number of bars over which the ATR is calculated.
Adjustment Impact: A shorter period makes the ATR react more quickly to recent price changes (but can be noisy), whereas a longer period provides a smoother volatility measurement.
Trend Calculation:
The script compares the previous close with the dynamically calculated upper and lower bands. If the previous close is above the upper band, the trend is set to bullish (1); if it’s below the lower band, the trend is bearish (-1). The Supertrend line is then plotted in green for bullish trends and red for bearish trends.
3. MACD Component
Key Parameters:
Fast MA (Fast Moving Average):
Function: Represents a shorter-term average, making the MACD line more sensitive to recent price movements.
Slow MA (Slow Moving Average):
Function: Represents a longer-term average to smooth out the MACD line.
Signal Smoothing:
Function: Defines the period for the signal line, which is a smoothed version of the MACD line.
Crossover Logic:
The script uses the crossover() function to detect when the MACD line crosses above the signal line (bullish crossover) and crossunder() to detect when it crosses below (bearish crossover).
4. Combined Signal Logic
How Signals Are Combined:
Bullish Scenario:
When the MACD shows a bullish crossover (MACD line crosses above the signal line) and the Supertrend indicates a bullish trend (green line), a green upward triangle is plotted below the bar.
Bearish Scenario:
When the MACD shows a bearish crossover (MACD line crosses below the signal line) and the Supertrend indicates a bearish trend (red line), a red downward triangle is plotted above the bar.
Rationale:
By combining the signals from both indicators, you increase the likelihood that the detected trend change is reliable, filtering out some false signals.
5. Alert Functionality
Alert Setup in the Code:
The alertcondition() function is used to define conditions under which TradingView can trigger alerts.
There are two alert conditions:
Bullish Alert: Activated when there is a bullish MACD crossover and the Supertrend confirms an uptrend.
Bearish Alert: Activated when there is a bearish MACD crossover and the Supertrend confirms a downtrend.
What Happens When an Alert Triggers:
When one of these conditions is met, TradingView registers the alert condition. You can then create an alert in TradingView (using the alert dialog) and choose one of these alert conditions. Once set up, you’ll receive notifications (via pop-ups, email, or SMS, depending on your settings) whenever a trend change is signaled.
6. User Adjustments and Their Effects
Factor (Supertrend):
Adjustment: Lowering the factor increases sensitivity, resulting in more frequent signals; raising it will filter out some signals, making them potentially more reliable.
ATR Period (Supertrend):
Adjustment: A shorter ATR period makes the indicator more responsive to recent price movements (but can introduce noise), while a longer period smooths out the response.
MACD Parameters (Fast MA, Slow MA, and Signal Smoothing):
Adjustment:
Shortening the Fast MA increases sensitivity, generating earlier signals that might be less reliable.
Lengthening the Slow MA produces a smoother MACD line, reducing noise.
Adjusting the Signal Smoothing changes how quickly the signal line responds to changes in the MACD line.
7. Best Practices and Considerations
Multiple Confirmation:
Even if both indicators signal a trend change, consider confirming with additional analysis such as volume, price action, or other indicators.
Market Conditions:
These indicators tend to perform best in trending markets. In sideways or choppy conditions, you may experience more false alerts.
Backtesting:
Before applying the indicator in live trading, backtest your settings to ensure they suit your trading style and the market conditions.
Risk Management:
Always use proper risk management, including stop-loss orders and appropriate position sizing, as alerts may occasionally produce late or false signals.
Happy trading!

Market Structure & Session Alerts### Market Structure & Session Alerts Indicator
#### Overview
The "Market Structure & Session Alerts" indicator is a comprehensive tool designed to assist traders in identifying key market structure levels, detecting liquidity sweeps, and receiving alerts for specific trading sessions. This indicator is particularly useful for traders who want to keep an eye on previous high and low levels and be alerted during pre-London and pre-New York sessions.
#### Features
1. **Previous High/Low Levels:**
- **Daily, Weekly, and Monthly Highs and Lows:** The indicator plots the previous day, week, and month high and low levels on the chart. These levels can be crucial for identifying support and resistance zones.
- **Toggle Display:** Users can choose to show or hide these levels using the "Show Previous Day/Week/Month High/Low" option.
2. **Liquidity Sweep Detection:**
- **Liquidity Sweep Identification:** The indicator detects liquidity sweeps when the current price closes above the previous day's high. This can signal potential reversals or continuations in the market.
- **Visual Alerts:** When a liquidity sweep is detected, a green triangle is plotted below the bar.
3. **Session Alerts:**
- **Session Timings:** Users can set specific start and end times for the pre-London and pre-New York sessions to match their timezone.
- **Visual Background Highlight:** The background of the chart is highlighted in yellow during the defined session times to provide a visual cue.
- **Alert Messages:** The indicator can generate alerts to notify traders when the market enters the pre-London or pre-New York session.
4. **Current Price Line:**
- The current price is plotted as a black line, providing a clear visual reference for the current market price.
#### How to Use
1. **Input Parameters:**
- `Show Previous Day/Week/Month High/Low`: Enable or disable the display of previous high/low levels.
- `Show Liquidity Sweep`: Enable or disable the detection and display of liquidity sweeps.
- `Show Session Alerts`: Enable or disable session alerts and background highlights.
2. **Session Timing Adjustments:**
- Set the `Pre-London Start`, `Pre-London End`, `Pre-New York Start`, and `Pre-New York End` times according to your timezone to ensure accurate session alerts.
3. **Alerts:**
- Make sure alerts are enabled in your TradingView settings to receive notifications when the market enters the pre-London or pre-New York sessions.
#### Example Use Cases
- **Day Traders:** Identify potential support and resistance levels using the previous day's high and low.
- **Swing Traders:** Use weekly and monthly high and low levels to determine significant market structure points.
- **Scalpers:** Detect liquidity sweeps to identify potential quick trades.
- **Session Traders:** Be alerted when the market enters key trading sessions to align your trading strategy with major market activities.
This indicator combines multiple market analysis tools into one, providing a robust system for traders to enhance their trading decisions and market awareness.

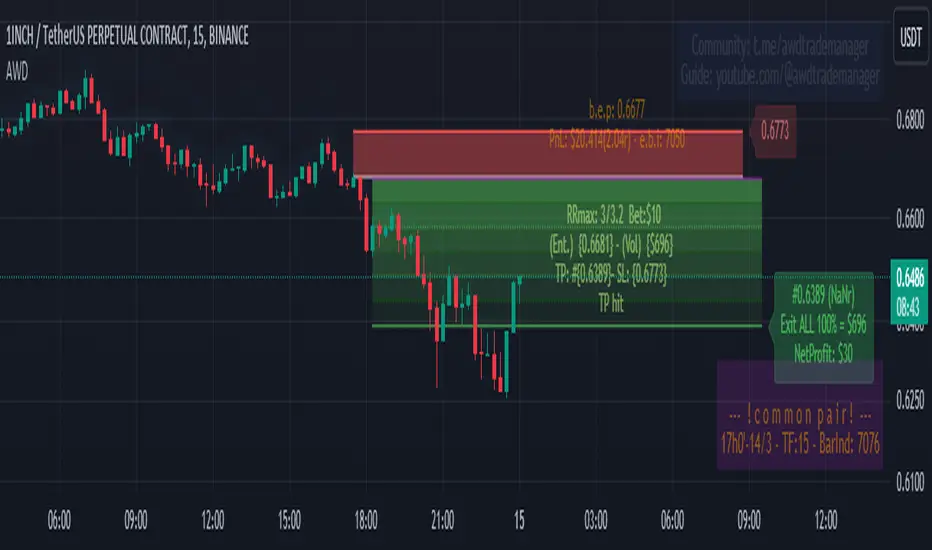
AWD TRADE MANAGER (ATM) by ManhDNAWD TRADE MANAGER (ATM) is a position management tool including with some advanced features and entry suggestions. It helps you to do most of position calculations and position management, reduce time spent for charting by alerts.
There are 3 main things to describe about the manager:
(1) The original function of the manager is to help traders to manage their trades with automatic calculations of all factors of their trades with some of input values. For example, it will calculate the trade volume when you enter the bet size, entry and stop loss price. It calculates take profit price when you enter entry, stop loss prices and the risk/reward ratio, …
(2) Another function is the system of alerts. After set up a trade, create an alert and the manager will do the rest. It will send you an alert when the limit order got filled, got stopped out, take profit level hit, or even it reached a key level or an opposite/spike move just occurred…
(3) Entry suggestions: Suggest entries with price action strategies. Details bellow.
Features in details:
(1) Automatic calculations:
- Auto calculate trade volume based on entry, stop loss prices and the money users willing to lose when the trade is failed. Auto detect some type of assets and volume will be calculated in USD (for cryptocurrencies) or in lot (for forex).
- Auto calculate take profit price based on entry, stop loss prices and expected rr ratio.
-Auto suggest take profit price based on pivot points.
- Auto suggest stop loss price based on pivot points.
- You can enter several exit points with percentages and the manager will calculate the averaged risk reward ratio you earned after the last exit price reached.
- Quick entry price pick to reduce typing requirement.
- Quick trade set up: 2 checkboxes and 1 number entering to set up a trade.
(2) Alert system
After setting up a trade and creating an alert of the manager, it will follow the market and your order. It will send you alerts for all the events that you should follow up your position. These alerts can be sent to your pc, your phone and your smart watch, so even you are a full-time day trader, you will save your time for charting or managing your positions. Here’s the list of alerts:
- Sending alert when suggesting an entry with details calculated from preset inputs so you can just pick that info to enter the position including trading volume, entry, stop loss, take profit prices, timeframe, estimated risk-reward ratio …
- Sending alert when a limit order got filled and auto switch to position-managing-mode.
- Sending alert when a limit order in still staying unfilled but should be canceled (because of price reaching a key level or is running too far, …)
- Sending alert when the position got stopped out or TP hit.
- Sending alert when the running position reached a key level and need to be watched out.
- Sending alert when a spike move or opposite move just occurred.
- Sending alert when a position is taking too long to run.
- You can also set 3 levels of price with messages then ATM will send you alerts when price reaches those levels.
- When price runs, ATM might suggest you to move stop loss to levels based on pivot points by sending you alerts.
- Alert when a BOS occurred.
- Options to turn on/off each kind of alert.
(3) Entry suggestions.
The script included price action entry suggestions.
The 1st strategy is getting in a position when a candle pattern occurred and confirmed by MA20.
The 2nd strategy is detecting double top/bottom and a candle pattern confirm break out after that.
The 3rd strategy is a pullback strategy, in a trending market, a candle pattern occurs and confirms the pullback ends, it will suggest an entry.
All those strategies I am using by myself for a long period of time but to make sure they are good for your trading style, do your own research and backtest before use. Keep in mind to manage risk and be responsible to your capital.
User side modifications:
- Those price action strategies have some major arguments that users can tune themselves to make it meet their style or their needs like choosing method to suggest entries, refine entry quality by changing the confirmation methods,…
- Most of appearance factors can be changed by users.
- one-click to toggle between full features and simple mode.
TradingView Chart demo pictures:
Author's bio:
I have been a full-time day trader for 7 years. I like coding with Pinescript and I also developed some helpful indicators that provide unique aspects to approach markets and the most favorite one from that is Relative Volume Index (RVI) that will be introduced in near future.
Disclaimer:
This tool has been tested and been using for my own trading career for a long period of time but practicing to use it yourself to understand it and use it correctly is needed. All of the features have been carefully tested before publishing but make sure to double-check all the info you get from it before getting into a trade to avoid losing money by a sudden mistake or even a bug. Keep in mind you will need to take all the responsibility with your capital or any potential loss while using this tool.
If you get anything wrong while using it, please leave some comments bellow, all of your ideas or suggestions will be taken seriously.
Thank you in advance!
(It is not possible to explain all the settings or features within the description, If you have questions, please leave comment, I will answer to help you to get familiar with the tool.)
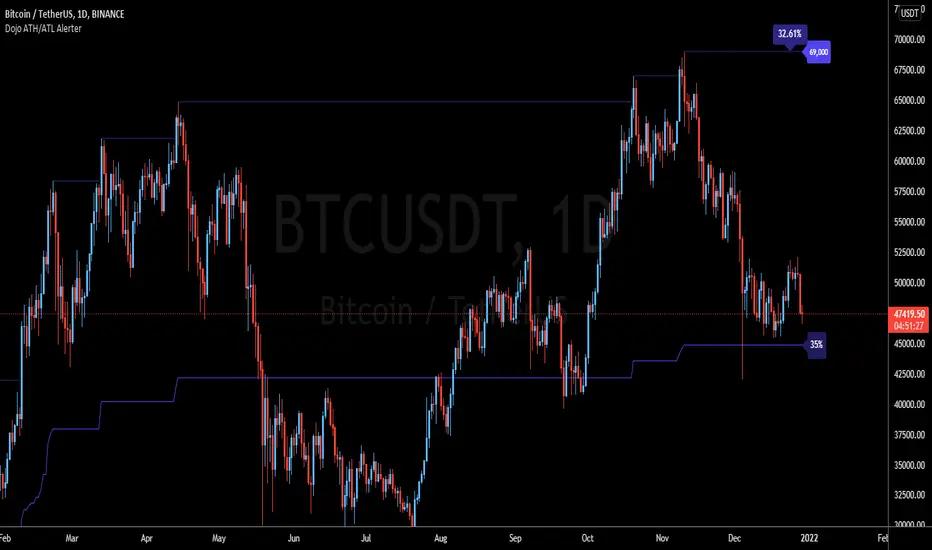
Trading-Dojo ATH/ATL AlerterTrading-Dojo High-Low indicator with alerts.
Allows you to set popup or email alerts when price breaches historic highs or lows
Or chose Embed method to have it publish directly to a webhook in Discord!
Simply place the indicator on a chart, right-click the indicator lines and add alert. Choose the type of alert you want and that's it.
* Note: the indicator excludes the current candle so if you hit ATH yesterday and you're on the weekly timeframe , it won't fire off an alert. For better resolution use Daily or lower if the asset you are alerting on is very volatile.