Aggregate PDH High Break Alert**Aggregate PDH High Break Alert**
**Overview**
The “Aggregate PDH High Break Alert” is a lightweight Pine Script v6 indicator designed to instantly notify you when today’s price breaks above any prior-day high in a user-defined lookback window. Instead of manually scanning dozens of daily highs, this script automatically loops through the last _N_ days (up to 100) and fires a single-bar alert the moment price eclipses a specific day’s high.
**Key Features**
- **Dynamic Lookback**: Choose any lookback period from 1 to 100 days via a single `High-Break Lookback` input.
- **Single Security Call**: Efficiently retrieves the entire daily-high series in one call to avoid TradingView’s 40-call security limit.
- **Automatic Looping**: Internally loops through each prior-day high, so there’s no need to manually code dozens of lines.
- **Custom Alerts**: Generates a clear, formatted alert message—e.g. “Crossed high from 7 day(s) ago”—for each breakout.
- **Lightweight & Maintainable**: Compact codebase (<15 lines) makes tweaking and debugging a breeze.
**Inputs**
- **High-Break Lookback (days)**: Number of past days to monitor for high breaks. Valid range: 1–100.
**How to Use**
1. **Add to Chart**: Open TradingView, click “Indicators,” then “Create,” and paste in the code.
2. **Configure Lookback**: In the script’s settings, set your desired lookback window (e.g., 20 for the past 20 days).
3. **Enable Alerts**: Right-click the indicator’s name on your chart, select “Add Alert on Aggregate PDH High Break Alert,” and choose “Once per bar close.”
4. **Receive Notifications**: Whenever price crosses above any of the specified prior-day highs, you’ll get an on-screen and/or mobile push alert with the exact number of days ago.
**Use Cases**
- **Trend Confirmation**: Confirm fresh bullish momentum when today’s high outpaces any of the last _N_ days.
- **Breakout Trading**: Automate entries off multi-day highs without manual chart scanning.
- **System Integration**: Integrate with alerts to trigger orders in third-party bots or webhook receivers.
**Disclaimer**
Breakouts alone do not guarantee sustained moves. Combine with your preferred risk management, volume filters, and other indicators for higher-probability setups. Use on markets and timeframes where daily breakout behavior aligns with your strategy.
Cerca negli script per "alert"

Delta Volume Histogram with Filters and AlertsОписание (Russian):
Индикатор "Delta Volume Histogram" определяет дельту объёма и отображает её в виде гистограммы. Он показывает разницу между объёмами покупок и продаж, с возможностью фильтрации значений и вызова алертов.
Функции:
Фильтр для отображения только значений выше заданного порога.
Режим отображения всех значений выше нуля.
Алерт при появлении дельты, превышающей установленный фильтр.
Description (English):
The "Delta Volume Histogram" indicator calculates volume delta and displays it as a histogram. It highlights the difference between buy and sell volumes, with options for filtering values and triggering alerts.
Features:
Filter to display only values above a specified threshold.
**Features (continued):**
- Mode to display both positive and negative delta values above the zero line for better visualization.
- Alert functionality that notifies you when the delta volume exceeds the specified filter value.
This indicator is ideal for traders who want to track buying and selling pressure in the market, helping to identify strong movements and potential reversals based on volume delta analysis.

Enhanced Trading Alerts# Enhanced Multi-Symbol EMA Trading System with Smart Alerts
## 📊 Overview
A powerful multi-symbol trading system that monitors up to 6 symbols simultaneously for high-probability trading setups using advanced EMA crossover strategies, enhanced with volume confirmation and RSI filters. Perfect for swing traders and position traders focusing on quality tech stocks.
## 🎯 Key Features
- **Multi-Symbol Monitoring**: Simultaneously tracks 6 different symbols
- **Advanced EMA Strategy**: Uses dual EMA system (320 & 820 periods) for trend confirmation
- **Volume Validation**: Confirms signals with volume surge analysis
- **RSI Filter**: Adds momentum confirmation to avoid false signals
- **Smart Risk Management**: Automatic stop-loss and take-profit calculations
- **Detailed Alerts**: Comprehensive alert messages with key price levels
## 📈 Trading Signals
### Buy Signals Generated When:
- Price crosses above the slow EMA (820)
- Fast EMA (320) confirms the trend
- RSI is in optimal range (not overbought)
- Volume surge confirms the movement
- Risk levels automatically calculated
### Sell Signals Generated When:
- Price crosses below the slow EMA (820)
- Fast EMA (320) confirms the downtrend
- RSI confirms momentum shift
- Volume surge validates the movement
## ⚙️ Customizable Parameters
- **EMA Lengths**: Adjust fast and slow EMA periods
- **Volume Threshold**: Set minimum volume surge multiplier
- **RSI Settings**: Customize overbought/oversold levels
- **Risk Management**: Adjustable stop-loss and take-profit percentages
- **Symbol Selection**: Choose any 6 symbols to monitor
## 🎨 Visual Elements
- Blue line: Fast EMA (320)
- Red line: Slow EMA (820)
- Purple line: RSI indicator
- Clear visual representation of trend changes
## 📱 Smart Alerts
Detailed alert messages include:
- Symbol name and signal type
- Current price level
- RSI value
- Stop-loss price
- Take-profit target
- Volume surge multiplier
## 💡 Best Practices
1. **Timeframe Selection**:
- Best suited for 1H, 4H, or Daily timeframes
- Can be adapted for swing or position trading
2. **Risk Management**:
- Use suggested stop-loss levels
- Follow take-profit targets
- Consider volume confirmation strength
3. **Multiple Chart Setup**:
- Create multiple instances for more symbols
- Group correlated assets together
- Use different alert sounds for different setups
## 🎓 Usage Tips
- Monitor strongest tech stocks for best results
- Combine with market sentiment analysis
- Use volume surge as quality filter
- Wait for all conditions to align before trading
- Consider overall market conditions
## ⚠️ Risk Warning
This indicator is for informational purposes only. Always conduct your own analysis and consider your risk tolerance before trading. Past performance does not guarantee future results.
## 📌 Version History
- v1.0: Initial release with multi-symbol support
- v1.1: Added volume surge confirmation
- v1.2: Enhanced alert system with risk levels
- v1.3: Added RSI filter and improved signal quality
## 🔄 Regular Updates
Subscribe to this script for regular updates and improvements. Feel free to suggest features in the comments section.
## 📗 Default Symbols
- TSLA (Tesla)
- NVDA (NVIDIA)
- AVGO (Broadcom)
- TSM (Taiwan Semiconductor)
- META (Meta Platforms)
- AMZN (Amazon)
You can customize these symbols to match your trading preferences.
Good luck trading! 🍀

Engulfing Candles Alert - Multi Symbol (Miu)This indicator plots triangle shapes on each engulfing candles (bullish or bearish) on current chart.
The main use for this indication is to set alerts on multiple symbols at once.
Please follow steps below to set your alarms:
1) Add indicator to the chart
2) Go to settings
3) Check symbols you want to receive alerts (choose up to 8 different symbols)
4) Check if you want only bullish or bearish alerts or both
5) Once all is set go back to the chart and click on 3 dots to set alert in this indicator, rename your alert and confirm
6) You can remove indicator after alert is set and it'll keep working as expected
What does this indicator do?
This indicator will generate alerts anytime a candle closes and reaches bullish or bearish engulfing condition for any of symbol set.
Alert messages example: "Bullish alert on {Symbol}"
This script requests open and close information for each symbol through request.security() built-in function.
Detailed indicator description:
If current bar open is less than or equal to the previous bar close AND current bar open is less than previous bar open AND current bar close is greater than previous bar open THEN True
bullishEngulfing = (openBarCurrent <= closeBarPrevious) and (openBarCurrent < openBarPrevious) and (closeBarCurrent > openBarPrevious)
The opposite condition will be bearishEngulfing
Feel free to give feedbacks on comments section below. Enhancement suggestions are welcome =).
Enjoy!

Digital Clock with Market Status and AlertsDigital Clock with Market Status and Alerts - 日本語解説は下記
Overview:
The Digital Clock with Market Status and Alerts indicator is designed to display the current time in various global time zones while also providing the status of major financial markets such as Tokyo, London, and New York. This indicator helps traders monitor the open and close times of different markets and alerts them when a market opens. Customizable options are provided for table positioning, background, text colors, and font size.
Key Features:
Real-Time Digital Clock: The indicator shows the current time in your selected time zone (Asia/Tokyo, America/New_York, Europe/London, Australia/Sydney). The time updates in real-time and includes hours, minutes, and seconds, providing a convenient and accurate way to monitor time across different trading sessions.
Global Market Status: Displays the open or closed status of major financial markets.
・Tokyo Market: Open from 9:00 AM to 3:00 PM (JST).
・London Market: Open from 16:00 to 24:00 during summer time and from 17:00 to 1:00 during winter time (JST).
・New York Market: Open from 21:00 to 5:00 during summer time and from 22:00 to 6:00 during winter time (JST).
Customizable Display:
・Background Color: The indicator allows you to set the background color for the clock display, while the leftmost empty cell can be independently customized with its own background color for table alignment.
・Clock and Market Status Colors: Separate color options are available for the clock text, market status during open, and market status during closed periods.
・Text Size: You can adjust the size of the text (small, normal, large) to fit your preferences.
・Table Position: You can position the digital clock and market status table in different locations on the chart: top left, top center, top right, bottom left, bottom center, and bottom right.
Alerts for Market Opening: The indicator will trigger alerts when a market (Tokyo, London, or New York) opens, notifying traders in real-time. This can help ensure that you don't miss any important market openings.
How to Use:
Setup:
Apply the Indicator: Add the Digital Clock with Market Status and Alerts indicator to your chart. Customize the time zone, text size, background colors, and table position based on your preferences.
Monitor Market Status: Watch the market status displayed for Tokyo, London, and New York to keep track of market openings and closings in real-time.
Receive Alerts: The indicator provides built-in alerts for market openings, helping you stay informed when a key market opens for trading.
Time Monitoring:
・Real-Time Clock: The current time is displayed with hours, minutes, and seconds for accurate tracking. The clock updates every second and reflects the selected time zone.
・Global Time Zones: Choose your desired time zone (Tokyo, New York, London, Sydney) to monitor the time most relevant to your trading strategy.
Market Status:
・Tokyo Market: The status will display "Tokyo OPEN" when the Tokyo market is active, and "Tokyo CLOSED" when it is outside of trading hours.
・London Market: Similarly, the indicator will show "London OPEN" or "London CLOSED" depending on whether the London market is currently active.
・New York Market: The New York market status follows the same structure, showing "NY OPEN" or "NY CLOSED."
Customization:
・Table Positioning: Easily move the table to the desired location on the chart to avoid overlap with other chart elements. The leftmost empty cell helps with alignment.
・Text and Background Color: Adjust the text and background colors to suit your personal preferences. You can also set independent colors for open and closed market statuses to easily distinguish between them.
Cautions and Disclaimer:
・Indicator Modifications: This indicator may be updated without prior notice, which could change or remove certain features.
・Trade Responsibility: This indicator is a tool to assist your trading, but responsibility for all trades remains with you. No guarantee of profit or success is implied, and losses can occur. Use it alongside your own analysis and strategy.
Digital Clock with Market Status and Alerts - 解説と使い方
概要:
Digital Clock with Market Status and Alerts インジケーターは、さまざまな世界のタイムゾーンで現在の時刻を表示し、東京、ロンドン、ニューヨークなどの主要な金融市場のステータスを提供します。このインジケーターにより、複数の市場のオープンおよびクローズ時間をリアルタイムで監視でき、市場がオープンする際にアラートを受け取ることができます。テーブルの位置、背景色、テキストカラー、フォントサイズなどのカスタマイズが可能です。
主な機能:
リアルタイムデジタル時計: 選択したタイムゾーン(東京、ニューヨーク、ロンドン、シドニー)の現在時刻を表示します。リアルタイムで更新され、時間、分、秒を正確に表示します。
世界の市場ステータス: 主要な金融市場のオープン/クローズ状況を表示します。
・東京市場: 午前9時~午後3時(日本時間)。
・ロンドン市場: 夏時間では16時~24時、冬時間では17時~1時(日本時間)。
・ニューヨーク市場: 夏時間では21時~5時、冬時間では22時~6時(日本時間)。
カスタマイズ可能な表示設定:
・背景色: 時計表示の背景色を設定できます。また、テーブルの左側に空白のセルを配置し、独立した背景色を設定することでテーブルの配置調整が可能です。
・時計と市場ステータスの色: 時計テキスト、オープン市場、クローズ市場の色を個別に設定できます。
・テキストサイズ: 小、標準、大から選択し、テキストサイズをカスタマイズ可能です。
・テーブル位置: デジタル時計と市場ステータスのテーブルをチャートのさまざまな場所(左上、中央上、右上、左下、中央下、右下)に配置できます。
市場オープン時のアラート: 市場(東京、ロンドン、ニューヨーク)がオープンするときにアラートを発し、リアルタイムで通知されます。これにより、重要な市場のオープン時間を逃さないようサポートします。
使い方:
セットアップ:
インジケーターを適用: チャートに「Digital Clock with Market Status and Alerts」インジケーターを追加し、タイムゾーン、テキストサイズ、背景色、テーブル位置を好みに応じてカスタマイズします。
市場ステータスを確認: 東京、ロンドン、ニューヨークの市場ステータスをリアルタイムで表示し、オープン/クローズ時間を把握できます。
アラートを受け取る: 市場オープン時のアラート機能により、重要な市場のオープンを見逃さないように通知が届きます。
時間管理:
・リアルタイム時計: 現在の時刻が秒単位で表示され、選択したタイムゾーンに基づいて正確に追跡できます。
・グローバルタイムゾーン: 東京、ニューヨーク、ロンドン、シドニーなど、トレードに関連するタイムゾーンを選択して監視できます。
市場ステータス:
・東京市場: 東京市場が開いていると「Tokyo OPEN」と表示され、閉じている場合は「Tokyo CLOSED」と表示されます。
・ロンドン市場: 同様に、「London OPEN」または「London CLOSED」が表示され、ロンドン市場のステータスを確認できます。
・ニューヨーク市場: ニューヨーク市場も「NY OPEN」または「NY CLOSED」で現在の状況が表示されます。
カスタマイズ:
・テーブル位置の調整: テーブルの位置を簡単に調整し、チャート上の他の要素と重ならないように配置できます。左側の空白セルで位置調整が可能です。
・テキストと背景色のカスタマイズ: テキストと背景の色を自分の好みに合わせて調整できます。また、オープン時とクローズ時の市場ステータスを区別するため、独立した色設定が可能です。
注意事項と免責事項:
・インジケーターの変更: このインジケーターは、予告なく変更や機能の削除が行われる場合があります。
・トレード責任: このインジケーターはトレードをサポートするツールであり、トレードに関する全責任はご自身にあります。利益を保証するものではなく、損失が発生する可能性があります。自分の分析や戦略と組み合わせて使用してください。

ORB - Alerts, VWAP and MACD Checks, Extended Fib Levels
ORB Range Alerter with Shading, VWAP Check, MACD Check, and Extended Fibonacci Levels for TP – Fully Customizable
This indicator is designed to give you a comprehensive analysis of the Opening Range Breakout (ORB) combined with advanced conditions based on VWAP and MACD indicators, along with Extended Fibonacci Levels for both long and short TP positions.
Key Features:
Opening Range Breakout (ORB):
Defines the opening range at the market open (9:30 AM by default) based on your chart timeframe and shades it for visibility.
The high and low of the first candle after the open are plotted on the chart, creating a breakout range that traders can use to identify potential long or short positions.
VWAP Condition (Optional):
This indicator includes the option to enforce the VWAP (Volume-Weighted Average Price) as a condition for entering trades.
- Longs will only trigger if the price is above VWAP (when enabled).
- Shorts will only trigger if the price is below VWAP (when enabled).
Customizable : You can enable or disable the VWAP condition through a simple checkbox in the indicator’s settings.
MACD Condition (Optional):
Includes an optional MACD (Moving Average Convergence Divergence) condition.
- Longs will only trigger if the MACD line is above 0 and the signal line, providing confirmation of bullish momentum.
- Shorts will only trigger if the MACD line is below 0 and the signal line, indicating bearish momentum.
Customizable : You can enable or disable the MACD condition through a checkbox in the indicator’s settings, allowing you to trade with or without the MACD confirmation.
Fibonacci Extensions for Profit Targets:
Automatically calculates Fibonacci extension levels based on the ORB range for TP levels.
These levels provide key areas for potential profit-taking or reversal points.
Fibonacci extensions are plotted only after a confirmed breakout, either long or short.
The extensions include 127.2%, 161.8%, 200%, 261.8%, 423.6%, and 685.4%, offering a comprehensive set of targets for different trading strategies.
Shading of ORB Range:
The ORB high and low are visually emphasized on the chart with a shaded area for easy identification.
The shading is semi-transparent to help keep your chart clean and easy to read.
Customizable Timeframe:
The ORB range is defined based on the time of day (default is 9:30 AM to 4:00 PM), but you can adjust the timeframe to suit different trading sessions or markets.
Alerts for Breakouts:
Built-in alerts notify you when price crosses above or below the ORB high or low, along with the optional VWAP and MACD conditions.
Alerts can be used to create automated notifications or even execute automated trades based on your chosen settings.
How to Use:
Long Trade Example: When the price crosses above the ORB high, VWAP is above the price, and MACD shows bullish momentum (if these conditions are enabled), a potential long entry is triggered. You can use the Fibonacci extensions for profit targets.
Short Trade Example: When the price crosses below the ORB low, VWAP is below the price, and MACD confirms bearish momentum (if these conditions are enabled), a short entry is triggered. Fibonacci levels for the short position can guide your exit strategy.
Flexibility: You can enable or disable both VWAP and MACD conditions based on your trading style. This flexibility allows the indicator to adapt to different market conditions and strategies.
Customization Options:
Enable/Disable VWAP Condition: Decide if you want to include VWAP as a trade filter.
Enable/Disable MACD Condition: Choose whether to require MACD as confirmation for trade entries.
Adjust ORB Timeframe: Customize the time range for defining the ORB based on the market you're trading.
Fibonacci Extensions: Visualize key profit targets using Fibonacci extensions, which are automatically calculated and displayed after a breakout.

Time Zone Box & Alerts (Simplified)### Description
This Pine Script indicator is designed for TradingView and provides functionality for drawing time-based boxes on the chart, as well as generating alerts and labels. It is particularly useful for visualizing specific time ranges within each trading day and managing alerts based on those time intervals.
#### **Features:**
1. **Box Drawing for Specific Time Ranges**:
- **Time Interval Customization**: Allows users to specify the start and end times for the box using inputs (e.g., from 9:30 AM to 12:30 PM). The box will automatically adjust based on these times.
- **Historical Data**: The script calculates the high and low prices within the specified time range and draws a box accordingly. This box will be created for each trading day, capturing all relevant historical data within the defined time interval.
2. **Dynamic Alerts**:
- **Custom Alerts**: Users can define custom alert messages for specific times within the trading day (e.g., before and after the trading range). Alerts are triggered once per bar close at the specified times.
3. **Labels for Key Time Points**:
- **Customizable Labels**: Labels can be added at specific times to indicate important trading actions (e.g., "No Trade," "Open Trade," and "Close Trade"). The text, color, and size of these labels are customizable.
- **Label Display**: Labels appear on the chart at defined times to provide visual cues for trading decisions.
4. **Visual Customization**:
- **Box and Label Colors**: Users can choose colors for the box and labels to match their preferences or trading setup.
- **Box Transparency**: The box can be customized with varying levels of transparency to enhance chart visibility.
#### **Usage:**
1. **Set Up Time Intervals**: Define the start and end times for the box using the input fields. Adjust these settings to fit your trading strategy and time zones.
2. **Adjust Alerts and Labels**: Customize the alert messages and label text to fit your trading plan.
3. **Apply to Chart**: Add the script to your TradingView chart to visualize the time-based boxes, receive alerts, and see the labels.
This script helps traders visually identify significant time ranges within the trading day and receive timely alerts and labels, enhancing their decision-making process.

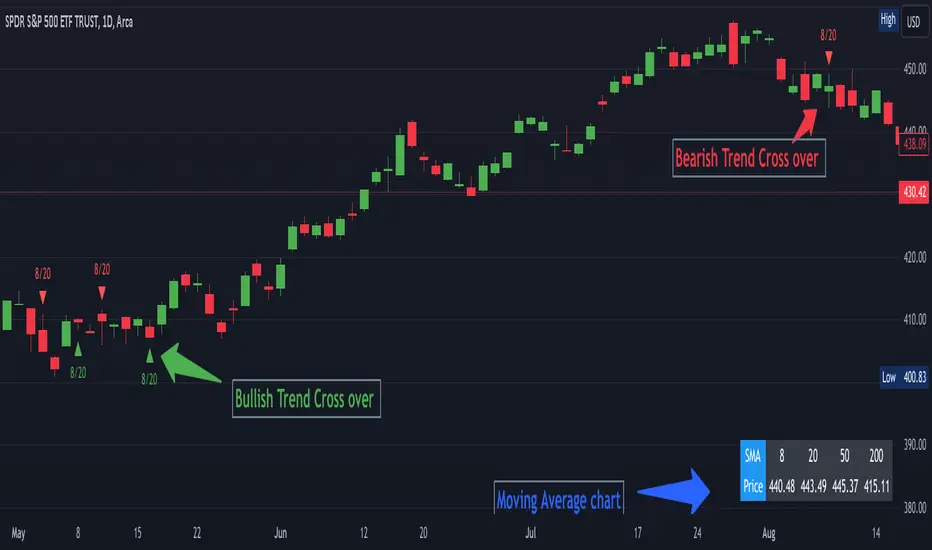
SMA Table with Alerts and Intersections🌟 **Presenting the Dynamic SMA Intersection Alert Indicator!** 🌟
### **Overview:**
The Dynamic SMA Intersection Alert Indicator is a sophisticated tool developed for traders seeking simplicity and effectiveness. It integrates multiple Simple Moving Averages (SMA) to deliver real-time alerts and visual cues, enabling traders to identify potential market entry points with ease.
### **Features:**
1. **Multi-SMA Visualization:**
- Incorporates four SMAs: 8, 20, 50, 200 periods.
- Displays a customizable table showing the current value of each SMA.
2. **Alerts in Real-Time:**
- Provides instant notifications for price crossings over any of the SMAs.
- Offers customizable alert messages.
3. **Visualization of Intersection Points:**
- Displays green triangles for bullish crosses and red for bearish, directly on the chart.
- Allows for the identification of precise intersection points between shorter-term and longer-term SMAs.
### **Benefits:**
- **Informed Decision-Making:** Enables quick discernment of market trends.
- **Efficiency:** Automates the tracking of SMA intersections.
- **User-Friendly:** Applicable for both novice and experienced traders.
### **How It Operates:**
- The indicator computes four different SMAs and presents their current values systematically.
- It triggers a real-time alert when the price crosses any SMA, instantly notifying the trader.
- Visual cues are plotted on the chart when any two SMAs intersect, indicating the type of cross.
### **Enhance Your Trading Experience!**
The Dynamic SMA Intersection Alert Indicator is designed to refine your trading experience and assist in making informed and timely trading decisions. Leverage this tool to stay abreast of market trends and enhance your market understanding!
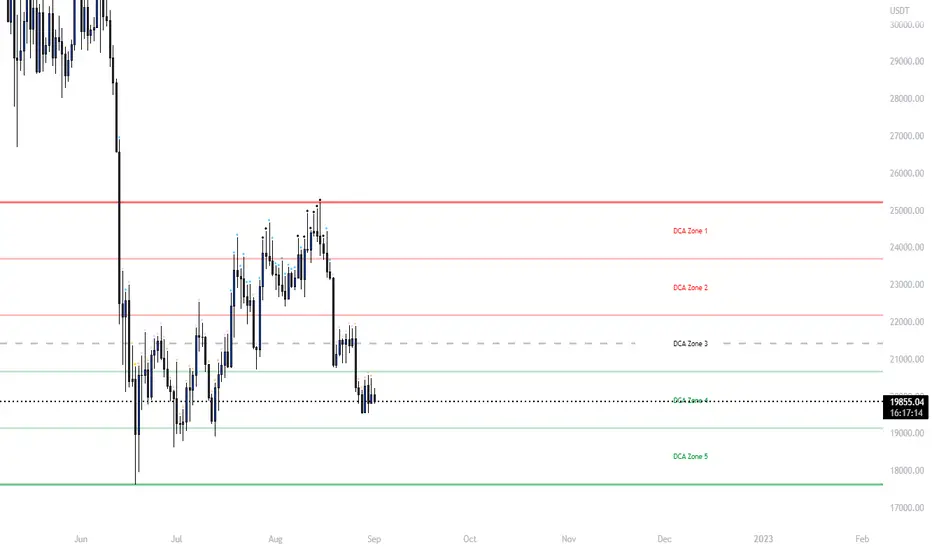
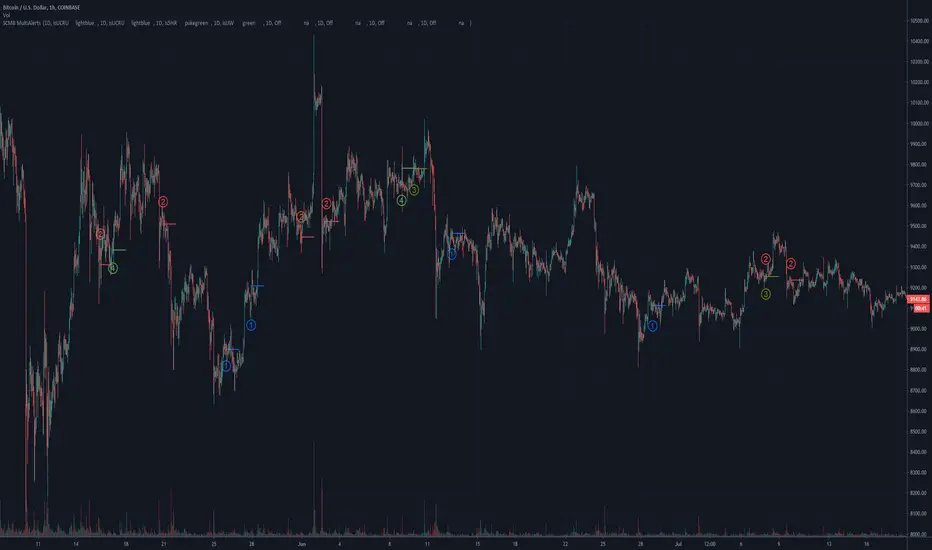
Ultimate Grid Tool + Alerts (DCA & Limit Orders) [enzedengineer]Overview
The "Ultimate Grid Tool + Alerts" script works much like a grid bot from automated trading services such as 3Commas making it a good free alternative with some extra utility.
How it works
The user is prompted to set up a grid by manually defining a lower and upper range and then by selecting how many grid segments they want (max 20). The script will automatically create equally spaced grids within this defined range. The script has built in alerts which are intended to be used in conjunction with a third-party application to execute buy and sell orders on an exchange.
The script has two alert functionalities to choose between:
Limit orders (like traditional grid bots) or;
DCA zones (time-based)
DCA zones:
This is the default selection. Each zone has its own alert condition which is triggered if the price closes within that zone. The frequency of the alert is determined by the user's chart resolution, therefore you can have the alert trigger every day, or 4 hours, or 30 minutes and so on. This allows for flexibility, for example, you could go from DCA'ing at $20 per day at higher prices to $100 per day as the price drops into the lower end of your grid range.
Limit orders:
This mode is selected by checking the "Limit Order" box. As mentioned earlier, this mode works like traditional grid bots with each grid line representing a limit order. The alert condition is met when ta.cross(close, gridline) = true.
Buy and Sell:
This mode is selected by checking the "Buy and Sell" box. This is a visual modification only which changes the colour of the grids to help plan the user's trading. Please note, there is no buying or selling logic within the script itself - this should be built into the alert message to be used with a third-party application for exchange order execution.
Use case: The author of this script has been using it with the default settings to DCA into Bitcoin in the current bear market. Using a chart resolution of 15 minutes the script purchases x-amount of Bitcoin every 15 minutes (Alertatron executes the exchange orders). This method provides a well blended average price and takes away the internal conundrum of "should I buy some today". No matter what, the bot will make a purchase within at least 15 minutes of the ultimate Bitcoin bottom and arguably this gives a psychological edge and reduces FOMO (fear of missing out).
Engulfing Candles AlertThis is a Engulfing Candle Indicator with Alerts.
This is not like any other Engulfing candle indicator present on TV. There are some special rules that are being used to identify specific engulfing candles.
Also, the user can choose if they like nice body engulfing or they want to ignore them.
The indicator have the following highlights:
1) Ability to choose the color of the engulfing candle body.
2) Ability to choose a different color for the Liq (liquidity) swap engulfing candle body.
Bullish Engulfing after Liq Swap
Bearish Engulfing after Liq Swap
3) With above 2 options, you can get the desired information without plotting any extra information on the chart.
4) You can put the alerts for getting notified when these patterns forms on the chart.
5) Ability to choose between getting notified or not on the chart if the engulfing candle body is less than 40% of the whole candle size. This is useful in order to identify if the engulfing is really powerful or not.
After selecting the option to ignore such engulfing
6) Ability to choose between getting notified or not on the chart if the engulfed candle body is really small. This is in particular useful for avoiding the engulfing of Doji which in turn might not be that powerful.
After selecting the option to ignore such engulfing
We will keep on making the improvements/Enhancements over the time (Check the changelog for such features)
NOTE: The indicator is of best use if you have a defined & back tested strategy which relies on this type of candlestick pattern.
Bullish Engulfing AlertThis is a Bullish Engulfing Candle Indicator with Alerts.
This is not like any other Bullish Engulfing candle indicator present on TV. There are some special rules that are being used to identify specific engulfing candles.
Also, the user can choose if they like nice body engulfing or they want to ignore them.
The indicator have the following highlights:
1) Ability to choose the color of the engulfing candle body.
2) Ability to choose a different color for the Liq (liquidity) swap engulfing candle body.
3) With above 2 options, you can get the desired information without plotting any extra information on the chart.
4) You can put the alerts for getting notified when these patterns forms on the chart.
5) Ability to choose between getting notified or not on the chart if the engulfing candle body is less than 40% of the whole candle size. This is useful in order to identify if the engulfing is really powerful or not.
6) Ability to choose between getting notified or not on the chart if the engulfed candle body is really small. This is in particular useful for avoiding the engulfing of Doji which in turn might not be that powerful.
We will keep on making the improvements/Enhancements over the time (Check the changelog for such features)
NOTE: The indicator is of best use if you have a defined & back tested strategy which relies on this type of candlestick pattern.

Bearish Engulfing AlertThis is a Bearish Engulfing Candle Indicator with Alerts.
This is not like any other Bearish Engulfing candle indicator present on TV. There are some special rules that are being used to identify specific engulfing candles.
Also, the user can choose if they like nice body engulfing or they want to ignore them.
The indicator have the following highlights:
1) Ability to choose the color of the engulfing candle body.
2) Ability to choose a different color for the Liq (liquidity) swap engulfing candle body.
3) With above 2 options, you can get the desired information without plotting any extra information on the chart.
4) You can put the alerts for getting notified when these patterns forms on the chart.
5) Ability to choose between getting notified or not on the chart if the engulfing candle body is less than 40% of the whole candle size. This is useful in order to identify if the engulfing is really powerful or not.
6) Ability to choose between getting notified or not on the chart if the engulfed candle body is really small. This is in particular useful for avoiding the engulfing of Doji which in turn might not be that powerful.
We will keep on making the improvements/Enhancements over the time (Check the changelog for such features)
NOTE: The indicator is of best use if you have a defined & back tested strategy which relies on this type of candlestick pattern.

Movable Stop + Trail + Alerthello everybody !
.....
this indicator helps you to get a better trading setting.
it's similar to the default draw tool from the trading view but the difference is you can add Trail stop and Alert .
.....
It also helps to free accounts to set more than 1 Alarm !!!
.....
Alert setting
just remember after you see set an alert if you change stop or entry, the alert will work with previous values/settings.
so you need to recreate an alert.
also don't change alert setting
.....
indicator setting
How is it works ?
...
settings
...
everything on :
you can see the information on the table
...
short sample :
everything on
...
simple short trade setting:
.....
my goal is to upgrade this indicator with your ideas.
not financial advice !
please , share your ideas with me to improve the indicator
I would like to see what you think about this indicator <3
also if you have any ideas to create an indicator or strategy you can make contact with me .
have a great day.

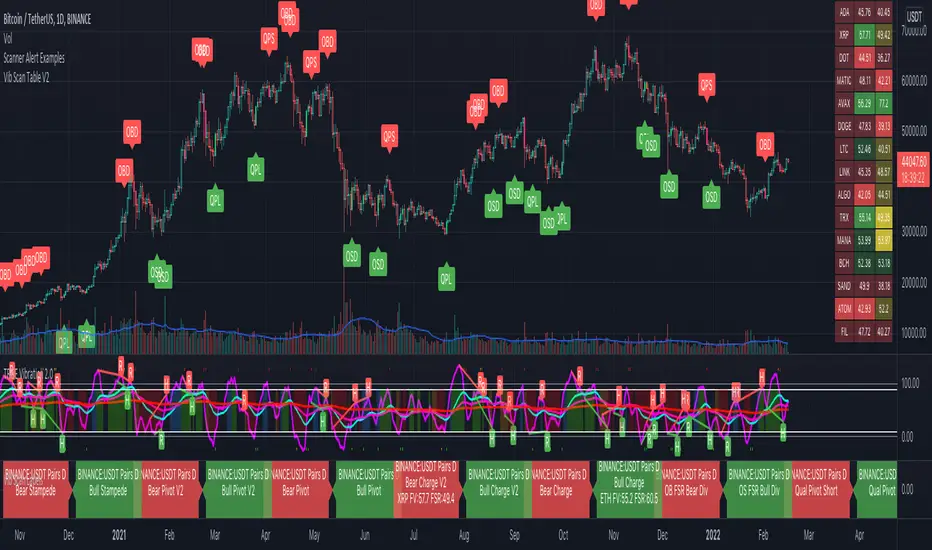
Scanner Alert ExamplesThis is a visual representation of the alerts built into the Vib Scanner Table (right side of main panel) and Vib Scanner Labels (bottom most panel) that are based on Mr. A's TrueVibration (other lower panel). Instead of a table or scanner labels, this indicator will print labels direction under/over candles identifying where the scanners will trigger alert, but this script only looks at a single asset. You can use this script to see how various settings play out across an asset's entire history and fine tune your scanner settings to your likings.
All of the alerts are coded the exact same way across all 3 of these:
Qualified pivots longs trigger with a "potential pivot long" occurs with a higher local low compared to the last time SmoothVib was under 30. Qualified shorts require the potential pivot short occur at a lower local high than the last time SmoothVib was over 70. As with the table, there is the option to choose to either require a Full Reset (SmoothVib goes all the way to the other extreme first) or just a partial reset (SmoothVib only comes out of OB/OS territory and back into it).
Overbought/Oversold FSR Divergences look for regular and hidden divergences in the FSR while it is in overbought or oversold territory.
Charge V1 Bull Alert is triggered when Full Vib is over the Full Vib Bull Threshold and FSR crosses over the Full Vib. Bear alert is Full Vib below Full Vib Bull Threshold and FSR crosses below Full Vib.
Charge V2 uses a "most recent DBI" filter and will trigger an alert any time the FSR crosses the Full Vibration and is in agreement with the most recent DBI .
Pivots V1 Bull Alert is triggered when Full Vib is over the Full Vib Bull Threshold and FSR pivots above the Full Vib. Bear Pivots are the opposite of this.
Pivots V2 look for similar FSR pivots , but with a Leading/Lagging Full Vib comparison. Bull Alerts require Leading Full to be above Lagging Full and the FSR to pivot on top of both. Bear pivots are the exact opposite.
Bull and Bear Stampede's look for FSR crossing over 120 or under -20, respectively, and indicate EXTREME momentum.
Please note: these alerts are my extensions of the TrueVibration indicator and concepts by TrueCrypto28, aka Mr. A. HUGE thank you to him for all his incredible work!
While these scanners can be used as standalone to some extent, an understanding of TrueVibration will take them to another level.
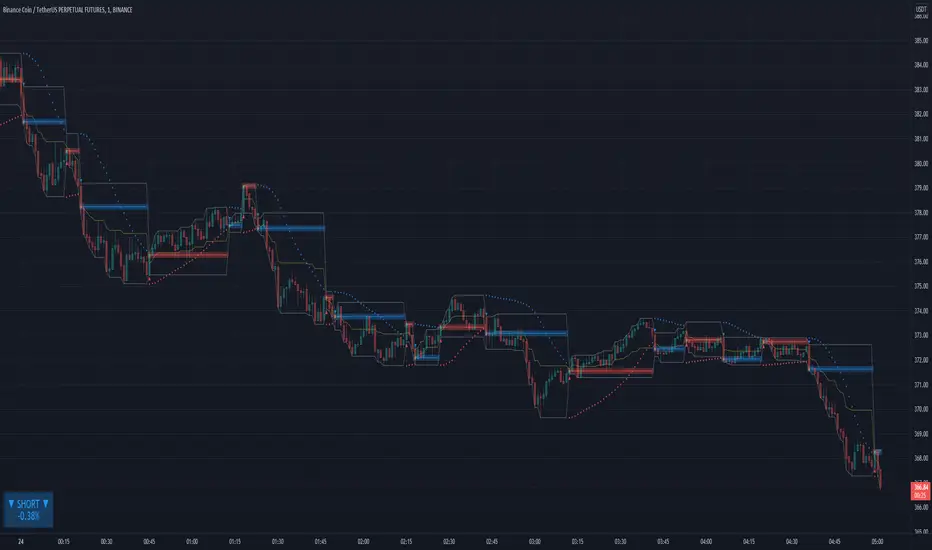
[DA]SAR HILODescription of the indicator:
The SAR indicator will indicate a trend change on the chart:
LONG: Red up arrow + GOLONG alert + red horizontal line
SHORT: Blue down arrow + GOSHORT alert + blue horizontal line
A HILO trend channel is also formed, which is reset when the trend changes.
The HILO channel will help you see the price movement in the channel.
Trend change alerts will only work at the close of the current bar.
For GOLONG/GOSHORT alerts to work, you need to select in the Tradingview menu:
Alerts => Indicator Name => Condition => Any call to the alert() function (Any alert() function call)
Price and trend direction in the table:
LONG + Red: The price is trending LONG
LONG + Yellow: The price is moving against the LONG trend
SHORT + Blue color: The price is moving along the SHORT trend
SHORT + Yellow: The price is moving against the SHORT trend
▲▼ Arrows: Rising/Falling bar
% Percentage taken from blue/red levels
I will be glad to receive your feedback on the indicator operation.
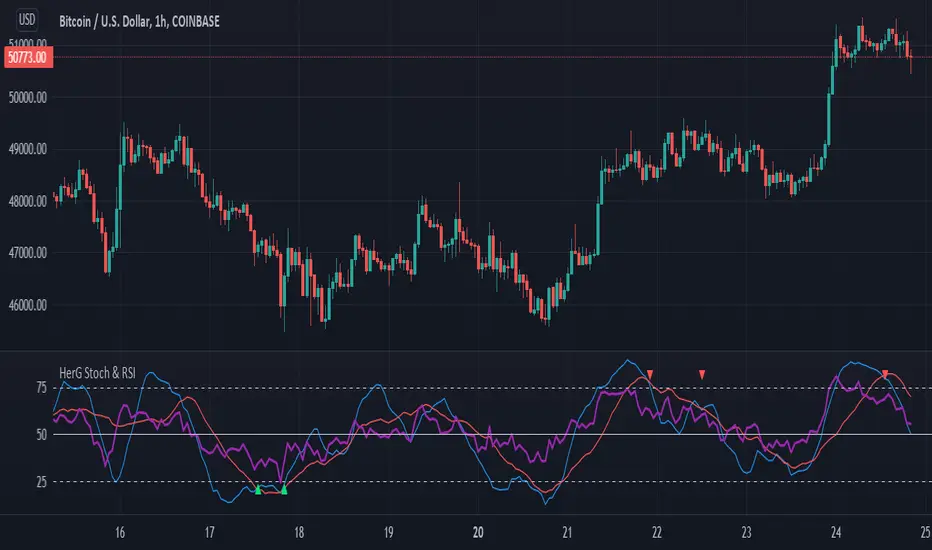
Stochastic and RSI in one indicator with customized alert.Hello Trading Viewers,
I present you Stochastic Oscillator and The Relative Strength Index Indicator inside one indicator, so that it will clear room to view charts.
When Stochastic is over-sold, the fast and slow stochastic underlap along with strong RSI (say above 45) will be a good indicator of buy at low with good risk-to-return of 2x or 3x; therefore I have set a triangle shape indicator within to help you identify or you can simply set an alert as I have coded an customized alert.
Same idea is used when Stochastic is over-bought you will receive an alert when fast & slow stochastic overlaps with RSI falling give a good sell set-up.
There is an option of selecting different timeframes which will further help make the correct decision. Say you are viewing a Daily chart but you want an indicator to present data of 4hrs timeframe, it can be done from the indicator cogwheel option. Default timeframe is "same as charts' ".
Above indicator is universal because settings such as RSI levels and no. of bars to calculate are user defined. You can use it on Crypto, Commodities, Stocks etc.
I suggest you first paper-trade with it and then use it on live account.
Happy trading.
CDC ActionZone Multi-TF,Mult-Ticker with alert() [P-O-Concept]This is proof-of-concept for using single screen displaying triggering signal of multiple stock/crypto
This source code is subject to the terms of the Mozilla Public License 2.0 at mozilla.org
1. Original CDC Action Zone v3 2020 by © piriya33
Source of original indicator :
2. Table concept/part of code is pulled from Portfolio Tracker
***************************************************************************
CDC Action Zone is based on a simple EMA crossover between EMA12 and EMA26
The zones are defined by the relative position of price in relation to the two EMA lines
Different zones can be use to activate / deactivate other trading strategies
The strategy can also be used on its own with acceptable result, buy on the first green candle
and sell on the first red candle
***************************************************************************
Hint Color Meaning :
Green = FastMA > SlowMA and Price is above FastMA
Blue = FastMA < SlowMA and Price is above both MA
LightBlue = FastMA < SlowMA and Price is between both MA
Red = FastMA < SlowMA and Price is below FastMA
Orange = FastMA > SlowMA and Price is below both MA
Yellow = FastMA > SlowMA and Price is between both MA
Blue/LightBlue/Orange/Yellow should be used with another indicator (such as divergent or so)
Cautions:
- This indicator is not meant to be used as "Signal" or "Trading System"
- This indicator provide a quick-glimpse to multiple ticker in same screen. You'll still have to see indications using original CDC Action Zone (If you're using with CDC System), or combining with another indicator (For shorter tf or scalping, or short/long cover)
- Up to 10 Tickers / Timeframe + Current ticker
Alert Creation Guideline
If this indicator will be used as alert. The timeframe for ticker should be set to "same as" the chart you're using, ie, to set alert on 4h, it should be created in 4h-timeframe (Alert is fired on bar close, using 1D-TABLE in 4H-CHART may trigger alert up to 6 times. else if using in 4H-TABLE in 1D-CHART the alert may not trigger at all)
Considering using ohlc4, hlc3, hl2 for market with no session
PS. Send me a message if you see any bug. (especially if using JSON, I have no chance to test with multiple alert at same tick.)

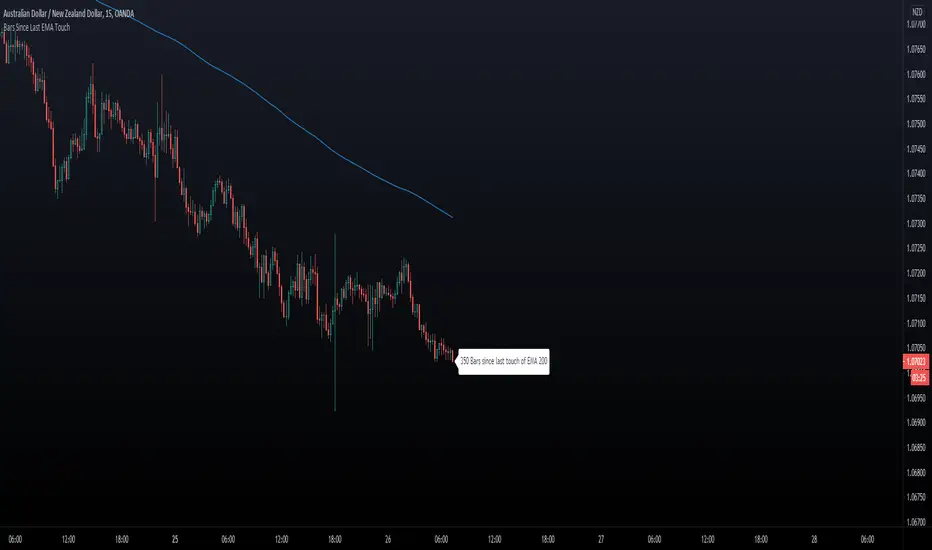
Bars Since Last EMA Touch
This indicator keeps track of how many bars since price touched any EMA last time. You can for example
set 200 EMA. Tell the script to send an alert if/when 400 bars has been reached away from the EMA 200.
- You can hide/show The EMA Line.
- You can hide/show bar Count.
- You can set X bars from EMA to get Alert.
- You can change color of The Badge and EMA line to fit your background colors.
Enjoy!
Another Indicator From The Hunter Trading Group
SCMB MultiAlerts - Candle Structure Alert ScriptSCMB Multialerts is a tool for candle structure alert automation.
The input screen allows you to input the timeframe, choose candle structure condition, toggle inverse condition, and toggle Heiken-Ashi for that candle structure trigger condition.
Input the timeframe with the # first and use H - Hour, D - Day, W - Week, and M - Month after the number; example - "1H" - "3D" - "4H" - "1W"
There are 8 total alert conditions that are programmable. You may use any combination of timeframes, inverse/HA, and candle-structure unique to each trigger available at the same time.
When you have set the conditions you want for alerts with the input settings, the color and the position of on-screen alerts is automatically populated.
You can then visually back-test to make sure these settings are desirable
Customize the colors individually, or choose to use "Color0" for all alert conditions by default by "user colors" toggle at the bottom of settings window, then you only need to change "Color0" for each alert condition.
Use the "Indicator Templates" to save your configuration, save several presets with settings for different situations, you can link the settings to a particular symbol as well.
Finally, use the "add alert" feature within tradingview to select the SCMB alert conditions as triggers. TV will deploy alerts with your customized message when each condition is met.
Some notes and known bugs:
Timeframe input requires capital letters for H,D,W,M.
Selecting "Close" Open" or "HL/2" from the drop down will do nothing at the moment. Future release plans to make use of these options.
If there is a feature you would like, question answered, or a bug to report, visit the TradingView SNOW_CITY public chat-room; link in my signature
Use the pastebin link below for indicator access information
MA-EMA Crossover AlertsThis is a script for getting alerts for the MA-EMA XO Strategy that I published recently.
This is probably the first version that I am putting out for this logic.
Based on feedback (and some coding suggestions and support if anyone is willing), I will try to improve this further.
So, what do we have in this script -
I have created 5 alert conditions. The 4 alerts are straight-forward : Entry / Exit alerts for Long / Short.
The fifth alert is just a single Alert which is triggered if any of the 4 alert conditions are met. Then user can check the chart to see what trade is triggered.
I am not explaining the logic of the indicator here since it is kind-of covered in the strategy.

[SignalFI] Simple MA X [3 Stage]Welcome!
This strategy recently came up as a way to stage entries when using simple moving averages for trading on high time-frames.
The goal of this script is to provide early warning for Simple Moving Average (SMA) crosses.
Three events are taken in account:
1) Close crossing above or below the "Fast" SMA
2) Close crossing above or below the "Slow" SMA
3) "Fast" SMA crossing above or below the "Slow" SMA
In this way, you will receive early warning of the main SMA crosses as price rises above or falls below each of the SMAs defined.
The script is fully alertable on each of the defined crosses:
1) Early Bull/Bear = Close crossing above or below the "Fast" SMA
2) Mild Bull/Bear = Close crossing above or below the "Slow" SMA
3) Bull/Bear MA = "Fast" SMA crossing above or below the "Slow" SMA
The idea is that you can split your order entry/exit conditions into stages, during bull markets taking a (example) 33% position when the Early Bull alert fires, 33% at Mild Bull, and the last 33% at Bull MA alerts. Reversing the process when exiting in order to reduce the lagging nature of the standard SMA cross strategy.

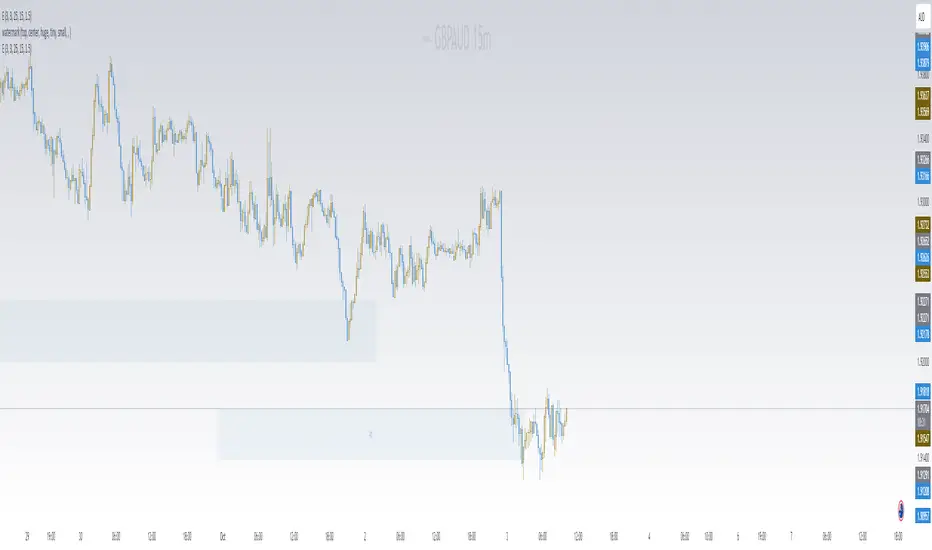
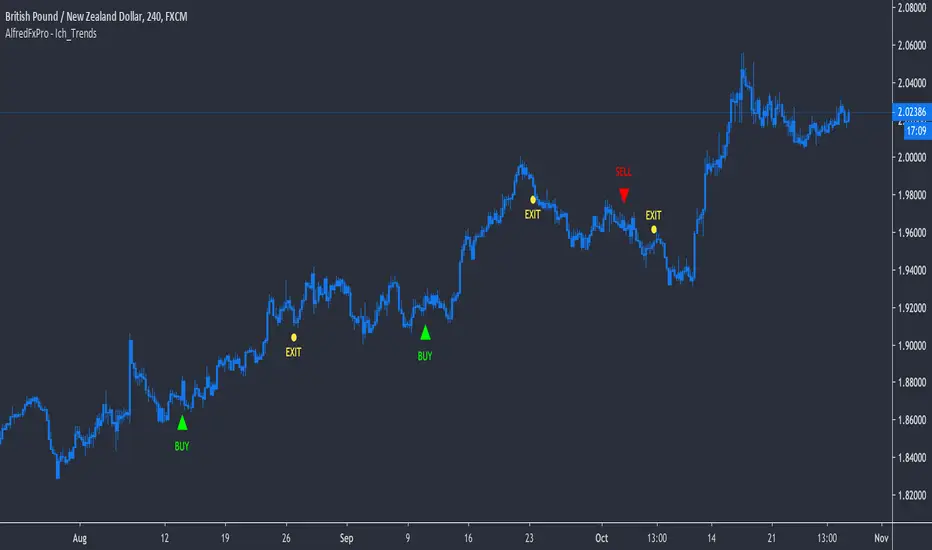
AlfredFxPro - Ichimoku_Trends_AlertsOur powerful Ichimoku Trend Following Scalping Indicator now with LIVE Alerts ( Buy, Sell, Exit Buy, Exit Sell) straight to your PC + Mobile.
*** NO REPAINT *** What you see is what you get. It will fire a signal as soon as the bar close
The (AlfredFxPro - Ich_Trends) uses one element of the famous Ichimoku and combine the signal with two custom volatility indicators to predict potential trends and determine the strength of the trend to keep you in as long as the trend is running or get you out as soon as possible with min loss.
Combine the signal with price action breakout patterns and you have a solid indicator.
It's a very powerful tool to add to your analysis, and make it your own.
**Try on Demo First**
Works best on high volatility instruments
Works on All Assets ( Forex, Crypto, Commodities , Gold , Stocks)
Suggested Timeframes (15min, 30min, 1Hr, 4Hr, D)
*************************
Send us a message for Access!
THIS INDICATOR IS PRIVATE & AVAILABLE FOR MEMBERS ONLY!
**************************
How to Set Alerts :
**Example Buy Signal Alert
-> Go to GBP/NZD 4Hr Timeframe
-> Click Add new Alert
-> Condition -> Select : AlfredFxPro - Ich_Trends
-> Select : Buy Alert
-> Option : Once Per Bar Close
-> Notify on App + POP Up
-> Message: Write: ""Buy 4Hr""
-------------------------------------------
**Example Exit Buy Signal Alert
-> Go to GBP/NZD 4Hr Timeframe
-> Click Add new Alert
-> Condition -> Select : AlfredFxPro - Ich_Trends
-> Select : Long Exit Alert
-> Option : Once Per Bar Close
-> Notify on App + POP Up
-> Message: Write : ""Exit Buy 4Hr""
-------------------------------------------
You repeat the same process for "Sell, and Exit Sell" for any pair on any timeframe you want.
-------------------------------------------
**********Important***********
1) Enter on a Buy and Exit from the same time frame don't mix signals from time frames ( Treat each time frame as an individual trade).
2) Important to set the Alert option: ""Once Per Bar Close"", otherwise you'll get wrong signals.
*************************
Send us a message for Access!
THIS INDICATOR IS PRIVATE & AVAILABLE FOR MEMBERS ONLY!
**************************
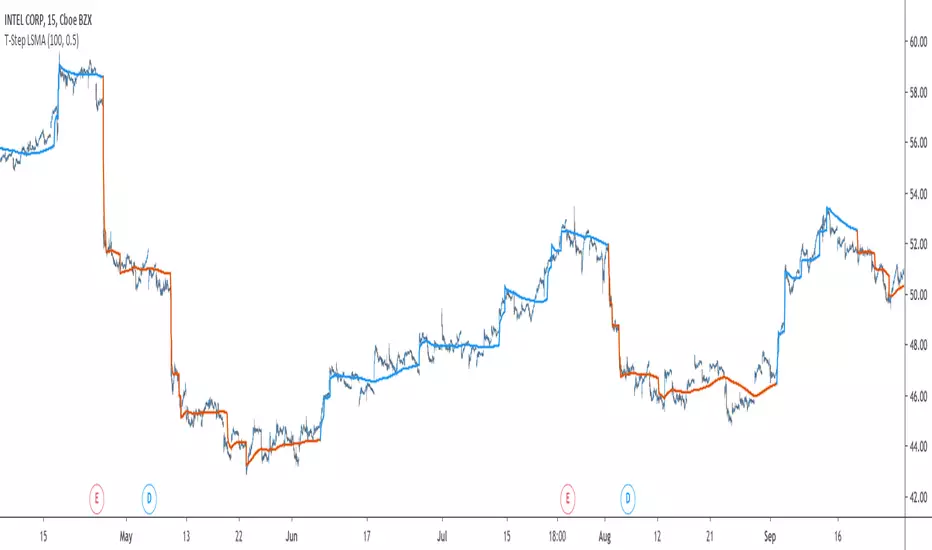
T-Step LSMAIntroduction
The trend step indicator family has produced much interest in the community, those indicators showed in certain cases robustness and reactivity. Their ease of use/interpretation is also a major advantage. Although those indicators have a relatively good fit with the input price, they can still be improved by introducing least-squares fitting on their calculations. This is why i propose a new indicator (T-Step LSMA) which aim to gather all the components of the trend-step indicator family (including the auto-line family).
The indicator will use as a threshold the mean absolute error between the input and the output (T-Channel) scaled with the efficiency ratio (Efficient Trend Step) while using least squares in order to provide a better fit with the price (Auto-Filter).
The Indicator
The interpretation of the indicator is easy, the indicator estimate an up-trending market when in blue, down-trending when in orange, the signal only depend on the trend-step part ( b in the code).
length control the period of the efficiency ratio as well as any components in the lsma calculation. The efficiency ratio allow to provide adaptivity, therefore the threshold will be lower when market is trending and higher when market is ranging.
Sc control the amount of feedback of the indicator, a value of 1 will use only the closing price as input, a value of 0.5 will use 50% of the closing price/indicator output as input, this allow to get smoother results.
It is possible to get the non-smooth version of the indicator by checking "No Smoothing".
This allow the indicator to filter more information.
Least Squares Smoothing - Benefits
One could ask why introducing least squares smoothing, there are several reasons to this choice, we have seen that trend-step indicators are boxy, they filter most of the variational information in the price, introducing least squares smoothing allow to gain back some of this variational information while providing a better fit with the price, the indicator is more noisy but also more practical in certain situations.
For example the indicator in its boxy form can't really be useful as input for other indicators, which is not the case with this version.
Relative strength index of period 14 using the proposed indicator as input.
Down-Sides
The indicator is dependent on the time frame used, larger time frames resulting in an indicator overfitting, sticking with lower time frames might be ideal. The indicator behavior might also change depending on the market in which it is applied.
Setting Up Alerts For The Indicator
Alerts conditions are already set, in order to create an alert based on the indicator follow these steps :
Go to the alert section (the alarm clock) -> create new alert -> select T-Step LSMA in condition -> Below select Up or Dn (Up for a up-trending alert and Dn for a down-trending alert)
In option select "once per bar close", change the message if you want a personalized message.
Conclusion
I don't think i'll post other indicators related to the trend-step framework for the time to comes, nonetheless the ones posted proven to have interesting results as well as many upsides. Although i don't think they would generate positive long-terms returns they could still be of use when using smarter volatility metrics as threshold. The proposed indicator conserve more information than its relatives and might find some use as input for other indicators.
Recommended Use Of The Code
Although i don't put restrictions on the code usage, i still recommend creative and pertinent changes to be made, graphical changes or any minor changes are not necessary, remember that such practice is disrespectful toward the author, you don't want to load up the tradingview servers for nothing right ?
Support Me
Making indicators sure is hard, it takes time and it can be quite lonely to, so i would love talking with you guys while making them :) There isn't better support than the one provided by your friends so drop me a message.