RePaNoCHa [Alerts]Script for automatic trading with Alerts (Use Backtest to customize your own settings)
All timeframes but good results on 2H.
LG --> Long
ST --> Short
TS --> Trailing Stop
xL --> Close Long Position
xS --> Close Short Position
SL --> Stop Loss
The trailing stop closes the trade if the price changes direction by a specified percentage or offset. There is no ideal distance because markets and price are always changing and we know that is impossible to exit on the top or bottom. This script interpolate the trailing Stop Offset with profit, higher profit -- > higher Trailing Stop Offset. Despite this, it's difficult to catch the price. If someone comes up with a good idea, comment, I'm happy to learn.
No security() function so no repaint but has time() and can appear a warning for it.
Alerts:
'Once per bar' More profit but not confirmed alerts (10-20% fake alerts)... I like risk
'Once per bar close' Confirmed alerts (0% fake alerts)... You will sleep better
Some settings:
XBTUSD (BITMEX)
Timeframe = 2H
Position Side = BOTH
Source = hlc3
T3 Length = 5
T3 Volume Factor = 0.9
Sampling Period = 16
Range Multiplier = 1.3
ADX lenght = 10
ADX Threshold = 20
SAR start = 0.07
SAR inc = 0.02
SAR max = 0.15
Pyramiding = 10
Trailing Stop Activation % = 0.5
Trailing Stop Offset % (when profit=0.5 %) = 0.35
Trailing Stop Offset % (when profit=10 %) = 1.5
Stop Loss = 3.5
Tics/Pips Correction = 10
Initial Capital = 1000
Quantity = 100 %
Commission value = 0.075 %
ETHUSD (BITMEX)
Timeframe = 2H
Position Side = BOTH
Source = hlc3
T3 Length = 5
T3 Volume Factor = 0.7
Sampling Period = 13
Range Multiplier = 0.9
ADX lenght = 11
ADX Threshold = 19
SAR start = 0.06
SAR inc = 0.03
SAR max = 0.15
Pyramiding = 10
Trailing Stop Activation % = 0.5
Trailing Stop Offset % (when profit=0.5 %) = 0.35
Trailing Stop Offset % (when profit=10 %) = 1.5
Stop Loss = 4
Tics/Pips Correction = 100
Initial Capital = 1000
Quantity = 100 %
Commission value = 0.075 %
BNBUSDT (BINANCE)
Timeframe = 2H
Position Side = LONG
Source = hlc3
T3 Length = 3
T3 Volume Factor = 1.6
Sampling Period = 17
Range Multiplier = 1.3
ADX lenght = 5
ADX Threshold = 18
SAR start = 0.04
SAR inc = 0.03
SAR max = 0.25
Pyramiding = 10
Trailing Stop Activation % = 0.5
Trailing Stop Offset % (when profit=0.5 %) = 0.4
Trailing Stop Offset % (when profit=10 %) = 1.5
Stop Loss == false
Tics/Pips Correction = 10000
Initial Capital = 1000
Quantity = 100 %
Commission value = 0.075 %
LTCUSDT (BINANCE)
Timeframe = 2H
Position Side = LONG
Source = hlc3
T3 Length = 3
T3 Volume Factor = 1.6
Sampling Period = 11
Range Multiplier = 1.1
ADX lenght = 6
ADX Threshold = 22
SAR start = 0.07
SAR inc = 0.04
SAR max = 0.15
Pyramiding = 10
Trailing Stop Activation % = 0.5
Trailing Stop Offset % (when profit=0.5 %) = 0.4
Trailing Stop Offset % (when profit=10 %) = 1.5
Stop Loss == false
Tics/Pips Correction = 100
Initial Capital = 1000
Quantity = 100 %
Commission value = 0.075 %
TRXUSDT (BINANCE)
Timeframe = 2H
Position Side = LONG
Source = hlc3
T3 Length = 3
T3 Volume Factor = 0.9
Sampling Period = 8
Range Multiplier = 1.2
ADX lenght = 4
ADX Threshold = 22
SAR start = 0.07
SAR inc = 0.04
SAR max = 0.15
Pyramiding = 10
Trailing Stop Activation % = 0.5
Trailing Stop Offset % (when profit=0.5 %) = 0.4
Trailing Stop Offset % (when profit=10 %) = 1.5
Stop Loss == false
Tics/Pips Correction = 100000
Initial Capital = 1000
Quantity = 100 %
Commission value = 0.075 %
NAS100 (OANDA)
Timeframe = 2H
Position Side = BOTH
Source = hlc3
T3 Length = 3
T3 Volume Factor = 1
Sampling Period = 12
Range Multiplier = 1.3
ADX lenght = 18
ADX Threshold = 21
SAR start = 0.08
SAR inc = 0.06
SAR max = 0.25
Pyramiding = 10
Trailing Stop Activation % = 0.2
Trailing Stop Offset % (when profit=0.5 %) = 0.15
Trailing Stop Offset % (when profit=10 %) = 1
Stop Loss = 1.8
Tics/Pips Correction = 10
Initial Capital = 1000
Quantity = 3 contracts
Commission value = 0.2 USD per contract
NATGAS(OANDA)
Timeframe = 2H
Position Side = BOTH
Source = hlc3
T3 Length = 3
T3 Volume Factor = 1
Sampling Period = 18
Range Multiplier = 1.1
ADX lenght = 10
ADX Threshold = 17
SAR start = 0.1
SAR inc = 0.04
SAR max = 0.35
Pyramiding = 10
Trailing Stop Activation % = 0.2
Trailing Stop Offset % (when profit=0.5 %) = 0.15
Trailing Stop Offset % (when profit=10 %) = 1
Stop Loss = 1.6
Tics/Pips Correction = 1000
Initial Capital = 1000
Quantity = 4500 contracts
Commission value = 0.002 USD per contract
SPX500 (OANDA)
Timeframe = 2H
Position Side = BOTH
Source = hlc3
T3 Length = 3
T3 Volume Factor = 0.6
Sampling Period = 14
Range Multiplier = 1.3
ADX lenght = 12
ADX Threshold = 17
SAR start = 0.23
SAR inc = 0.05
SAR max = 0.2
Pyramiding = 10
Trailing Stop Activation % = 0.15
Trailing Stop Offset % (when profit=0.5 %) = 0.1
Trailing Stop Offset % (when profit=10 %) = 0.75
Stop Loss = 1.5
Tics/Pips Correction = 10
Initial Capital = 1000
Quantity = 8 contracts
Commission value = 0.2 USD per contract
US30 (OANDA)
Timeframe = 2H
Position Side = BOTH
Source = hlc3
T3 Length = 4
T3 Volume Factor = 0.9
Sampling Period = 11
Range Multiplier = 1.1
ADX lenght = 16
ADX Threshold = 24
SAR start = 0.08
SAR inc = 0.03
SAR max = 0.05
Pyramiding = 10
Trailing Stop Activation % = 0.15
Trailing Stop Offset % (when profit=0.5 %) = 0.1
Trailing Stop Offset % (when profit=10 %) = 0.75
Stop Loss = 1.5
Tics/Pips Correction = 10
Initial Capital = 1000
Quantity = 1 contracts
Commission value = 1.5 USD per contract
WHEAT (OANDA)
Timeframe = 2H
Position Side = BOTH
Source = hlc3
T3 Length = 3
T3 Volume Factor = 1.1
Sampling Period = 12
Range Multiplier = 1
ADX lenght = 13
ADX Threshold = 21
SAR start = 0.07
SAR inc = 0.05
SAR max = 0.15
Pyramiding = 10
Trailing Stop Activation % = 0.2
Trailing Stop Offset % (when profit=0.5 %) = 0.15
Trailing Stop Offset % (when profit=10 %) = 1
Stop Loss = 2.5
Tics/Pips Correction = 1000
Initial Capital = 1000
Quantity = 2500 contracts
Commission value = 0.003 USD per contract
Cerca negli script per "alert"

Magic 4.0 Alerts//HOW TO SET ALERTS
// 1 - Apply script to chart
// 2 - Click Alerts icon at the top toolbar
// 3 - Under "Condition", choose "Magic v2.1 Alerts" in the 1st dropdown menu
// 4 - In the 2nd dropdown menu under "Conditions", choose "Crossing Up"
// 5 - To the right of the "Value" dropdown menu, choose a value of "1"
// 6 - set remaining parameters below to your choosing (Options, Exp . time, Alert actions, Message)
// 7 - Click "Create" and the alert is set

Chaikin MF% (CMFP) w. Alerts, Bells & Whistles [LucF]This is Chaikin’s Money Flow indicator on a 0-100 scale with buy/sell signals, alerts and other bells & whistles.
It includes:
- a fast EMA (16 periods by default),
- a slow MA (64 periods by default),
- histograms,
- 3 different sorts of crosses,
- big swings identification,
- buy/sell signals on CMFP crossing back from outside user-defined levels,
- buy/sell signals on the slow MA pivots above/below user-defined levels,
- alerts on big swings and buy/sells.
This indicator started with @LazyBear code (VAPI) at:
@cI8DH then changed the scale to 0-100, which I find very useful:
I then added the rest.
The chart above shows both clean and busy versions of the indicator.
Note that the default length is 10 rather than the commonly used 20. I use CMFP in conjunction with VFI and like the fact that it is faster than VFI. The default inputs show the way I normally use this indicator, with the slow MA shown in histogram mode. I find it gives good context to the signal line. Crosses between the two are often useful.
The buy/sell signals aren’t the main attraction of this indicator, and nothing to write home about. Like the big swing markers, I think it’s more realistic to view them as pointers to potentially interesting areas on charts. Their nature makes them more suited to identifying reversals. They certainly aren’t reliable enough to turn this study into a strategy and I normally don’t use them. The levels pre-defined for the buy/sell signals on CMFP are most useful on short intervals. The buy/sell signals on the slow MA pivots work on a more complete range of intervals. Optimization for your specific instruments and intervals will improve their reliability.
As usual when defining alerts, be sure you already have defined proper inputs and that you are on the intended interval, as they will be used when triggering alerts.

MAC DADDY GNOME PROHello Fellow Traders!
-------------------------------------------
This is the newest addition to Gnome Alerts PRO!
This is one of the newer scripts that we are using for scalping on the lower time frames on Bitmex & Binance.
This is a script that can be used on all time frames and includes back-testing. All of our scripts included back-testing and BUY & SELL alerts.
This Script allows you to fire Long, Short, or Flip with Both
Also Includes TTM Squeeze Bubbles for Manual trading.
INCLUDES:
------------------------
*Autoview Ready*
BUY ALERTS
- supports pyramiding
- sell based of %gain
SELL ALERTS
- supports pyramiding
- sell based of %gain
- stop loss configured
- sell on gain configured
Backtesting is also available!
More info on how gain access in my profile!

MACs EasyMoney - BOT Trade with AlertSytemsNew Version: MACs EasyMoney - BOT Trade with AlertSytems
Introducing the BOT version with proper alerts systems to enter and exit trades.
Also furnished with latest noise filtering architecture to this tool.
Strategy Test report for this tool - holds the Profit Factor of 134 - based on '1 contract' size with '0.25% commission' rate as well.
(Means it is very solid and healthy Profit Factor . happy to say that, you wont get any like this in today's Market)
Refer the Strategy Publication for details.
Thanks,
Mac.

Ichimoku with Alerts (Flexible Conditions)This is the standard Ichimoku indicator with very flexible BUY and SELL conditions.
Inputs
Standard Ichimoku Inputs:
Conversion Line Periods
Base Line Periods
Lagging Span 2 Periods
Displacement
BUY Options
Crossover happens Above the Cloud : Buy when conversion line crosses over baseline above the ichimoku cloud.
Crossover happens Inside the Cloud : Buy when conversion line crosses over baseline inside the ichimoku cloud.
Crossover happens Below the Cloud : Buy when conversion line crosses over baseline below the ichimoku cloud.
Buy when price crosses over Conversion Line : Buy when price crosses over conversion line (could happen below, inside or above the cloud).
Buy when price crosses over Base Line : Buy when price crosses over base line (could happen below, inside or above the cloud).
Buy when price crosses over min of CL and BL : Buy when price crosses over min of conversion and base line pair (could happen below, inside or above the cloud).
Buy when price crosses over max of CL and BL : Buy when price crosses over max of conversion and base line pair (could happen below, inside or above the cloud).
Consecutive ups : Number of bars for the selected buy condition to stay valid in order to trigger a BUY signal/alert.
SELL Options
Note: Each of the following conditions could happen below, inside or above the cloud.
Sell with Crossunder : Sell when converison line crosses under base line.
Sell when price crosses under Conversion Line : Sell when price crosses under conversion line.
Sell when price crosses under Base Line : Sell when price crosses under base line.
Sell when price crosses under min of CL and BL : Sell when price crosses under min of conversion and base line pair.
Sell when price crosses under max of CL and BL : Sell when price crosses under max of conversion and base line pair.
Consecutive downs : Number of bars for the selected sell condition to stay valid in order to trigger a SELL signal/alert.
This indicator has pretty much every possible scenarios to use the Ichimoku indicator effectively. I have also added consecutive ups/downs input, so you can avoid false signals and trade safely.
You can combine different options together. In that case, Buy or Sell signals will be triggered if at least one of the condtions is true.
Please report the bugs you found with a screenshot of the chart. Please make sure that the time stamp is visible, and also include the inputs you selected so I can reproduce the problem and fix it.
Please provide some feedback so we can improve this indicator together.
If you have any questions, please feel free to ask.
The strategy of this indicator is available here:

MG - Fibonacci Alerts - 1.2Updated version of:
The main change with this version, is that the indicator is now always overlayed and the user has to specify where they want the alerts to be displayed on the chart. (New 'Alert Base' and 'Alert Amplitude' properties define where this is shown in the chart and how large the alert spikes are). It also now includes optional bull and sell markers
This update therefore allows us to:
- Show the Fibonacci Levels being used by the indicator
- Plot buy and sell signals at the correct points on the price chart
- Trigger alerts when price reaches a Fibonacci level (without displaying this on the chart, the indicator can't be overlayed on the main chart)
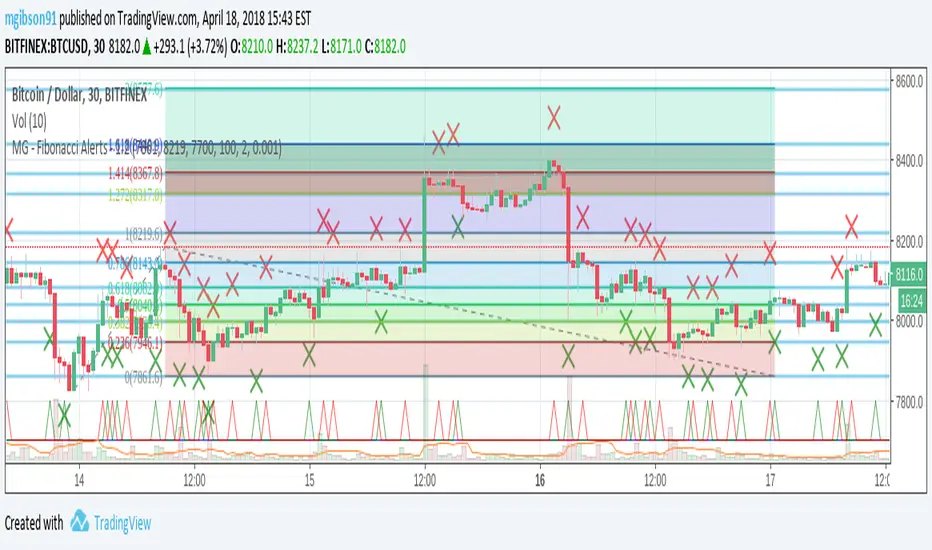
MG - Fibonacci Level AlertsThis script allows a user to get alerts when the price goes within a certain percentage threshold of a Fibonacci level.
If connected with AutoView, it could allow an easy way to do automated range trading between Fibonacci levels. Although I plan to do this myself, I haven't used it for this purpose yet so please be cautious and verify with live results beforehand before using it for any automation.
NOTE: The image shown of the indicator is not fully correct as the close price is used. In many cases in the example image, the candle close price DID come within the alert threshold but closed outside the threshold
Usage:
1. User performs a Fibonacci retracement / extension analysis to identify a sensible high and low point. (Currently, this script is geared towards dip pullbacks during a bull market with the ability to toggle rise pullbacks in a bear market in the pipeline)
2. User enters the high and low points into this indicator
3. User can then set alerts on the buy and sell signals which should provide alerts at excellent entry / exit points.
4. Set the alerts to once per bar (not per close). In this indicator, we want to catch things as soon as they happen.
NOTE: Should use in conjunction with another indicator for maximum results.
I personally use this indicator ()
TODO
- Add negative alert levels
- Allow user to specify direction of Fib retracement as the levels are different in bull and bear markets
All feedback is welcome

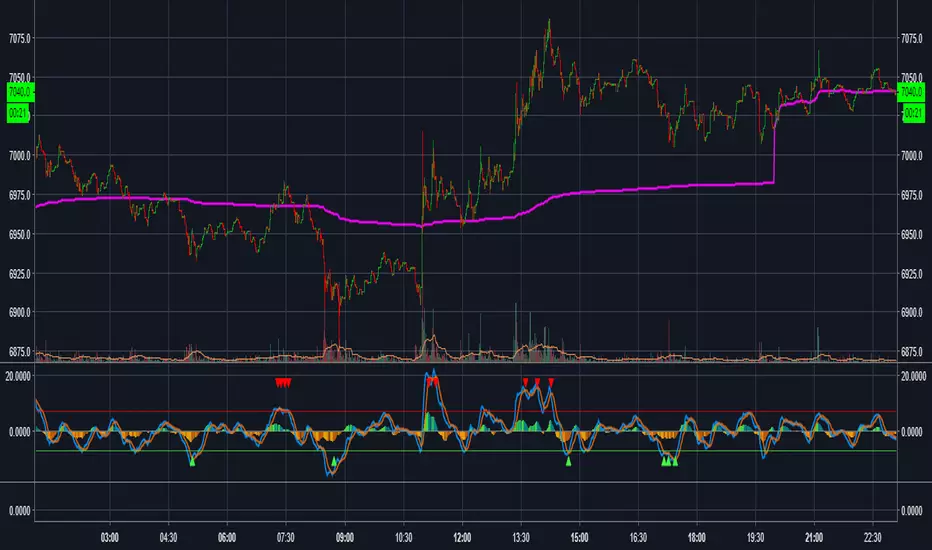
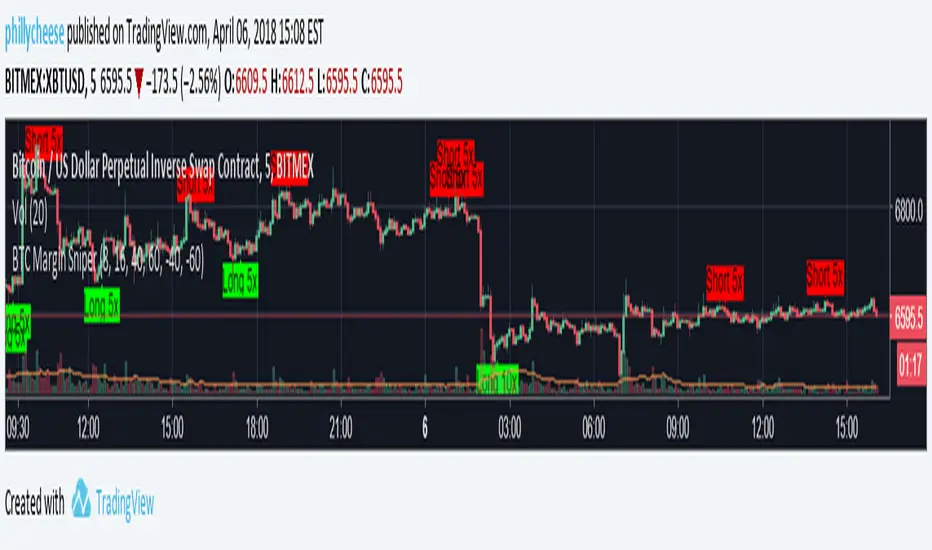
BTC Margin Sniper w/ AlertsMargin Sniper uses 2 levels for overbought and oversold to overlay possible trades on the chart. You can adjust its sensitivity by either increasing or decreasing the overbought and oversold threshold numbers. It must meet one of these levels and the short-term trend has to change direction for it to create the alert and entry on the overlay.
Increasing the overbought input makes the trigger more precise, but it may not trigger as often. Decreasing the oversold input will do the same for that trigger.
You can adjust the alerts and the overlaid position suggestions to match your preferred leverage amount.
To set an alert, click "add alert", then select this script. Choose one of the oversold or overbought alerts and enter your message.
I primarily use this on BitMEX with BTC, but you can use it with other exchanges and coins. You may have to adjust the inputs depending on the coin and the timeframe you use. Do not blindly follow this to make purchases. This is just an alert system to notify you of possible trades.
UCS Squeeze Momentum Overlay with AlertsAll credit to the great ucsgears. His original indicator is on this page:
I just remixed the visuals and added alerts when price is released from the squeeze. I find it works well on lower timeframes for Forex and Bitcoin. Suggestions for other instruments and timeframes are welcome! When adding alerts use 'On Condition' to get the fastest alerts.
Best used in conjunction with the USC_SQZ_Opt Ooscillator from this page:
Possibly useful tip: the squeeze code here is great for identifying ranging markets, and can be used with other indicators to stop alerts firing in choppy markets.

Matt's Multi-Timeframe MACD Direction AlertThe indicator monitors the direction of the Moving Average Convergence Divergence (MACD) lines on four specific timeframes: 1-hour, 15-minute, 5-minute, and 1-minute.
It only generates a signal when the MACD in all four timeframes is trending in the same direction (either all are bullish, or all are bearish). This alignment suggests a strong, synchronized market momentum from short-term scalping views up to immediate-term swing views.
Key Features:
Multi-Timeframe Confirmation: Uses TradingView's request.security() function to fetch data from different timeframes (1h, 15m, 5m, 1m), preventing the need to manually switch charts.
Visual Dashboard: A dashboard table is displayed on your chart, providing an immediate visual status (Bullish/Bearish/Neutral) for each of the four timeframes.
On-Chart Signals: The indicator plots visual shapes (green triangles for bullish alignment, red triangles for bearish alignment) directly on the sub-chart when the condition is met.
Custom Alert Integration: It includes a built-in alertcondition() function, allowing traders to set up real-time, hands-free notifications whenever a synchronized trading opportunity arises.
This tool helps filter out noise and potential false signals that might appear on a single timeframe, focusing instead on robust signals confirmed by a consensus of time perspectives.

BHUVANA Fib 50–61.8 • Turn Alerts when FIB directions change
Detects step-up / step-down on both Fib 50 & 61.8 (your “stairs” logic).
Triggers BUY/SELL on that slope change (optionally also requires price to be above/below the line).Spot volatility compression around the 50%–61.8% Fibonacci mid-band of the current swing, then trade the first expansion with clean, rules-based entries and auto SL references.
Swing mapping: Finds the active high/low over a user-defined lookback and computes Fib 50% and Fib 61.8%.
Squeeze detection: Measures the distance between 50% and 61.8%. If the band width is ≤ (ATR × multiplier), the zone is flagged as a Squeeze.
Breakout entries (on close):
Long when price crosses up through 50% while squeezed.
Short when price crosses down through 61.8% while squeezed.
Risk framework: Auto-plots stop lines from the signal bar:
Long SL = swing low; Short SL = swing high.
Visuals: Fib lines (50/61.8) + optional yellow zone highlight during squeeze.
Signals evaluate on bar close (no forward-looking data).
Works well on XAUUSD / US30 intraday (5–15m) during London/NY sessions.
Add your own alertcondition() lines if you want push alerts on Long/Short entries.

Pivot Alert Bot - Multi-TimeframeOverview
Pivot Alert Bot automatically detects and labels pivot highs and pivot lows as they confirm across multiple timeframes. Designed for active traders who want clean, actionable signals without chart clutter.
Two-Tier Pivot System
📍 Main Pivots (Length 20)
Confirmed swing points that have proven themselves with 20 bars of price action on each side. Marked with clean PH (Pivot High) and PL (Pivot Low) labels. These are your high-conviction levels.
⭐ Temporary Pivots (Length 3)
Early-stage pivots marked with ***** labels in blue. These signal potential reversals before full confirmation — ideal for aggressive entries with tighter stops.
How to Trade
The indicator is built around a simple pivot-to-pivot strategy:
🔴 Short Setup: Enter short at a Pivot High → Target the previous Pivot Low
🟢 Long Setup: Enter long at a Pivot Low → Target the previous Pivot High
This approach gives you logical, structure-based profit targets instead of arbitrary calculations.
Multi-Timeframe Support
Scan for setups across:
⚡ 5 minute — Scalping and quick intraday moves
📊 15 minute — Primary day trading timeframe
📊 30 minute — Confirmation and larger moves
⏱️ 1 hour — Context and swing trade setups
Built-In Alerts
Never miss a pivot. Alert conditions included for:
Main Pivot High confirmed
Main Pivot Low confirmed
Temporary Pivot High detected
Temporary Pivot Low detected
Set alerts once and get notified on any timeframe.
Best Used On
High-volume, liquid instruments: SPY, QQQ, NVDA, TSLA, AMD, META, AMZN, COIN, and similar names with clean price action.
Settings
Adjustable pivot lengths for both main and temporary pivots
Toggle temporary pivot visibility on/off
Customizable label colors and sizes

EMA9/EMA20 + VolMA20 Alert//@version=5
indicator("EMA9/EMA20 + VolMA20 Alert", overlay=true)
ema9 = ta.ema(close, 9)
ema20 = ta.ema(close, 20)
volMa20 = ta.sma(volume, 20)
crossUp = ta.crossover(ema9, ema20)
volOK = volume > volMa20
signal = crossUp and volOK
plot(ema9, color=color.yellow, linewidth=2)
plot(ema20, color=color.blue, linewidth=2)
plotshape(signal, title="Signal", style=shape.triangleup, color=color.lime, size=size.small, location=location.belowbar)
alertcondition(signal, title="Pump Signal", message="EMA9 crossed EMA20 with strong volume (Vol>MA20)")

Camarilla Trading - D/W/M, Alerts, TP/SL, ADX, VWAP/EMA, VolumeCamarilla Trading System
Overview
This advanced Pine Script indicator implements a comprehensive Camarilla trading system with multiple filtering mechanisms, position management, and real-time statistics. It's designed for day traders and swing traders using Camarilla pivot levels with enhanced confirmation filters.
Key Features
🎯 Core Components
- Camarilla Levels: Calculates H3, H4, H5, L3, L4, L5 pivot levels from previous period data
- Multi-Timeframe Support: Daily (D), Weekly (W), and Monthly (M) timeframe options
- Smart Position Management: Automated entry/exit with take profit and stop loss levels
📊 Advanced Filtering System
- ADX Filter**: Optional trend strength filter using Average Directional Index
- Volume Filter**: High-volume confirmation with customizable multiplier
- Trend Filter**: VWAP or EMA-based trend direction confirmation
💹 Trading Signals
Long Entries:
- Condition 1: Open crosses above H4 (below H5)
- Condition 2: Open crosses above L3 (below H3)
Short Entries:
- Condition 1: Open crosses below L4 (above L5)
- Condition 2: Open crosses below H3 (above L3)
📈 Visual Features
- Level Display: Clear plotting of all Camarilla levels
- Signal Markers: Visual entry/exit signals on chart
- Volume Coloring: Bars colored lime/purple during high-volume periods
- Trend Indicators: Colored VWAP/EMA lines based on ADX trend direction
- Real-time Statistics: Performance table with win rate, P&L, and trade metrics
⚙️ Customization Options
- Toggle individual filters on/off
- Adjustable parameters for all indicators
- Customizable display options
- Flexible timeframe selection
🔔 Alert System
- Buy/Sell signal alerts
- Position exit alerts
- Customizable alert conditions
📊 Performance Tracking
- Automatic trade statistics
- Win rate calculation
- Average profit per trade
- Total P&L tracking
- Trade history from start date
Input Parameters
Timeframe & Levels
- Timeframe levels: D/W/M selection for pivot calculations
- Show levels labels: Toggle level price labels
Filter Settings
- ADX filter: Enable/disable trend strength filter
- ADX length/treshold: Customize ADX parameters
- Volume filter: High-volume confirmation
- Volume length/multiplier: Volume MA settings
- Trend filter: VWAP/EMA trend confirmation
- EMA length: EMA period for trend filter
Display Options
- Show signals: Display entry/exit markers
- Show TP/SL: Show take profit/stop loss levels
- Show statistics: Performance table display
- Colored bars: Volume-based bar coloring
Usage Notes
- Non-repainting: Signals are fixed at bar open price
- Multi-timeframe: Uses security calls for accurate previous period data
- Position Management: Automated TP/SL based on Camarilla levels
- Risk Management: Built-in trading time restrictions
This system provides institutional-grade Camarilla trading with professional risk management features suitable for both manual trading and strategy development.

EMA Cloud + AlertsThe only EMA indicator you'll ever need.
- Flexible EMAs: Customize EMA lengths (e.g., 9, 21) to match your trading style.
- Dynamic Cloud: Auto-shades bullish (green) or bearish (red) clouds between EMAs for clear trend signals.
- Trend Change Alerts: Auto-alerts that signal when a trend change (EMA crossover) happens on the timeframe you're currently viewing.
- Timeframe Lock: Lock EMAs to a specific timeframe (e.g., 5m on a 1m chart) for consistent analysis.
- Personalized Design: Adjust EMA colors, thickness, and cloud transparency for optimal visibility.
A friendly reminder that no tool or indicator guarantees success. Integrate this into a robust trading plan.

Multi-GPS (Long Only, with Alert Mode)A guided long‑only strategy with built‑in risk controls and smart alerts — your GPS for trend trading
**Multi‑GPS (Long Only, with Alert Mode)**
The Multi‑GPS strategy is built to help traders navigate trends with a structured, risk‑managed approach. It focuses exclusively on **long opportunities**, combining multiple moving‑average signals with layered risk controls to keep trades disciplined and consistent.
Key features include:
- **Dynamic trade management** with stop loss, take profit, and trailing stop options (all adjustable by percentage).
- **Flexible order sizing**, allowing positions to scale as a percentage of account equity.
- **Customizable moving averages** (SMA or EMA) and timeframe selection to adapt to different markets and styles.
- **Integrated alerts** with multiple modes, so traders can choose between order‑based notifications, alert() calls, or both.
- **Clear chart visuals**, including entry/exit markers and plotted guide lines for transparency.
This strategy is designed to act like a **navigation system for trend trading** — guiding entries, managing exits, and keeping risk under control, all while maintaining a clean and intuitive charting experience.
---
Would you like me to also craft a **short tagline version** (like a one‑liner hook) for this strategy, so it pairs neatly with the longer description when you publish it?

Bollinger ALTswap Alert v1.0 (MA28 Rotation ALT↔BTC)Inspired by: Bollinger Awesome Alert R1 by JustUncleL
What is it?
BBALTSWAP overlays Bollinger Bands (20, 2), a 3-EMA, and a Rotation MA (default 28), then gives state-change alerts to rotate between ALT ↔ BTC on any ALT/BTC chart.
Core rotation rule
• Rotate → ALT when close > Bollinger middle and close > MA28.
• Rotate → BTC when close < Bollinger middle and close < MA28.
• Otherwise: Wait (no rotation).
Labels only print when the state changes (to avoid spam). You can also compute the rotation on a higher timeframe (default 4h) while viewing a lower one (e.g., 1h).
Optional extras
• Breakout arrows (scalping-style) when 3-EMA crosses the Bollinger middle with an Awesome Oscillator direction filter.
• Bollinger Squeeze coloring (relative width) to highlight expansion/contraction.
• Min bars between labels to throttle how often rotation labels appear.
Inputs (highlights)
• Use EMA for Bollinger / Rotation MA
• Bollinger length & multiplier
• AO fast/slow lengths
• Higher-timeframe selector for rotation (default 240 = 4h)
• Show breakout arrows / show “Wait” / min bars between labels
How to use (simple playbook)
1. Chart: open your ALT/BTC pair (e.g., ETHBTC).
2. Direction: leave rotation HTF at 4h for steadier signals.
3. Execution: take rotations on bar close; manage entries on your lower TF (1h/15m) if desired.
4. Override check (optional): when BTCUSDT is in a fresh breakout, prefer BTC even if ALT flashes briefly.
Alerts
Add two alerts, Once per bar close:
• “Rotate to ALT (state change)”
• “Rotate to BTC (state change)”
Notes
• Works on any ALT/BTC pair.
• The breakout arrows are optional and independent from the rotation signals.
• This tool is educational; not financial advice.

EMA 89 và EMA 34 - MTF AlertEMA34/89 in MTF and alert. If you want to find indicator for alert, I thing it for you

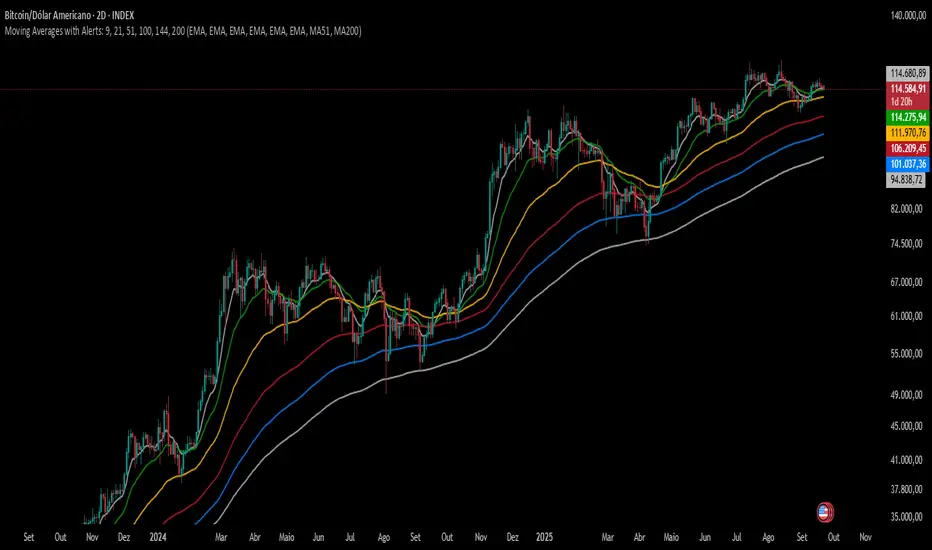
Moving Averages with Alerts: 9, 21, 51, 100, 144, 200---
This indicator plots six configurable moving averages (MA) with options for EMA, SMA, RCI, HMA, and Pivô Boss types. It highlights key crossover points, especially monitoring the 9-period MA for crosses with others. Users can enable alerts for these crossovers, as well as set custom alerts between any two selected MAs. Additionally, the indicator marks the important crossovers of the 51 and 200 MAs on the chart with an “X”. This helps traders identify trend changes and potential entry or exit points efficiently.
---
Swing Failure Pattern (SFP) with AlertsSwing Failure Pattern (SFP) — Indicator Overview
Detects classic Swing Failure Patterns and their confirmations, with optional volume validation and EMA-based trend/reversal filters. Includes convenient alert categories.
1) What are SFPs?
Price briefly breaks a prior swing high/low (liquidity grab), fails to continue, and snaps back inside the range — often a potential reversal from trapped breakout participants.
2) What the indicator plots
SFP candle: wick extending beyond the previous swing (bearish above a swing high, bullish below a swing low).
Opposite/confirmation level: dotted level derived from the opposite side of the swing structure.
Confirmation: a later close beyond the opposite level; optional ▲/▼ triangles can appear with the “SFP” labels.
Two moving averages: fast/slow MAs for context (plot type selectable); style (color/width) set in the Style tab.
3) Volume validation (optional)
Uses a lower timeframe to compare the share of volume outside the swing level (wick area) against a threshold.
None: Use when volume data is questionable (CFDs/FX) or when you want maximum SFP visibility and rely on price confirmation only.
Volume outside swing < Threshold: Default for ranges/quiet phases. Idea: thin volume outside the level suggests a liquidity sweep rather than a true breakout. Start with 20–30%. Fewer but cleaner setups; works well near HTF zones (Daily/4H).
Volume outside swing > Threshold: For news/volatility/capitulation spikes. Idea: heavy pressure beyond the level was absorbed (long wick) — strong reversals possible but more false signals. Start with 50–60%. Always wait for price confirmation.
You can auto-select a lower timeframe or set one manually for the volume check.
4) EMA filter: Trend vs. Reversal
Filtering uses EMAs of the chosen fast/slow lengths (independent of the plotted MA type).
NO MA-Filter: no EMA condition; all SFPs allowed.
Reversal Signal: bullish SFP only if fast EMA < slow EMA ; bearish SFP only if fast EMA > slow EMA .
Trend Follow: bullish SFP only if fast EMA > slow EMA ; bearish SFP only if fast EMA < slow EMA .
Tip: MA colors/widths are controlled in the Style tab; the EMA filter logic isn’t affected by the plotted MA type.
5) Alerts
Multiple alert categories let you react to events like any bullish/bearish signal, SFP detected, and confirmation occurred — without listing each individual condition. Create an alert on the indicator and pick what fits your workflow.
Always trade without risk management.
Reminder: Backtest, align with HTF context and sessions, and use solid risk management.

Emre AOI Zonen Daily & Weekly (mit Alerts, max 60 Pips)This TradingView indicator automatically highlights Areas of Interest (AOI) for Forex or other markets on Daily and Weekly timeframes. It identifies zones based on the high and low of the previous period, but only includes zones with a width of 60 pips or less.
Features:
Daily AOI Zones in blue, Weekly AOI Zones in yellow with 20% opacity, so candlesticks remain visible.
Persistent zones: AOI boxes stay on the chart until the price breaks the zone.
Multiple zones: Supports storing multiple Daily and Weekly AOIs simultaneously.
Break Alerts: Sends alerts whenever a Daily or Weekly AOI is broken, helping traders spot key levels in real-time.
Fully automated: No manual drawing needed; zones are updated and extended automatically.
Use Case:
Ideal for traders using a top-down approach, combining Weekly trend analysis with Daily entry signals. Helps identify support/resistance, supply/demand zones, and critical price levels efficiently.
