WaveTrend Oscillator w/ Short/Long/Close Alerts - WIPHigh TFs work best, but it works on any TF. I plan to continue releasing updates to it to improve overall form and function. Green Circles are Long Alerts, Red Circles are Short Alerts. Blue and Yellow Circles are Close Position Alerts. First Blue Circle After Red Circle would be Short Exit. First Yellow Circle After Green Circle would be Long Exit.
Original script was based on Lazybear Indicator-WaveTrend-Oscillator-WT Script. I have added and modified some code to my personal liking.
Cerca negli script per "alert"

Renko Chart Alerts with PivotsAdd alerts to renko charts to be notified when:
new brick
brick up
brick down
direction change
direction change up
direction change down
Also shows pivots based on brick reversals. Alerts also available for:
pivot breakout
pivot high breakout
pivot low breakout
You can hide the plots for pivot high/low and breakouts in the style tab of the settings for the indicator.
To add the alerts:
add the indicator to your renko chart
click add alert
click the condition dropdown and choose Renko Alerts
you should see all the alerts there and you can add any one or more to your chart

Neo BitMEX Futures Hedge Grid Alerts Premium v1.0This indicator was made to streamline finding the optimal entry to cash and carry/hedge on a futures contract when margin trading.
Explanation of the indicator:
This indicator has built-in alert conditions that you can use to give you email alerts, in-browser sound alerts, or SMS alerts. These alerts are based upon futures prices being in contango or backwardation.
From top to bottom, the grid shows XBTU18, XBTZ18, OkEx's Quarterlies (OKCOIN:BTCUSD3M), and CME's futures.
Red: Futures are trading above your defined range (default 1%) of spot
Maroon: Futures are trading above twice your defined range of spot
Lime: Futures are trading below your defined range (default 1%) of spot
Green: Futures are trading below twice your defined range of spot
What's configurable:
% to trigger
Grid size
Bar color toggle
Label toggle
Spot/index source (Bitfinex's BTCUSD, BitMEX's XBTUSD, and BitMEX's XBT Index are available)
Pricing:
Currently this standalone indicator is 0.007 BTC for lifetime use.
Example of use:
On 4 May 2018, BitMEX's XBTU18 was trading >2% above perpetual swap. The grid alerts signaled that and if one were long on bitcoin spot on any exchange, then it would have been a good idea to hedge a short on XBTU18. Eventually from there the premium gap was closed while bitcoin fell.
Here is the indicator shown with bar coloring and labels.

RSI-CCI Fusion + AlertsThe "RSI-CCI Fusion" indicator combines the Relative Strength Index (RSI) and Commodity Channel Index (CCI) from TradingView.
RSI-CCI Fusion: Unlocking Synergies in Technical Analysis
Technical analysis plays a crucial role in understanding market dynamics and making informed trading decisions. I often rely on a combination of indicators to gain insights into price movements and identify potential trade opportunities. In the lines below, I will explore the "RSI-CCI Fusion" indicator, a powerful tool that combines the strengths of the Relative Strength Index (RSI) and the Commodity Channel Index (CCI) to provide enhanced trading insights.
1. Understanding the RSI and CCI Indicators
Before delving into the fusion of these indicators, let's briefly review their individual characteristics. The RSI is a widely used momentum oscillator that measures the speed and change of price movements. It oscillates between 0 and 100, with readings above 70 indicating overbought conditions and readings below 30 indicating oversold conditions.
On the other hand, the CCI is a versatile indicator designed to identify cyclical trends in prices. It measures the distance between the price and its statistical average, thereby providing valuable insights into overbought and oversold levels.
2. The Concept of RSI-CCI Fusion
The RSI-CCI Fusion indicator is born out of my desire to harness the collective power of the RSI and CCI. By combining these indicators, I can benefit from a more comprehensive trading signal that captures both momentum and cyclical trend dynamics.
The fusion process involves assigning weights to the RSI and CCI, creating a blended indicator that reflects their relative importance. The weighted combination ensures that both indicators contribute meaningfully to the final result.
To maintain consistency, the RSI and CCI values are standardized using the z-score technique. This normalization process brings the values to a common scale, making them directly comparable. Rescaling is then applied to bring the combined indicator back to its original scale, facilitating intuitive interpretation.
3. Interpreting the RSI-CCI Fusion Indicator
When plotting the RSI-CCI Fusion indicator on a chart, I gain valuable insights into market dynamics and potential trading opportunities. The indicator's plot typically includes dynamic upper and lower bands, which are calculated based on the indicator's standard deviation. These bands provide boundaries for evaluating overbought and oversold conditions.
When the RSI-CCI Fusion indicator crosses above the lower band, it suggests oversold conditions and potential buying opportunities. Conversely, when the indicator crosses below the upper band, it indicates overbought conditions and potential selling opportunities. I also pay attention to the baseline, which represents the neutral level and may signal potential trend reversals.
4. Utilizing Alerts for Trading Decisions
The RSI-CCI Fusion indicator can be further enhanced by incorporating alerts. These alerts notify me when the indicator generates buy or sell signals, enabling me to take prompt action. I can customize the alerts based on my preferred thresholds and timeframes.
However, it is crucial to remember that the RSI-CCI Fusion indicator should not be relied upon in isolation. To increase the robustness of my trading decisions, it is recommended to combine the indicator with other analysis techniques such as trend lines, support and resistance levels, or additional indicators. This convergence of analysis methodologies enhances the overall accuracy of my trade signals.
Conclusion: The RSI-CCI Fusion indicator represents a compelling approach to technical analysis by synergizing the strengths of the RSI and CCI. By combining momentum and cyclical trend dynamics, I gain a more comprehensive view of market conditions. The fusion of these indicators, accompanied by timely alerts, equips me with valuable insights and facilitates well-informed trading decisions.
As with any technical analysis tool, it is essential for me to backtest the RSI-CCI Fusion indicator to evaluate its performance across different market conditions and timeframes. Additionally, applying proper risk management strategies is crucial to ensure consistent and disciplined trading practices.

[Rygel] MACD 4C with divergences, crossovers and alertsThis indicator is a reliable, exhaustive, instant, simple divergence detector for the MACD 4C oscillator.
I've struggled for months to find a MACD divergence indicator I can rely on, I've tinkered with the ones I found and never was satisfied by the final result. For all of them important divergences were not shown, for some divergences was shown too late, for others divergence lines was not drawn, some even shown some strange exotic divergences... I played will all the parameters and something was always wrong or missing at the end.
It was even worse for the MACD 4C indicator, the 4-color MACD, which I prefer to use.
So I finally decided to write my own divergence algorithm and to create my own indicator. After a few attempts, here's the result.
This MACD indicator is using the same divergence detection algorithm I wrote for my RSI indicator. You'll find on its description page a comparison of my divergence algorithm with other ones to see how it differs.
When I built this indicator, my objectives were to create one that is:
Reliable. I didn't want to have to double-check an indicator to make sure it's doing what I expect it to do. I want to be able to look at it for one second and know I can rely on it.
Exhaustive. I didn't want to have to rely on multiple indicators to be sure I'm not missing a divergence.
Instant. I wanted the divergences to be shown as soon as soon as they form and not after a pivot is confirmed. For some indicator, when the divergence is displayed, it's already too late to act on it.
Simple. I wanted my indicator to be clean, readable and not visually aggressive. The main objective of this indicator is to show divergences and I didn't want to visually overload it with unrequired information.
I wanted my indicator to be a simple as possible, nonetheless you'll find a few parameters to tinker with. Many of them will need no explanation but here's the list.
Show signal line: disabled by default. Show the MACD signal line.
Color signal line: disabled by default. Show the signal line as green when it goes up and read when it goes down.
Show signal crossovers: enabled by default. Show a green dot when MACD crosses up its signal line and a red dot when it crosses down.
Show zero line: enabled by default. Show a line at the 0 value.
Show zero crossovers: disabled by default. Show a green triangle when MACD crosses up the 0 line and a red triangle when it crosses down.
Show regular divergences: enabled by default.
Show hidden divergences: disabled by default for readability. I try to keep the indicator as clean as possible by default.
Bullish regular divergence color : no explanation needed I suppose.
Bullish hidden divergence color : same.
Bearish regular divergence color : ditto.
Bearish hidden divergence color : uhh.
Show overbought and oversell backgrounds : when RSI is oversold or oversell, the background color changes to red or green. The indicator uses two levels of oversold/overbought. When the RSI is strongly oversold/overbought the background color gets brighter. You can configure these levels in the advanced parameters.
Advanced parameters:
MACD fast moving average length: 12 by default.
MACD slow moving average length: 26 by default.
MACD signal moving average length: 9 by default.
Show divergences before pivot confirmation : enabled by default. Divergences will appear as soon as possible, before the pivot is confirmed by another candlestick. Unconfirmed divergences will appear as dashed lines then disappear if not confirmed or turn to solid lines if confirmed. This may create false positives with alerts as the divergence may disappear.
Minimum bars to check: 5 by default. As this indicator detects absolutely all the divergences, some may be insignificant and it may become unreadable without some filtering. If you want to see absolutely all the divergences, you may lower this value. Please note TradingView limits to 50 how many lines are displayed at the same time on an indicator. So when you display more divergences, some in the past disappear. It's not usually an issue but if you scroll back in time, divergences will stop to show at one point in the past.
Maximum bars to check: 75 by default. Divergences may go far in the past, this parameters limit how old a divergence may be. You can higher it to show more divergences.
Show pivots: disabled by default. Show the pivot points used for divergence detections.
This indicator offers the following alerts:
Any divergence
Bearish divergence
Bullish divergence
Regular bearish divergence
Regular bullish divergence
Hidden bearish divergence
Hidden bullish divergence
MACD becoming positive
MACD becoming negative
MACD crossing up signal line
MACD crossing down signal line
Please note TradingView limits for performance reason to 50 the number of lines you can display on an indicator at the same time. So when you scroll back in time, at one point divergences will stop to show. If you want to see divergences far in the past, you may need to use the replay feature or to configure stronger filtering settings.
I hope you'll enjoy this indicator as much as I do! :)
Feel free to comment if you experience a bug or if an important feature is missing for you. (Please note the core of this indicator is divergence detection, I want to keep it simple so I will probably not add many unrelated features to it.)

08-18 EMA Watson [ALERT SETUP][INDICATOR]Hello here is the Alert Setup of my Strategy EMA Watson, I published a backtest version on my profile two days ago.
The big triangles correspond to the buy/sell alerts.
I give access for free, just leave a comment.
More info about the script, such as inputs description, how to configure the script, strategy explanation, alert configuration can be found here : blockchainfiesta.com
--------------------------------------------------------------------------------------------------------------
Commission Work: TradingView development, Reverse Engineering, Pine Script. contact@blockchainfiesta.com.. You can also send me a message in TradingView or Discord
If you have too much crypto and want to help me out:
BTC -2.19% address: 19sVQvCDmVfEACq7BiMnWSMqFPZ8qfSQ2K
ETH address: 0xc8a5d3a63a05db0c2363ea1c08b37a01cce9ebfb

Bollinger Awesome Alert R1 by JustUncleLThis indicator is an implementation of the Bollinger Band and Awesome Oscillator Scalping system.
This technique is for those who want the most simple method that is very effective. It is BEST traded during the busiest trading hours, 3am to 12am EST NY time. This method doesn't work in sideways markets, only in volatile trending markets.
Time Frames: 1, 5, 10, 15 ,30 min.
Currency pairs: majors.
Other Chart indicators:
Add Awesome Oscillator.
Optionally Add Squeeze Indicator.
Here's the strategy:
Going LONG:
Enter a long position when the black 3 EMA has crossed up through the Bollinger red middle band MA. At the same time, the Awesome should be approaching or crossing it's zeroline, going up. This is indicated by "Buy" alert.
Going SHORT:
Enter a short position when the black 3 EMA has crossed down through the Bollinger red middle band MA. At the same time, the Awesome should be approaching or crossing it's zero line, going down. This is indicated by the "Sell" Alert.
Take profit:
10-20 pips depending on pair or When Awesome Oscillator turns a different colour.
HINTS: Best trades tend to occur when price reversing bounce off outer band and outside the Optional Bollinger Squeeze indication.

Open Close Cross Alert R6 by JustUncleLThis revision of this indicator is an Open Public release. The indicator alert based on JayRogers "Open Close Cross Strategy R2" and is used in conjunction with the revised "Open Close Cross Strategy R5".
Description:
This indicator alert created for TradingView alarm sub-system (via the alertcondition() function, which currently does not work in a "Strategy" script). Also this indicator plots the Difference Factor between the Close and Open Moving Averages, this gives a good indication of strength of move. Also included in this release is optional Divergence finder with variable width channel.

Digital Clock with Candle Alert📊 Digital Clock with Candle Alert
A sleek, customizable digital clock for your trading charts that displays real-time with seconds and provides visual alerts before new candles form. Never miss a candle entry again!
✨ Key Features:
- Real-time Digital Clock - Shows hours, minutes, and seconds in your chosen timezone
- Visual Candle Alerts - Blinking notification before new candles form
- Multi-Timeframe Alerts - Get alerts for any timeframe regardless of your chart period
- Fully Customizable - Colors, size, position, and alert timing all configurable
- Half-Second Blinking - Eye-catching 2Hz blink rate for maximum visibility
- 6 Timezone Options - Exchange, UTC, New York, London, Tokyo, Sydney
🎯 Use Cases:
- Scalping - Know exactly when the next candle will form
- Entry Timing - Perfect for strategies that enter on new candles
- Multi-Timeframe Trading - Monitor higher timeframe candles while on lower timeframes
- General Awareness - Always know the current time in your trading timezone
⚙️ Settings:
Time Settings:
- Timezone selection (Exchange default or specific zones)
Display Options:
- Text and background colors for normal operation
- Alert colors for blinking state
- Text size (tiny to huge)
- Position (9 locations on chart)
Alert Configuration:
- Enable/disable blinking alerts
- Select timeframe to monitor
- Alert lead time (5 seconds to 1 hour)
📝 Important Notes:
- Clock updates depend on incoming price ticks
- During low-volume periods, updates may be less frequent
- Works best on liquid instruments during active market hours
- Alert timeframe is independent of your chart timeframe
💡 Tips:
- Use contrasting alert colors for maximum visibility
- Set lead time based on your reaction needs
- Position clock where it won't obstruct price action
- Try red background with white text for urgent alerts
🔄 Version 1.0 - Initial release

[Rygel] RSI with divergences and alertsThis indicator is a reliable, exhaustive, instant, simple divergence detector for the RSI oscillator.
I've struggled for months to find a RSI divergence indicator I can rely on, I've tinkered with the ones I found and never was satisfied by the final result. For all of them important divergences were not shown, for some divergences was shown too late, for others divergence lines was not drawn, some even shown some strange exotic divergences... I played will all the parameters and something was always wrong or missing at the end.
So I finally decided to write my own divergence algorithm and to create my own indicator. After a few attempts, here's the result.
At first. Please find below a quick comparison of this indicator with some of the most popular RSI divergence indicators on TradingView. I've hidden their names as it's not my intention to show them in a bad light. These indicators are great and some of you may even find them better than this one, they were just not what I was looking for.
You will most likely notice all of them are missing divergences but not always the same. You'll have to combine all of them to get (almost) all the divergences.
When I built this indicator, my objectives were to create one that is :
Reliable. I didn't want to have to double-check an indicator to make sure it's doing what I expect it to do. I want to be able to look at it for one second and know I can rely on it.
Exhaustive. I didn't want to have to rely on multiple indicators to be sure I'm not missing a divergence.
Instant. I wanted the divergences to be shown as soon as soon as they form and not after a pivot is confirmed. For some indicator, when the divergence is displayed, it's already too late to act on it.
Simple. I wanted my indicator to be clean, readable and not visually aggressive. The main objective of this indicator is to show divergences and I didn't want to visually overload it with unrequired information.
I wanted my indicator to be a simple as possible, nonetheless you'll find a few parameters to tinker with. Many of them will need no explanation but here's the list.
Show regular divergences : enabled by default.
Show hidden divergences : disabled by default for readability. I try to keep the indicator as clean as possible by default.
Bullish regular divergence color : no explanation needed I suppose.
Bullish hidden divergence color : same.
Bearish regular divergence color : ditto.
Bearish hidden divergence color : uhh.
Show overbought and oversell backgrounds : when RSI is oversold or overbought, the background color changes to red or green. The indicator uses two levels of oversold/overbought. When the RSI is strongly oversold/overbought the background color gets brighter. You can configure these levels in the advanced parameters.
Advanced parameters:
RSI source: "close" by default.
RSI length: 14 by default.
Show divergences before pivot confirmation : enabled by default. Divergences will appear as soon as possible, before the pivot is confirmed by another candlestick. Unconfirmed divergences will appear as dashed lines then disappear if not confirmed or turn to solid lines if confirmed. This may create false positives with alerts as the divergence may disappear.
Minimum bars to check: 5 by default. As this indicator detects absolutely all the divergences, some may be insignificant and it may become unreadable without some filtering. If you want to see absolutely all the divergences, you may lower this value. Please note TradingView limits to 50 how many lines are displayed at the same time on an indicator. So when you display more divergences, some in the past disappear. It's not usually an issue but if you scroll back in time, divergences will stop to show at one point in the past.
Maximum bars to check: 50 by default. Divergences may go far in the past, this parameters limit how old a divergence may be. You can higher it to show more divergences.
Use limits for divergences: enabled by default. Don't show divergences when they are above or below a threshold. Another filtering options to make sure only relevant divergences are shown.
Minimum value for bearish divergence: 40 by default.
Maximum value for bullish divergence: 60 by default.
Show pivots: disabled by default. Show the pivot points used for divergence detections.
Oversold level: 30 by default. A red background is shown when the indicator goes below this level.
Overbought level: 70 by default. A green background is shown when the indicator goes above this level.
Strongly oversold level: 20 by default. A brighter red background is shown when the indicator goes below this level.
Strongly overbought level: 80 by default. A brighter green background is shown when the indicator goes above this level.
Show moving average: disabled by default. Add a moving average to the indicator.
Moving average type: SMA by default. You may choose between Bollinger Bands, EMA, SMA, SMMA (RMA), VWMA and WMA.
Moving average length: 14 by default.
Bollinger Band standard deviation 2 by default.
This indicator has the following alerts:
Any divergence
Bearish divergence
Bullish divergence
Regular bearish divergence
Regular bullish divergence
Hidden bearish divergence
Hidden bullish divergence
Please note TradingView limits for performance reason to 50 the number of lines you can display on an indicator at the same time. So when you scroll back in time, at one point divergences will stop to show. If you want to see divergences far in the past, you may need to use the replay feature or to configure stronger filtering settings.
I hope you'll enjoy this indicator as much as I do! :)
Feel free to comment if you experience a bug or if an important feature is missing for you. (Please note the core of this indicator is divergence detection, I want to keep it simple so I will probably not add many unrelated features to it.)

TradingView Alerts to MT4 MT5 - Forex, indices, commoditiesHowdy Algo-Traders! This example script has been created for educational purposes - to present how to use and automatically execute TradingView Alerts on real markets.
I'm posting this script today for a reason. TradingView has just released a new feature of the PineScript language - ALERT() function. Why is it important? It is finally possible to set alerts inside PineScript strategy-type script, without the need to convert the script into study-type. You may say triggering alerts straight from strategies was possible in PineScript before (since June 2020), but it had its limitations. Starting today you can attach alert to any custom event you might want to include in your PineScript code.
With the new feature, it is easier not only to execute strategies, but to maintain codebase - having to update 2 versions of the code with each single modification was... ahem... inconvenient. Moreover, the need to convert strategy into study also meant it was required to rip the code from all strategy...() calls, which carried a lot of useful information, like entry price, position size, and more, definitely influencing results calculated by strategy backtest. So the strategy without these features very likely produced different results than with them. While it was possible to convert these features into study with some advanced "coding gymnastics", it was also quite difficult to test whether those gymnastics didn't introduce serious, bankrupting bugs.
//////
How does this new feature work? It is really simple. On your custom events in the code like "GoLong" or "GoShort", create a string variable containing all the values you need inside your alert and this string variable will be your alert's message. Then, invoke brand new alert() function and that's it (see lines 67 onwards in the script). Set it up in CreateAlert popup and enjoy. Alerts will trigger on candle close as freq= parameter specifies. Detailed specification of the new alert() function can be found in TradingView's PineScript Reference (www.tradingview.com), but there's nothing more than message= and freq= parameters. Nothing else is needed, it is very simple. Yet powerful :)
//////
Alert syntax in this script is prepared to work with TradingConnector. Strategy here is not too complex, but also not the most basic one: it includes full exits, partial exits, stop-losses and it also utilizes dynamic variables calculated by the code (such as stop-loss price). This is only an example use case, because you could handle variety of other functionalities as well: conditional entries, pending entries, pyramiding, hedging, moving stop-loss to break-even, delivering alerts to multiple brokers and more.
//////
This script is a spin-off from my previous work, posted over a year ago here: Some comments on strategy parameters have been discussed there, but let me copy-paste most important points:
* Commission is taken into consideration.
* Slippage is intentionally left at 0. Due to shorter than 1 second delivery time of TradingConnector, slippage is practically non-existing.
* This strategy is NON-REPAINTING and uses NO TRAILING-STOP or any other feature known to be causing problems.
* The strategy was backtested on EURUSD 6h timeframe, will perform differently on other markets and timeframes.
Despite the fact this strategy seems to be still profitable, it is not guaranteed it will continue to perform well in the future. Remember the no.1 rule of backtesting - no matter how profitable and good looking a script is, it only tells about the past. There is zero guarantee the same strategy will get similar results in the future.
Full specs of TradingView alerts and how to set them up can be found here: www.tradingview.com

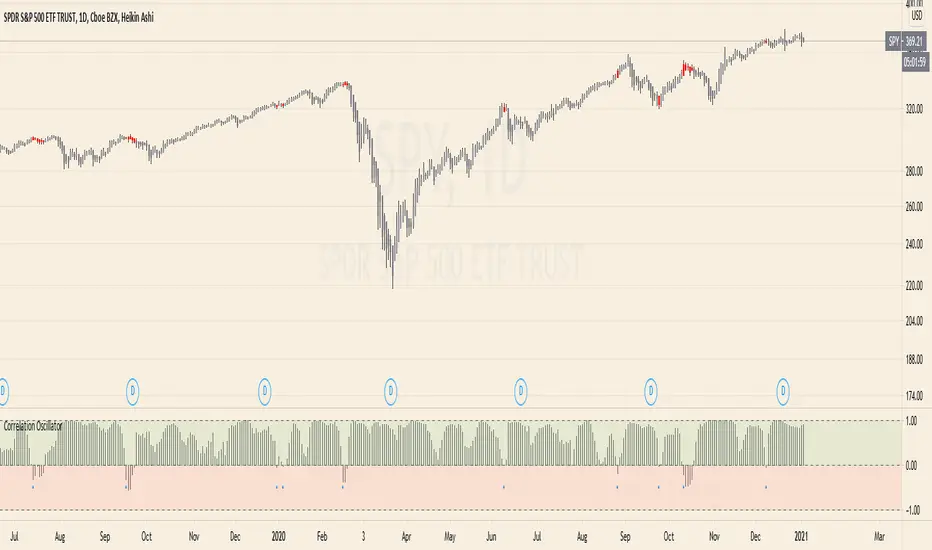
Correlation Oscillator - Anomaly AlertsThis script plots the correlation for two symbols as an oscillator:
A correlation of 1 means that both values move in the same direction together.
A correlation of -1 means that both values are perfectly negative correlated.
Parameter:
Length of the Correlation
The two symbols you want to calculate the correlation for
Barcolor: Defines whether Bar-coloring is set on.
The Number of bars lookback for anomaly: Say both are normally positively correlated it is an anomaly when the correlation turns negative and vica-versa.
Alerts: You can also set an Alert when an anomaly is detected.(blue dots on oscillator)
This has many use-cases:
For example VVIX and VIX are normally positive correlated.
When this turns negative, this can mean that we are on a turning point:
--> VVIX is rising while VIX is falling, risk of future Volatility is increasing (Top)
--> VIX is rising while VVIX is falling, risk of future Volatility is decreasing (Bottom)
Another use-case is just checking the correlation of stocks in your portfolio to diversify.
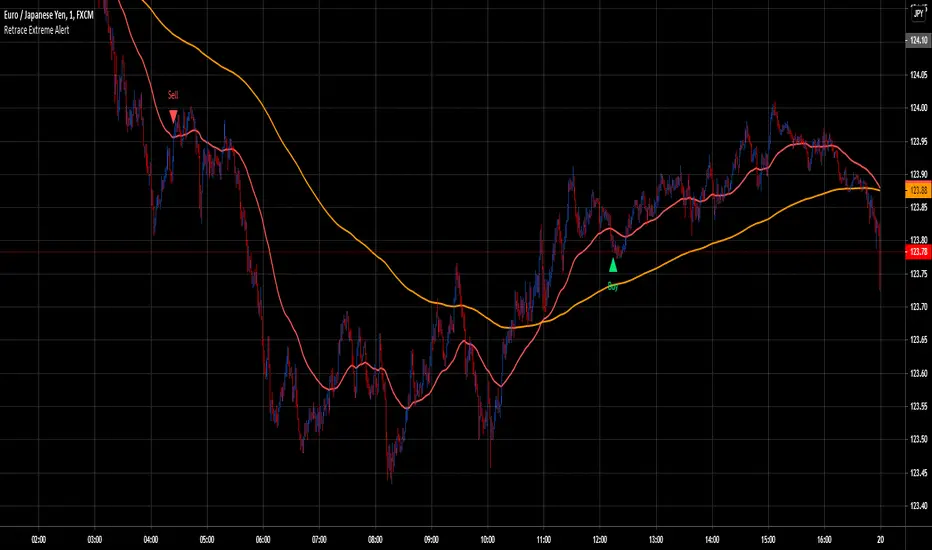
Retrace Extreme AlertThis indicator will alert you after 3 conditions are met. First an EMA cross, second price crosses back into the EMA and third RSI above or below a certain value. Upon these 3 conditions being met you will receive an alert.
Main Trend Alert v1.1*** New Version of Main Trend Alert ***
This is an indicator that shows the main trend of and chart (crypto, forex, stock and etc). Good for day trading.
- HOW TO USE: When you are on lower timeframe, set the "Main Timeframe" to a higher timeframe from settings.
For example: Set "Main Timeframe = 1 Hour" when you are trading on 5 minute chart.
* Never trade just based on alerts of this script. Always use it with a system you like. Keep in mind that his script doesn't determine the stop loss and exit point.
* NO REPAINTS *
Good Luck,

RePaNoCHa V4 [Alerts]Script for automatic trading with Alerts.
LG --> Long (green: not confirmed) (lime: confirmed)
ST --> Short (maroon: not confirmed) (red: confirmed)
TS --> Trailing Stop
xL --> Close Long Position
xS --> Close Short Position
SL --> Stop Loss
The trailing stop closes the trade if the price changes direction by a specified percentage or offset. There is no ideal distance because markets and price are always changing and we know that is impossible to exit on the top or bottom. This script interpolate the trailing Stop Offset with profit, higher profit --> higher Trailing Stop Offset. Despite this, it's difficult to catch the price but not impossible. It has a TS delay too. It take a snapshot every X seconds, if the TS is activated the alert is triggered, otherwise the price keeps fluctuating until a new snapshot.
It can be easily converted to Backtest. Just delete "//" on the corresponding part.
Default settings for XBT:USD at 1H.

Ichimoku Cloud Daily Offset with Alerts The Skript uses Offsets in both positive and negative direction to give buy and sell alerts.
Use the Script on a daily Timeframe
- No financial advice -
There are 3 Buy and 3 Sell alerts in the Skript.
Buy 1 - B1: Buy e.g. 3%
Buy 2 - B2: Buy e.g. 10%
Buy 3 - B3: Buy e.g. 50%
Sell 1 - S1: Sell e.g. 5%
Sell 2 - S2: Sell e.g. 30%
Sell 3 - S3: Sell e.g. 90%

Donchian Channel Alerts R1 by JustUncleLThis idea is based on the Donchain Channel centre line Price action. When price moves from the highest/lowest point, the price will move to the center line first. At this point, the center line acts as dynamic support/resistance and often price will bounce back up. However, if price successfully breaks the centre line (primary entry condition), then prices will tend to catch up to the bottom channel line, many times making further moves in that direction (secondary entry condition).
This script alert idea is designed to be used with Renko (10pip brick recommended) Renko or Heikin Ashi (1 hour recommended) charts. It combines the Donchian Channel centre line price action with a directional coloured EMA (default length 8) to provide entry and exit signals.
There are three options to exit trade:
MA Cross (default exit) = exit occur when price breaks EMA in opposite direction.
Centre Cross = exit occurs when price breaks back passed the centre line in opposite direction.
Brick Colour = exit when a brick/bar paints in the opposite colour to trade direction.
Each Entry and Exit signal creates an Alertcondition that can be picked up by the TradingView Alarm system.
TIPS:
This type of Trading technique only works well in a trending market. Do not try to trade this technique in a ranging/flat market, wait for market to return to trend or pick another pair.
To get 10pip Bricks set Renko to "Traditional" type bricks and 0.001 for non-JPY currency pairs and 0.1 for JPY currency pairs. Also set chart Time frame to 5min or 15mins.
Renko chart:

Candle Close Alert# Candle Close Alert ⚡️
A simple and convenient indicator to track candle closes relative to your key price level.
---
### *Key Features:*
* Allows you to set a key price level (*Key Level Price*) 🎯
* Sends alerts when the candle body closes above or below this level 🔔
* Choose the check type in settings:
* **Close only** — triggers if the candle’s close price is above/below the level ⬆️⬇️
* **Whole body** — triggers if the entire candle body (open and close) is above/below the level 🕯️
* The level is shown on the chart as an orange line 📈
* By default, the level is unset and hidden
---
### *How to use:*
1. Enter your desired key level in the indicator settings 🖊️
2. Select the check type (Close only or Whole body) ⚙️
3. Create alerts based on the indicator conditions:
* "↑ Body closed above level"
* "↓ Body closed below level"
4. When creating alerts, **set alert frequency to** ***Once Per Bar Close*** ⏰ — this ensures alerts fire only once per candle close.
⚠️ *Note:* The alert will trigger on the close of **every** candle meeting the condition until the alert is manually turned off.
5. Receive timely notifications about candle closes relative to your key level ⏰
---
# Candle Close Alert ⚡️
Простой и удобный индикатор для отслеживания закрытия свечи относительно ключевого уровня.
---
### *Основные функции:*
* Позволяет задать ключевой уровень цены (*Key Level Price*) 🎯
* Выдаёт уведомление (alert), когда тело свечи закрывается выше или ниже этого уровня 🔔
* В настройках можно выбрать тип проверки:
* **Close only** — срабатывает, если цена закрытия свечи (close) выше/ниже уровня ⬆️⬇️
* **Whole body** — срабатывает, если всё тело свечи (open и close) выше/ниже уровня 🕯️
* Уровень отображается на графике оранжевой линией 📈
* По умолчанию уровень не задан и не отображается
---
### *Как использовать:*
1. Введите желаемый ключевой уровень в настройках индикатора 🖊️
2. Выберите тип проверки (Close only или Whole body) ⚙️
3. Создайте алерты на основе условий индикатора:
* "↑ Тело закрыто выше уровня"
* "↓ Тело закрыто ниже уровня"
4. При создании алерта **обязательно установите частоту срабатывания** ***Один раз за бар (Once Per Bar Close)*** ⏰ — это гарантирует, что алерт сработает ровно один раз при закрытии свечи.
⚠️ *Примечание:* Алерт будет срабатывать на закрытие **каждой** свечи, соответствующей условию, пока не будет выключен вручную.
5. Получайте своевременные уведомления о закрытии свечей относительно важного уровня ⏰

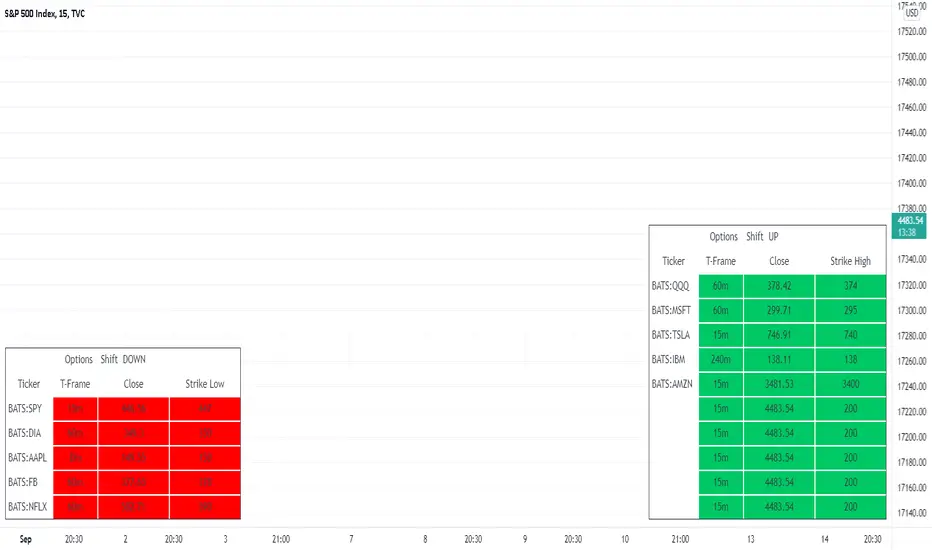
MTF - Options Strike Price - Screener & AlertsHi fellow traders ,
Pleased to share an MTF – Option Strike Price Screener.
It Screens 15 tickers for your set Strike Prices in the input column or you can also set the Stop Loss/target prices for your portfolio watch list in a single input window.
All you need to do is attach to any chart and set the periodicity of the to your desired alert() frequency requirement.
Now go to the input settings icon of the script and set your tickers, timeframe and option strike prices or if you would like to track your individual ticker stop loss or target prices!
Set the alert from the menu as usual click - Any alert() function call and bingo you are done!!
In all of 2-3 minutes you can set your Option Strike Alerts or TP’s or SL’s for 15 stocks of your portfolio..
Only a single alert() will track 15 tickers across multiple time frames..
Once your Alert is hit you may need to change the input settings and save as default and again set an alert() and delete the last alert()..
No more opening multiple charts and setting individual time consuming alerts().
Happy trading with TV..
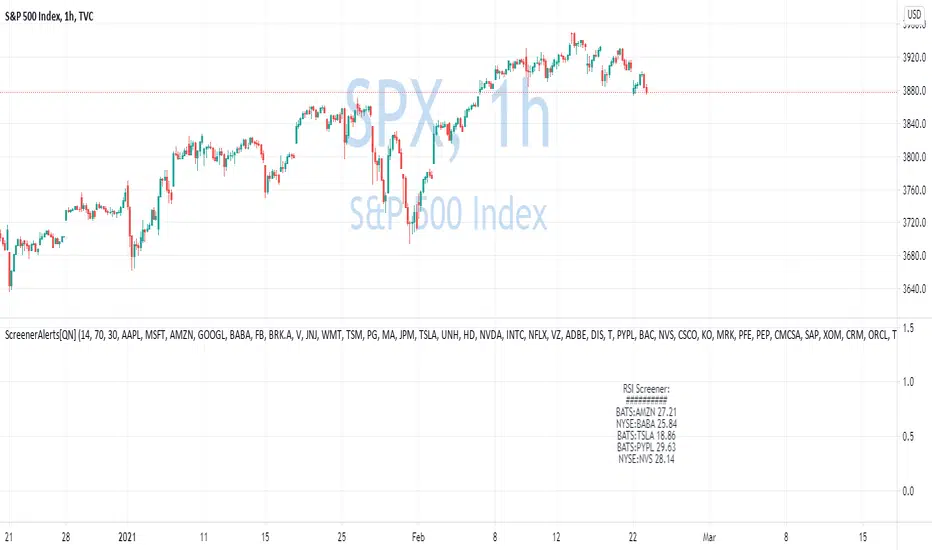
Custom Screener with Alerts V2 [QuantNomad]TradingView just recently announced the alert() function that allows you to create dynamic alerts from both strategies and studies.
So I decided to update custom screener I published before. It was based on alerts from orders in strategies, that was the only way to create dynamic alerts in PineScript at that point.
With the alert() function code become cleaner and more readable.
It works for up to 40 symbols at the same time.
You can create an alert from it easily by selecting screener name from the list and then selecting "Any alert() function call".
No additional configuration is required, message and alert on close I set up in the code.
I created as an example a screener that tracks both overbought (RSI > 70) and oversold stocks (RSI < 30).
To create your own screener you have to change only screenerFunc().
By design it should output 2 values:
cond - True/False Boolean variable. Should this instrument be displayed in the screener?
value - Additional numeric value you can display in your screener. I display RSI level for selected stocks for example.
Link to the old screener:
Disclaimer
Please remember that past performance may not be indicative of future results.
Due to various factors, including changing market conditions, the strategy may no longer perform as good as in historical backtesting.
This post and the script don’t provide any financial advice.
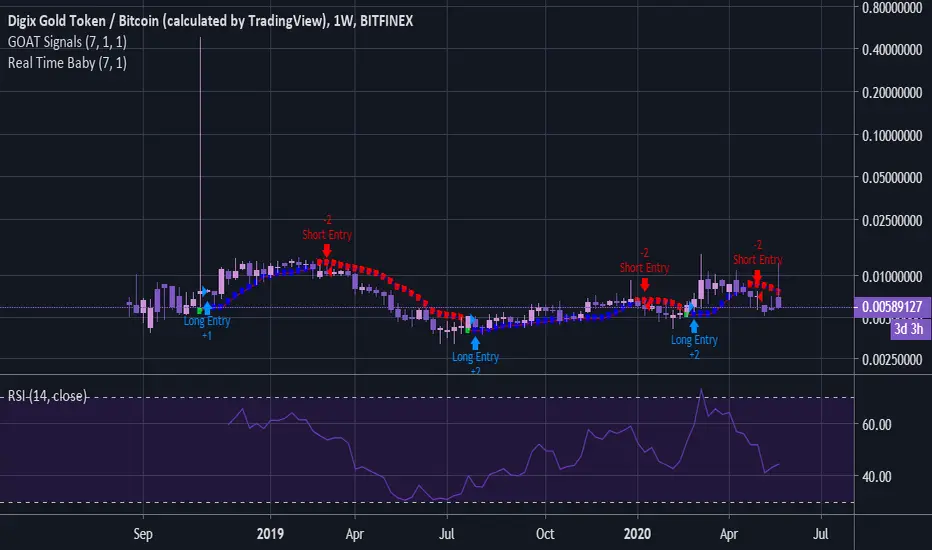
GOAT Signals - Real Time Baby! Custom Alert ScriptWELCOME to GOAT Signals - Real Time Baby! Custom No Repaint Buy Sell Moving Average (MA) Alert Script!
This script can be set to send GOAT Signals Custom Indicator Alerts.
The Step input gives price action some breathing space if desired. Steps can be added or subtracted.
The strategy tester does not calculate in trading fees, therefore in most cases will work better on longer time frames.
Personally, I use the Daily and Weekly charts except during high volatility , and use a one or two bar trail depending on price action.
Past performance does NOT guarantee future gains but keep in mind Bitcoin , Litecoin and a few others are on deflationary cycles.
Access included with GOAT Signals Custom No Repaint Buy Sell Arrow Strategy Tester.
For full invite only access please contact DogeyBlaze.
Not Certified Financial Advice.
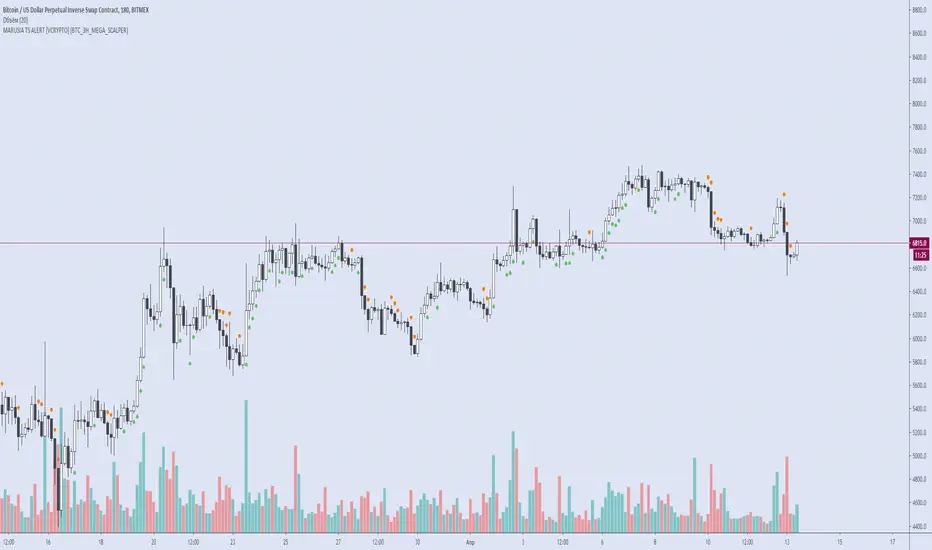
MARUSIA TRADING STRATEGIES ALERT [VCRYPTO]This is an alert indicator for MARUSIA TRADING STRATEGIES to receive alerts
for possible Buy/Sell signals.
How to use:
Use with MARUSIA TRADING STRATEGIES .
Make sure that the alert you are using and the strategy are the same
Choose alerts on TV
Add alert and choose "Long alert" or "Short alert".
Recommended to choose latency of the alerts "Once per bar".
-------------------------------------------------------------
Данный индикатор является индикатором для получения уведомлений входа в лонг/шорт позицию
по стратегии MARUSIA TRADING STRATEGIES .
Как использовать :
Используйте в сочетании со стратегией MARUSIA TRADING STRATEGIES
Обратите внимание, что в индикаторе и в стратегии выбраны одинаковые стратегии.
Нажмите на уведомления на ТВ.
Нажмите добавить уведомление.
Выберите "Long alert" или "Short alert".
Рекомендуется поставить частоту получения уведомлений "один раз за бар".
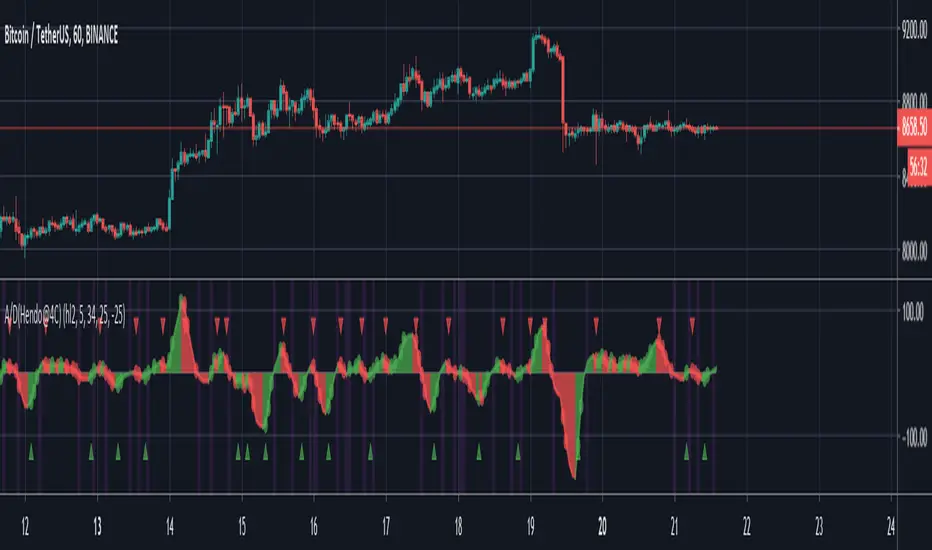
Acceleration/Deceleration with alerts (Hendo@4C)My variation of the Acceleration/Deceleration by Bill Williams. I found the existing variations of this indicator on TradingView severely lacking in terms of options. Credits go to a close friend who recommended writing this.
NOTE: The setting called: "Invert acceleration dots", can make gauging tops and bottoms "earlier" easier. Due to the nature of this indicator and the fact that you can set alerts on deceleration.
//Overview of settings//
“Plot tops and bottoms” default: True
An option to enable plotting shapes when a top or bottom is printed. I use a non conventional way to detect tops and bottoms. This secures false signals. Alerts can be added to this.
“Fill background” default: True
Fills the background between the A/D and the 0 line.
“Source for A/D” default: (high+low)/2
This is the source for calculation of the indicator. Bill Williams himself describes using the “HL2” and this is what the default value is. Potentially once could experiment with “HLC3” (high+low+close)/3. Since this is also a popular way of using this indicator.
“Length of F-SMA” default: 5
The length of the fast simple moving average that the indicator uses. Again: The default is 5 but one could experiment with higher/lower values to change the reaction time of the indicator.
“Length of S-SMA” default: 34
The lenght of the slow simple moving average that the indicator uses. The default by Bill Williams here is 34. One could experiment with higher values to reduce noise.
“Activate less noise mode” default: False
Uses a proprietary way of averaging values in price. This creates an entirely new indicator in itself. Can be very useful for trading the lower timeframes. It is however advised to understand that enabling this settings will not make the indicator the “standard A/D // AC” anymore.
“Plot alert levels” default: False
This setting allows you to plot extra levels at certain values (just like the RSI for example). Keep in mind however that you need to manually adjust the values to fit the instrument you’re trading. Of course you can set alerts to these levels. Be careful enabling this: Since it might pull the chart out of proper scaling.
“Value of +Line plot” default: 25”
Sets the level of the first “alert level” described earlier. I picked 25 as an example for Bitcoin. Be careful setting these levels: Since it might pull the chart out of proper scaling.
“Value of -Line plot” default: -25”
Sets the level of the second “alert level” described earlier. I picked -25 as an example for Bitcoin. Be careful setting these levels: Since it might pull the chart out of proper scaling.
“Fill background between lines” default: False
Enabling this will fill the background between the previously discussed +Line plot and the -Line plot. Again: Much like RSI.
“Color background if 0 is crossed” default: True
Colors the background of the indicator everytime the 0 line is crossed. Of course alerts can be set up in order to push an alert every time this happens. The default color for this is “Fuchsia”. Because it contrasts well.
“Show visual accel/decel” default: True
Uses a few simple mathematical functions in order to calculate if the A/D is accelerating or decelerating. If enabled it will plot dots when the A/D is accelerating up or accelerating down: Meaning: When the change is more rapid than the previous change (hence acceleration).
"Invert acceleration dots" default: False
Changes the previous function mentioned: Let’s say you don’t want to know acceleration but you want to know the the A/D is decelerating (meaning: The change is less rapid than the previous change). You can enable this setting. If you enable this it will plot dots on the A/D when we’re decelerating instead of accelerating. (hence deceleration).
"Color entire background of A/D" default: False
In case you desire to plot the entire background of the indicator you can enable this setting. Might make it a little bit more easy to spot changes in the A/D (especially when using multiple indicators).
That’s all in terms of settings. Most of these settings also describe the use case.
The use case as described by TradingView is the following:
“The Accelerator Oscillator (AC) is an indicator developed by Bill Williams that helps traders gauge changes in momentum. It is based on the Awesome Oscillator (AO) and measures the difference between that indicator and its 5-period moving average, effectively showing how quickly the AO changes and predicting what it will do next. If the AC is in positive territory, the upward acceleration is likely to continue. If the AC is in negative territory, the downward acceleration is likely to continue. The bars in the histogram have 2 colors: red indicating a fall in price and green indicating a rise in price. Various specific buy and sell signals can be derived from the color of the bars and whether they are above or below the 0-line.”
I’ve decided to add any alert I could think of: Meaning there are in total 22 customizable alerts to set up when using this indicator. If you have any conditions that I forgot to add feel free to leave a comment.