Andean • Dot Watcher (Exact Math + Optional Alerts)Title: Andean • Dot Watcher (1m + 1000T Alerts)
Description:
The Andean • Dot Watcher is a precision trend-detection tool that plots Bull and Bear “dot” signals for both the 1-minute chart and the 1000-tick chart — all in one indicator. It’s designed for traders who want early confirmation from tick data while also monitoring a traditional time-based chart for added confluence.
Key Features:
Dual-Timeframe Signals – Plots and alerts for both 1m and 1000T chart conditions.
Bull Dots – Green markers indicating bullish dominance or trigger events.
Bear Dots – Red markers indicating bearish dominance or trigger events.
Customizable Dot Mode – Choose between continuous dominance, flip-only signals, or crossover conditions.
Real-Time Alerts – Built-in TradingView alerts for:
1m Bull / 1m Bear signals
1000T Bull / 1000T Bear signals
Alert Flexibility – Users can set alerts for either timeframe independently or combine them for confirmation setups.
Usage Tips:
For fastest reaction, combine 1000T dots with 1-minute dots as a confirmation filter.
If your TradingView plan does not include tick charts, you can still use the 1-minute signals without issue.
Works best when combined with your existing trade plan for entries, exits, and risk management.
Requirements:
1-minute chart signals work on any TradingView plan (including Basic).
1000T tick chart signals require a TradingView plan that supports tick charts.
Cerca negli script per "alert"
Triple EMA with Alert | 21, 50, 200 EMA Strategy + Crossover🚀 Boost your trading edge with the Triple EMA with Alert — a professional-grade indicator designed for traders who want precise, real-time trend confirmation across short, medium, and long-term market movements.
🔹 What Makes This Indicator Powerful?
Three Adjustable EMAs — Default: 21, 50, 200 periods (fully customizable 1–200).
Toggle Visibility — Show only the EMAs you need for your strategy.
Real-Time Alerts — Get notified instantly when:
EMA 1 crosses EMA 2 → short-term trend change.
EMA 2 crosses EMA 3 → medium-term trend alignment.
Works on All Markets & Timeframes — Forex, crypto, stocks, indices, and commodities.
🔹 Why Traders Love It
📊 Multi-Timeframe Trend Confirmation — Filter out noise and trade with market momentum.
🎯 Accurate Crossover Signals — Identify bullish and bearish momentum shifts.
🔔 Hands-Free Monitoring — Alerts keep you informed even when you’re away from the chart.
💡 Versatile for Any Strategy — Perfect for scalping, swing trading, or long-term investing.
🔹 How to Use It
Bullish Signal — EMA 1 crossing above EMA 2 or EMA 2 crossing above EMA 3.
Bearish Signal — EMA 1 crossing below EMA 2 or EMA 2 crossing below EMA 3.
Combine with support/resistance zones, RSI, or volume for higher probability trades.
📌 Pro Tip:
Use EMA 21 & EMA 50 for momentum confirmation.
Use EMA 200 to spot the overall market direction.
If you’re serious about trend trading with precision, the Triple EMA with Alert will keep you one step ahead of market moves — no more missed entries or exits.

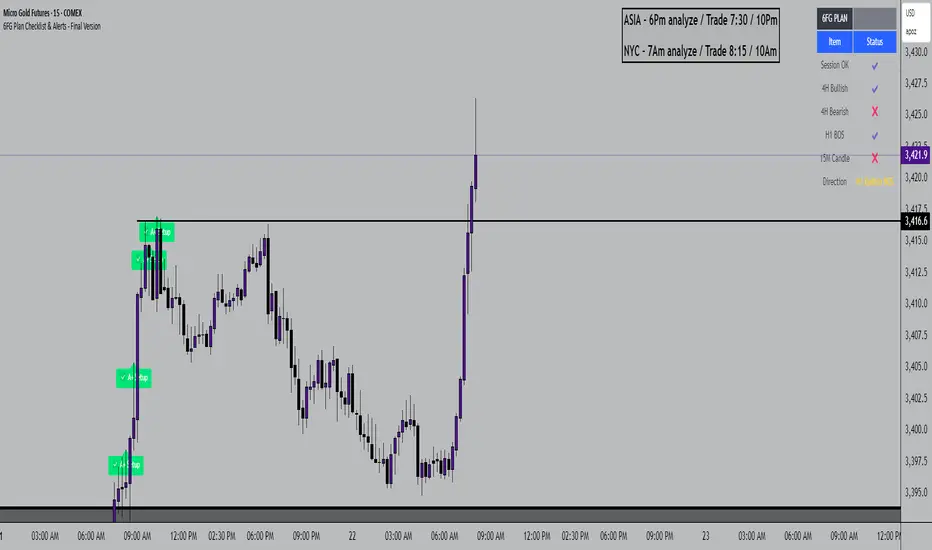
6FG Plan Checklist & Alerts - Final Version🧠 SCRIPT OVERVIEW: "6FG A+ SETUP - Simplified"
This script is designed to identify high-probability A+ trade setups in alignment with your personal 6FG trading plan, based on:
H1 Break of Structure (required)
4H trend confirmation
15M candle confirmation
Session filter
A+ Label & Visual Table Checklist
✅ KEY COMPONENTS
1. Toggle Inputs
These allow you to customize your view and filters without changing the code:
showSession: Only allow alerts inside Asian or NY sessions
show4hTrend: Include or ignore 4H directional bias
show15mConfirm: Include or ignore confirmation from 15M candles
showTable: Display checklist table on chart
showLabel: Display the “✅ A+” label on qualifying bars
2. Session Filter
Defines valid timeframes for trading (Asian or New York)
Helps avoid setups during low-liquidity hours
Controlled by showSession
3. 4H Trend (Confirmation Only)
Uses a 20-period SMA on 4H to detect general bias:
Bullish = Price above SMA
Bearish = Price below SMA
This trend is not mandatory for an alert if toggle is off
4. H1 Break of Structure (REQUIRED)
Looks at the highest high and lowest low of the last 10 candles on the 1H timeframe
Detects either:
Bullish BOS = Current close > highest high
Bearish BOS = Current close < lowest low
This is the core trigger for the A+ setup
If BOS doesn't happen, no entry is valid
5. 15M Confirmation Candles
(Optional - controlled by show15mConfirm)
Checks for one of three confirmation patterns:
Bullish Engulfing
Bearish Engulfing
Pin Bar
This adds confidence but can be toggled off
6. Entry Conditions (A+ Setup)
All the following must be true for entryOK = true:
✅ H1 BOS (required)
✅ Session is valid (if toggle is on)
✅ 15M confirmation pattern (if toggle is on)
✅ 4H trend (if toggle is on)
7. Visual Output
If entryOK = true:
✅ A green "A+" label appears below price
✅ A checklist table on the top-right shows:
Session status ✔️❌
4H bullish/bearish ✔️❌
H1 BOS ✔️❌
15M confirmation ✔️❌
Final Direction: Bullish / Bearish / —
A+ Setup: ✔️❌
8. Alerts
You will receive a TradingView alert when an A+ Setup is detected:
LTHB & HTLB Zones with AlertsIn price action trading, the Lowest Tick of the Highest Bar (LTHB) and the Highest Tick of the Lowest Bar (HTLB) are important concepts for support/resistance identification, trend exhaustion, and reversal confirmation. Here's what they mean and why they matter:
🔹 Definitions
1. Lowest Tick of the Highest Bar (LTHB):
The lowest price (tick) of the bar (candlestick) with the highest high in a recent price swing.
Significance: It marks the support inside an upward swing. If price breaks below this, it often indicates loss of upward momentum or reversal.
2. Highest Tick of the Lowest Bar (HTLB):
The highest price of the bar with the lowest low in a swing.
Significance: It acts as a resistance inside a downward swing. If price moves above this, it can signal a bullish reversal.
🔸 Why Are They Significant?
Concept LTHB HTLB
Trend Reversal - Break below LTHB → possible bearish reversal Break above HTLB → possible bullish reversal
Swing Confirmation -Holding above LTHB → continuation of uptrend Holding below HTLB → continuation of downtrend
Trap Detection - Stop hunts often occur just below LTHB Stop hunts often occur just above HTLB
Risk Management -Acts as logical stop-loss in long trades Acts as logical stop-loss in short trades
🔸 Uses in Strategy
1. Breakout Traders use these levels as entry triggers.
2. Reversal Traders look for price failing to hold these levels for early reversal signs.
3. Structure-Based Traders use them to confirm higher highs/lower lows.
4. Stop Placement: Tight stops just beyond LTHB/HTLB help manage risk in swing trades.
🔔 How to Set Alerts in TradingView:
Add the script to your chart.
Open the "⚠️ Alerts" tab.
Click "Create Alert".
In the "Condition" dropdown, select one of:
Enter LTHB Zone
Exit LTHB Zone
Enter HTLB Zone
Exit HTLB Zone
Set desired alert frequency (e.g., once per bar or once).
Click Create.

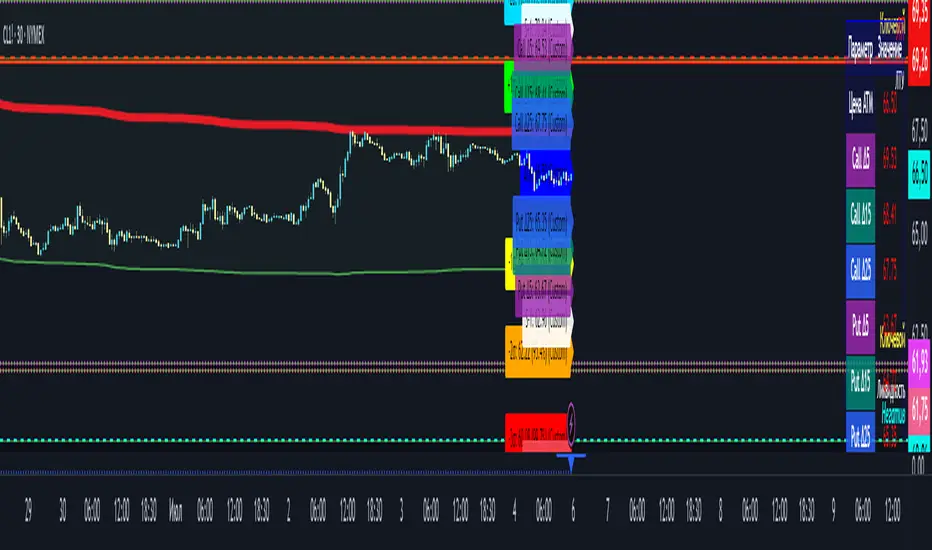
Option Range Projector PRO (with Alerts)Indicator Name: Option Range Projector PRO (with Alerts)
Short Description
This is a powerful and flexible tool for traders that visualizes expected price movement ranges based on option pricing principles and statistical deviations. The indicator plots standard deviation levels (Sigmas) and boundaries calculated from the price of an options Straddle, providing a unique insight into market volatility expectations.
It is ideal for options traders, as well as those who trade futures or spot assets and want to gain an edge by understanding where the market anticipates price boundaries on a specific date.
Core Concepts
The indicator is based on three key ideas:
Standard Deviation (Sigma, σ): In statistics, this is a measure of value dispersion. In trading, when applied to prices, standard deviation levels show the probable range within which the price is expected to remain until a specific date (expiration).
±1σ (1 Sigma): Approximately 68.2% probability that the price will stay within this range.
±2σ (2 Sigmas): Approximately 95.4% probability. These levels often act as strong support/resistance.
±3σ (3 Sigmas): Approximately 99.7% probability. Reaching these levels is a statistically rare event.
Implied Volatility (IV): This is a key component. IV is the market's forecast of the asset's future volatility. It is derived from current option prices and reflects how significant the price movements are expected to be by traders. The higher the IV, the wider the calculated ranges will be.
Straddle-Based Levels: A straddle is an options strategy involving the simultaneous purchase of a Call and a Put option with the same strike price and expiration date. The cost of this combination (Call + Put) directly reflects the market's expected price movement in points. Our indicator uses this value to construct alternative, highly accurate boundaries of the expected range.
Key Features
Flexible Expiration Choice: Easily switch between standard contracts (Weekly, Monthly, Quarterly) or set any custom number of days to expiration (DTE).
Dual Volatility Calculation Mode: Use automatic calculation based on historical data or enter a precise IV value manually (e.g., from your broker's terminal) for maximum accuracy.
Two Types of Predictive Levels: Visualize classic standard deviations (Sigmas) and/or levels calculated from the Straddle price for a comprehensive analysis.
Expiration Comparison: Enable the display of additional levels for a different expiration date to visually compare short-term and long-term market expectations.
"Greeks" Calculation: The indicator calculates and displays key option Greeks (Delta, Gamma, Theta, Vega), helping to deepen the understanding of an option position's characteristics.
Informative Table: All key data—ATM price, IV, DTE, level prices, Greeks, and option prices—are consolidated into one clear table for quick analysis.
Customizable Alerts: Get instant notifications directly in TradingView when the price crosses any of the important levels (±1σ, ±2σ, ±3σ).
Full Visual Customization: Control colors, line thickness, labels, and zone fills to adapt the indicator to your trading style.
How to Use (Settings)
Price Settings:
Auto-detect ATM Price: When enabled, the indicator will use the current closing price as the At-The-Money (ATM) price.
Manual ATM Price: If auto mode is disabled, you can set a precise ATM price manually.
Volatility Settings:
Auto-calculate IV: Calculates historical volatility over a specified period. Useful if you don't have access to real-time IV.
Manual IV Value: (Recommended for accuracy). Enter the Implied Volatility (IV) value for the desired strike from your brokerage terminal or analytical services here.
Expiration:
Contract Type: Choose one of the standard terms (Weekly, Monthly, Quarterly) or "Custom" to use a manual day input.
Days to Expiration: Active only for the "Custom" type.
Show Multiple Expirations: Enables a second set of levels with a different term for comparison.
Straddle Boundaries:
Use Manual Input: Allows you to enter the precise Call and Put Settle prices from the official exchange summary (e.g., from the CME website). This provides the most accurate boundaries based on real market prices.
Trading Ideas and Application
Mean Reversion Trading: The ±2σ and ±3σ levels often act as strong overbought/oversold zones. A price reaching these extreme values has a high statistical probability of reversing or correcting back towards the central ATM price.
Trend Confirmation and Breakouts: A confident close outside the ±1σ range can indicate the beginning of a strong directional move.
Risk Management: Use the levels to set stop-losses or determine profit targets. For example, when opening a trade near the +1σ level, you might consider a target at +2σ and place a stop-loss behind the ATM level.
Volatility Analysis: By comparing the width of the ranges for different expirations, you can assess how the market is pricing short-term versus long-term risks. A narrow range suggests low expectations, while a wide range indicates high ones.
Disclaimer: This indicator is an analysis tool and does not provide direct financial advice or trading signals. All trading decisions are your own. Use this indicator in conjunction with other analysis methods.
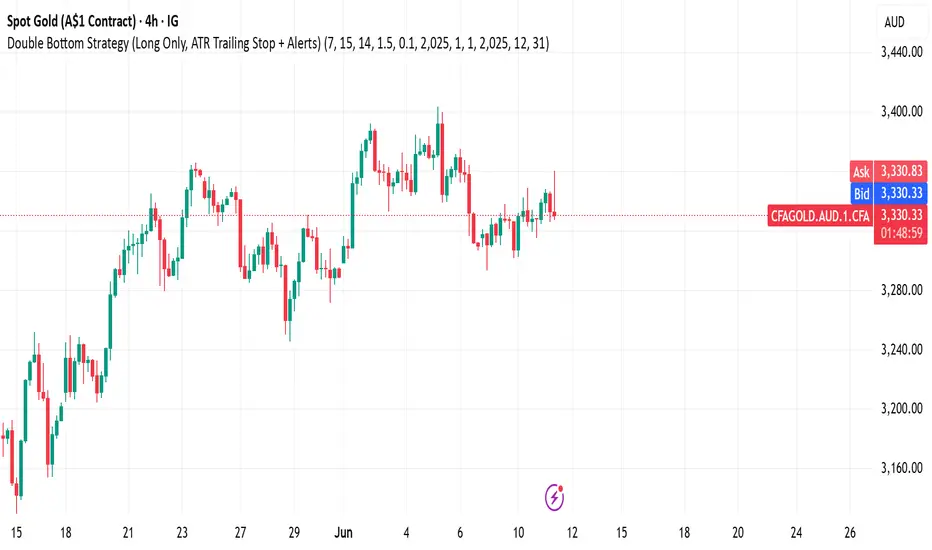
Double Bottom Strategy (Long Only, ATR Trailing Stop + Alerts)This script implements a long-only breakout strategy based on the recognition of a Double Bottom price pattern, enhanced with a 50 EMA trend filter and a dynamic ATR-based trailing stop. It is suitable for traders looking to capture reversals in trending markets using a structured pattern-based entry system.
🧠 Key Features:
Double Bottom Detection: Identifies double bottom structures using pivot lows with configurable tolerance.
ATR-Based Trailing Stop: Manages exits using a trailing stop calculated from Average True Range (ATR), dynamically adjusting to market volatility.
EMA Filter (Optional): Filters trades to only go long when price is above the 50 EMA (trend confirmation).
Alerts: Real-time alerts on entry and exit, formatted in JSON for webhook compatibility.
Backtest Range Controls: Customize historical testing period with start and end dates.
✅ Recommended Markets:
Gold (XAUUSD)
S&P 500 (SPX, ES)
Nasdaq (NDX, NQ)
Stocks (Equities)
⚠️ Not recommended for Forex due to differing behavior and noise levels in currency markets.
🛠️ User Guidance:
Tune the pivot period, tolerance, and ATR settings for best performance on your chosen asset.
Backtest thoroughly over your selected date range to assess historical effectiveness.
Use small position sizes initially to test viability in live or simulated environments.
FVG Zones (Remove Filled) + AlertA powerful TradingView indicator that automatically identifies Fair Value Gap (FVG) zones, removes them once price “fills” the gap, and sends you crystal-clear alerts specifying Bull or Bear zones—so you never miss a market imbalance.
🔍 Key Features
Automatic FVG Detection
Spots three-candle imbalance patterns (low > high for Bull, high < low for Bear) and draws colored boxes on your chart.
Auto-Remove Filled Zones
Once price enters a gap, the corresponding box is deleted—keeping your chart clutter-free.
Dedicated Alerts
Two separate alert conditions with constant messages:
“Price filled Bull FVG zone”
“Price filled Bear FVG zone”
On-Chart Labels
Enable debugging to display Bull FVG or Bear FVG tags above the triggering candle.
Performance-Tuned
Supports up to 500 active zones without slowing down your chart.
⚙️ Inputs & Customization
Show Alert Labels (Boolean) – Toggle on-chart text labels.
Max Boxes Count (Integer) – Control the maximum number of zones displayed.

MTF Trend + Crossover AlertsMulti-Timeframe Trend Dashboard + Crossover Signals
This indicator provides a clean, real-time visual dashboard of trend directions across multiple timeframes (1m, 5m, 15m, 30m, 1H, 4H, 1D), based on moving average crossovers.
🔹 Trend Detection Logic:
When the fast MA is above the slow MA → Bullish trend 🚀
When the fast MA is below the slow MA → Bearish trend 🐻
When both are equal or ranging → Neutral
📊 Dashboard Features:
Displays trend status for each selected timeframe
Color-coded cells (green = bullish, red = bearish, gray = neutral)
Includes emojis for visual clarity
🔔 Buy/Sell Alerts:
On the active chart timeframe, buy and sell signals are plotted when the fast MA crosses above or below the slow MA. You can also enable TradingView alerts based on these events.
🧩 Customizable Inputs:
Fast MA period
Slow MA period
MA type (EMA or SMA)
🔧 Ideal for traders who want a quick snapshot of market structure across multiple timeframes and receive real-time crossover signals on their current chart.

Auto Trend Channel + Buy/Sell AlertsThis indicator automatically detects trend channels using a linear regression line, and dynamically plots upper and lower channel boundaries based on standard deviation. It helps traders identify potential Buy and Sell zones with clear visual signals and customizable alerts.
💡 How It Works:
🧠 Regression-Based Channel: Calculates the central trend line using ta.linreg() over a user-defined length.
📏 Dynamic Boundaries: Upper and lower channel lines are offset by a multiplier of the standard deviation for precision volatility tracking.
✅ Buy Signals: Triggered when price crosses above the lower boundary — potential bounce entry.
❌ Sell Signals: Triggered when price crosses below the upper boundary — potential reversal exit.
🔔 Alerts Enabled: Get real-time alerts when price touches the channel lines.

Buy vs Sell Panel - Volume + % Highlighted + AlertsThis script provides a real-time visual breakdown of estimated Buy vs Sell volume per bar, with intelligent formatting and trend bias detection.
🔹 Features:
📈 Displays Buy and Sell volumes
🔢 Shows percentage (%) of volume in favor
✅ Highlights the dominant side (Buy or Sell)
🎛 Customizable panel position, font size, and update timeframe
🔔 Alerts when Buy or Sell volume exceeds 70% dominance
This panel is ideal for traders who want to:
Confirm trade entries based on volume strength
Visually monitor which side (buyers or sellers) is in control
Get alerted when volume shifts heavily in one direction
🧠 Volume estimation is calculated based on candle structure using directional bias. This helps approximate who is in control even without raw order book access.
🔧 Fully customizable:
Timeframe (1m to Monthly)
Font Size
Panel Location (Top/Bottom Left/Right)
Toggle % display and market bias text
📊 Works with all assets: Stocks, Futures, Forex, and Crypto.

UT Bot Alerts – Time Filtered with ExitsThis indicator combines several technical approaches to generate precise entry and exit signals, while incorporating time filters that ensure signals are sent only during desired time windows and with defined cooldown periods. It is based on the original idea by QuantNomad.
Main Components:
ATR-based Trailing Stop:
Using the Average True Range (ATR) and an adjustable multiplier ("Key Value"), a dynamic trailing stop is calculated that adapts to the current price. This trailing stop forms the basis for the signal generation.
EMA-based Entry Signals:
A very short exponential moving average (EMA, period 1) is used in combination with the trailing stop to identify clear buy (long) and sell (short) signals via crossovers. An additional buffer zone helps reduce false signals.
Persistent Trade State:
The current state (long, short, or neutral) is maintained so that the system remains in the trend until a new signal is generated.
Linear Regression as Reference:
A linear regression line computed over a defined period serves as a reference for determining exit levels.
Exit Signals with Delay:
Exit signals are generated when the price deviates from the linear regression line by a defined percentage (Exit Signal Deviation) and the condition persists for at least a specified number of bars (Exit Signal Delay). Only one exit signal is issued per trade to avoid excessive exits.
Time Filters and Cooldown:
Session Filter: A user-defined session (e.g., "2200-0500") can disable signals during specified periods.
Cooldown Period: After a signal is triggered, a cooldown phase (in minutes) can be set during which no new signals are sent.
Visual Display and Alerts:
Entry Signals: Buy and sell signals are displayed as labels (green for long, red for short).
Exit Signals: Exit signals appear as triangles, with the exit long signal text displayed in white.
Reference Lines:
The upper exit level (Exit Short Level) is drawn as a solid line in turquoise (color.aqua).
The lower exit level (Exit Long Level) is drawn as a solid line in yellow.
Additionally, the ATR trailing stop and the linear regression line are clearly plotted on the chart.
Alerts can be configured for all signal types.
In Summary:
The indicator delivers precise entry signals based on an ATR trailing stop and a short EMA, supplemented by dynamic exit levels determined via linear regression. With integrated time filters (session and cooldown) and a flexible exit mechanism, this indicator offers controlled trade management—ideal for traders who wish to receive signals only during desired time periods.
Original Author: QuantNomad

Auto Fibonacci Extension and Retracement with Visual AlertsThis indicator automatically calculates and plots Fibonacci retracement and extension levels based on recent swing highs and lows, making it a powerful tool for traders who use Fibonacci analysis in their strategies.
Key Features:
• Dynamic Fibonacci Levels: Automatically detects swing highs and lows over a user-defined lookback period to calculate key Fibonacci retracement (e.g., 0.236, 0.382, 0.618, etc.) and extension (e.g., 1.618, 2.618, etc.) levels.
• Visual Alerts: Displays intuitive visual alerts when the price crosses important Fibonacci levels.
• Blue dashed lines for retracement levels.
• Green dashed lines for extension levels.
• Labels with up or down arrows indicating price interactions with these levels.
• Swing High/Low Visualization: Marks recent swing highs and lows with crosses for better clarity.
• Customizable: Adjust the lookback period and Fibonacci levels to suit your trading style.
Who is it for?
This indicator is perfect for:
• Swing Traders: To identify potential reversal or continuation zones.
• Day Traders: For short-term setups based on Fibonacci levels.
• Fibonacci Enthusiasts: To automate the time-consuming process of manually plotting levels.
Usage Ideas:
1. Use retracement levels (e.g., 0.618) to identify areas of potential support or resistance.
2. Use extension levels (e.g., 1.618) to target potential breakout or continuation zones.
3. Combine this indicator with candlestick patterns, volume analysis, or other tools for confirmation.
Limitations:
• This is a standalone indicator and does not provide buy/sell signals. It’s recommended to combine it with other technical analysis tools for best results.
• The lookback period and swing detection rely on past data, so adjustments may be needed based on the asset or timeframe.
Whether you’re looking to streamline your Fibonacci analysis or explore new opportunities in your trading, this indicator is designed to save time, increase accuracy, and enhance your overall trading experience.

Arjo FVG Filtering With Alerts [neo.|]Fair Value Gaps (Also known as FVGs or Imbalances) can be simply described as a three candle pattern, where the second candle's body isn't completely covered by the wicks or body of the second and third candle. These areas represent movements in the market where either buyers or sellers were not able to get involved due to price in the form of wicks not revisiting those levels, and instead moving away from them.
As a result, they can be seen as potential areas of continuation given that price may want to continue in it's direction after it revisits them and offers Fair Value, since previously it made sharp moves away from those areas.
However what is important to note, and what FVG Filtering aims to address, is that there are three notable types of FVGs as described by Arjo, which are Perfect FVGs denoted as FVGp on the indicator and chart below, Expansion (FVGe), and Reversal (FVGr). As the names imply, they each serve different purposes with the FVGp being the likeliest to hold on mitigation, expansion meaning price is likely to not retrace into the FVG and reversal being the least likely for the FVG to hold.
The indicator is the first that automatically determines which one of the three underlying FVG types any particular FVG is, that way you can quickly make informed decisions based on the type of FVG you see appear on the chart.
As you may notice, the type depends primarily on the third candle, which demonstrates the true strength of any particular FVG, and is how the filtering occurs on this indicator, which compares the sizes of the second and third candle's bodies, in order to classify the FVG candle sequence as one of the three aforementioned types.
Color Options:
FVG Colors: Change the color of any bullish or bearish FVG type to easily distinguish between them.
Mitigated FVG Color: Apply colors to mitigated FVGs in order to avoid using ones that are no longer valid.
Text Color: Change the color of the text within the FVG to your liking.
Further styling options:
How many FVGs you want to be displayed: Changes the amount of FVGs displayed on your chart by limiting each type of FVG to the number you select.
How far you want the FVGs to extend: Modify the amount of bars forward that the FVG stretches out after it's inception.
Table options:
Show table: Display a table that will give you insights on how many FVGs were created of each type and what % they represent of the total.
Table text color: Modify the color of the text within the table.
Table border color: Modify the color of the border of the table.
Alerts:
Freely set alerts for any type of FVG you would like to see.

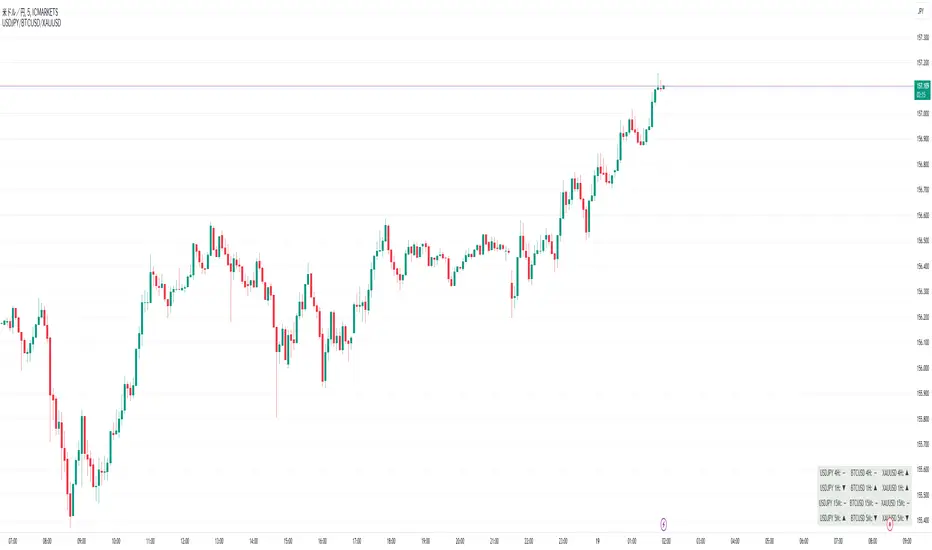
Perfect Order Alert USDJPY/BTCUSD/XAUUSDPerfect Order Alert USDJPY/BTCUSD/XAUUSD 日本語解説は下記
This indicator detects the perfect order of three moving averages and displays on the Panel in an easy-to-understand visual manner whether there is an uptrend, downtrend, or non-trend for each time leg.
This indicator detects perfect orders for the three currency pairs USDJPY/BTCUSD/XAUUSD on the 5-minute, 15-minute, 1-hour, and 4-hour time frames, and displays them on the Panel on the chart, with “▲” for up, “▼” for down, and “ー” for non-trend, so that you can quickly determine the trend. The panel is displayed on the chart.
In order to check for perfect orders without missing them, it is also possible to set up alerts that notify you of all the time frames and currency pairs as well.
Functions
Displaying 4H, 1H, 15M, 5M, up (▲), down (▼), other (-), of USDJPY/BTCUSD/XAUUSD on the panel.
*(By default, 20EMA, 75EMA, and 200EMA are hidden.)
Display position setting of the panel (You can choose from upper left, upper top, upper right, lower left, lower bottom, or lower right).
Panel color and text color change function
The moving average line can be hidden by default.
Moving average period change
Moving average color and thickness can be changed.
EMA/SMA switchable
Alert function - One alert can be set for each currency pair and time frame ▲▼, which is very useful.
Perfect Order Alert
You can use it even if you have a free account with only one alert setting.
To use the alert function, go to the Tradingview default alert settings, select “USDJPY/BTCUSD/XAUUSD” for the top item of conditions, and select “Call Alert() function” in the frame just below it!
_* Supplementary explanation: ____________
Please note that due to the limitation of the script, only 3 currency pairs and 4 time frames are displayed with 12 items (Panels for currency pairs other than USDJPY/BTCUSD/XAUUSD are also created, but they are indicators for other scripts, so if you are interested in other currency pairs, please use those. If you are interested in other currency pairs, please use them.)
Please note that we may change the functions or delete the indicator itself without prior notice.
Translated with DeepL.com (free version)
Reference image of the setting screenReference image of the setting screen
設定画面参考画像
3本の移動平均線のパーフェクトオーダーを検知し、時間足ごとに上昇トレンドか下降トレンドかノントレンドかを視覚的にわかりやすくPanelに表示するインジゲーターです。
このインジゲーターは、USDJPY/BTCUSD/XAUUSDの3通貨ペアの5分足、15分足、1時間足、4時間足のパーフェクトオーダーを検知して、チャートに表示されるPanelに、上昇は「▲」下降は「▼」ノントレンドは「ー」と、すぐに判断できる表示にしてあります。
パーフェクトオーダーを逃さずチェックできるように、それぞれの時間足や通貨ペアも全てを通知してくれるアラート設定が可能なのも特徴です。
機能紹介
・USDJPY/BTCUSD/XAUUSDの4H,1H,15M,5M,の上昇(▲),下降(▼),その他(-),をパネルに表示
※(デフォルトでは20EMA,75EMA,200EMAの3本で非表示にしてあります)
・パネルの表示位置設定(左上、上、右上、左下、下、右下、から選択できます。)
・パネルの色とテキスト色変更機能
・移動平均線表示非表示機能(デフォルトでは表示OFFにしてあります。)
・移動平均線期間変更
・移動平均線色と太さ変更
・EMA/SMA切り替え可能
・アラート機能ー1つのアラート設定で通貨ペアと時間足▲▼一つ一つを細かく教えてくれるので便利。
※パーフェクト オーダーアラート
無料アカウントで1つしかアラート設定できなくても使えます。
アラート機能はTradingviewデフォルトのアラート設定から、条件の一番上の項目を「USDJPY/BTCUSD/XAUUSD」選択、そのすぐ下の枠に「Alert()関数の呼び出し」を選択でOK!
_※ 補足説明____________
・スクリプトの制限の為、3通貨ペアと4つの時間足の12項目で表示させていますのでご了承ください
(USDJPY/BTCUSD/XAUUSD以外の通貨ペアのPanelも作成していますが別スクリプトのインジゲーターになりますので他の通貨ペアも興味がある方はそちらをお使いください)
・予告なしで機能の変更やインジゲーター自体の削除等行う事もあるかもなのでご了承ください。
Order Blocks & Breaker Blocks [TradingFinder] Signals + Alerts🔵 Introduction
Order Block and Breaker Block, are powerful tools in technical analysis. By understanding these concepts, traders can enhance their ability to predict potential price reversals and continuations, leading to more effective trading strategies.
Using historical price action, volume analysis, and candlestick patterns, traders can identify key areas where institutional activities influence market movements.
🟣 Demand Order Block and Supply Breaker Block
Demand Order Block : A Demand Order Block is formed when the price succeeds in breaking the previous high pivot.
Supply Breaker Block : A Supply Breaker Block is formed when the price succeeds in breaking the Demand Order Block. As a result, the Order Block changes its role and turns from the role of price support to resistance.
🟣 Supply Order Block and Demand Breaker Block
Supply Order Block : A Supply Order Block is formed when the price succeeds in breaking the previous low pivot.
Demand Breaker Block : A Demand Breaker Block is formed when the price succeeds in breaking the Supply Order Block. As a result, the Order Block changes its role and turns from the role of price resistance to support.
🔵 How to Use
🟣 Order Blocks (Supply and Demand)
Order blocks are zones where the likelihood of a price reversal is higher. In demand zones, buying opportunities arise, while in supply zones, selling opportunities can be explored.
The "Refinement" feature allows you to adjust the width of the order block to fit your trading strategy. There are two modes in the "Order Block Refine" feature: "Aggressive" and "Defensive." The primary difference between these modes is the width of the order block.
For risk-averse traders, the "Defensive" mode is ideal as it offers a lower loss limit and a higher reward-to-risk ratio.
Conversely, for traders who are willing to take more risks, the "Aggressive" mode is more suitable. This mode, with its wider order block width, caters to those who prefer entering trades at higher prices.
🟣 Breaker Blocks (Supply and Demand)
Trading based on breaker blocks is the same as order blocks and the price in these zones is likely to be reversed.
🔵 Setting
🟣 Global Setting
Pivot Period of Order Blocks Detector : Enter the desired pivot period to identify the Order Block.
Order Block Validity Period (Bar) : You can specify the maximum time the Order Block remains valid based on the number of candles from the origin.
Mitigation Level Order Block : Determining the basic level of a Order Block. When the price hits the basic level, the Order Block due to mitigation.
Mitigation Level Breaker Block : Determining the basic level of a Breaker Block. When the price hits the basic level, the Breaker Block due to mitigation.
Switching Colors Theme Mode : Three modes "Off", "Light" and "Dark" are included in this parameter. "Light" mode is for color adjustment for use in "Light Mode".
"Dark" mode is for color adjustment for use in "Dark Mode" and "Off" mode turns off the color adjustment function and the input color to the function is the same as the output color.
🟣 Order Block Display
Show All Order Block : If it is turned off, only the last Order Block will be displayed.
Demand Main Order Block : Show or not show and specify color.
Demand Sub (Propulsion & BoS Origin) Order Block : Show or not show and specify color.
Supply Main Order Block : Show or not show and specify color.
Supply Sub (Propulsion & BoS Origin) Order Block : Show or not show and specify color.
🟣 Breaker Block Display
Show All Breaker Block : If it is turned off, only the last Breaker Block will be displayed.
Demand Main Breaker Block : Show or not show and specify color.
Demand Sub (Propulsion & BoS Origin) Breaker Block : Show or not show and specify color.
Supply Main Breaker Block : Show or not show and specify color.
Supply Sub (Propulsion & BoS Origin) Breaker Block : Show or not show and specify color.
🟣 Order Block Refinement
Refine Order Blocks : Enable or disable the refinement feature. Mode selection.
🟣 Alert
Alert Name : The name of the alert you receive.
Alert Demand OB Mitigation :
On / Off
Alert Demand BB Mitigation :
On / Off
Alert Supply OB Mitigation :
On / Off
Alert Supply BB Mitigation :
On / Off
Message Frequency :
This string parameter defines the announcement frequency. Choices include: "All" (activates the alert every time the function is called), "Once Per Bar" (activates the alert only on the first call within the bar), and "Once Per Bar Close" (the alert is activated only by a call at the last script execution of the real-time bar upon closing). The default setting is "Once per Bar".
Show Alert Time by Time Zone :
The date, hour, and minute you receive in alert messages can be based on any time zone you choose. For example, if you want New York time, you should enter "UTC-4". This input is set to the time zone "UTC" by default.
Display More Info :
Displays information about the price range of the order blocks (Zone Price) and the date, hour, and minute under "Display More Info".
If you do not want this information to appear in the received message along with the alert, you should set it to "Off".

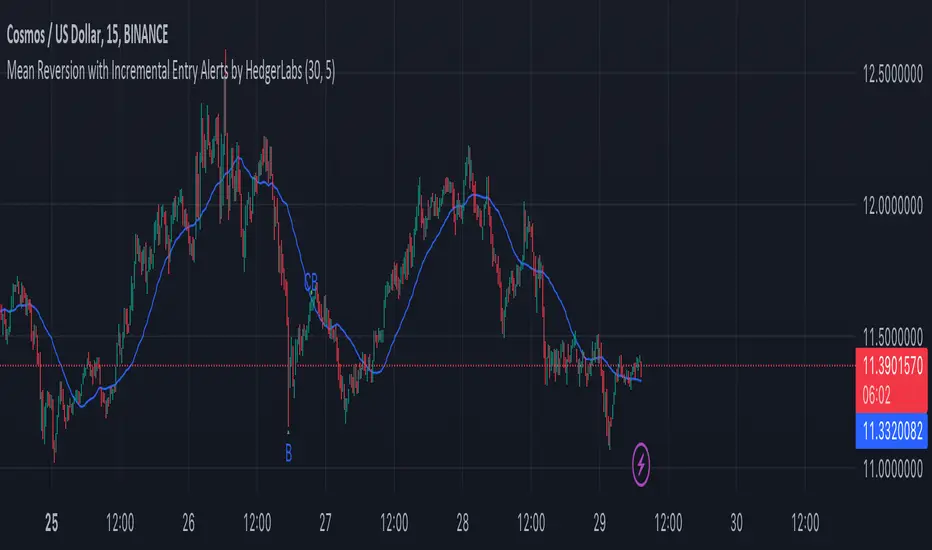
Mean Reversion with Incremental Entry Alerts by HedgerLabsThe "Mean Reversion with Incremental Entry Alerts" is a sophisticated TradingView indicator designed by HedgerLabs. It's built on the concept of mean reversion, a fundamental trading strategy in financial markets. This indicator is tailored for traders seeking systematic and disciplined entry points in volatile markets.
Key Features:
Moving Average (MA) Based: At its core, the indicator utilizes a simple moving average (SMA) as the baseline for mean reversion. You can customize the length of the MA according to your trading style.
Initial Entry Conditions: The script generates initial buy and sell alerts based on a defined percentage deviation from the moving average. This approach allows traders to enter trades at points where the price significantly deviates from its mean, potentially signaling a reversion opportunity.
Buy and Sell Signals: Clear visual cues are provided for buy and sell positions, making it easy to interpret and act upon the signals.
Close Conditions: In addition to entry signals, the indicator also plots closing signals (green and red crosses) when the price touches the moving average. This feature assists in timely exits from positions, aiming to optimize trade outcomes.
Alert System: Integrated alert conditions notify you when a new buy or sell order condition is met, as well as when to close existing positions. This ensures you never miss an opportunity or an exit point.
Usage Scenario:
This indicator is particularly useful in markets where prices tend to revert to a mean value over time. It's ideal for day traders who focus on asset price volatility.
Disclaimer:
Please note that this tool is for informational and educational purposes only and should not be considered as financial or investment advice. Trading involves substantial risk, including the potential loss of principal. We recommend conducting your research and consulting with a financial expert before making any investment decisions.
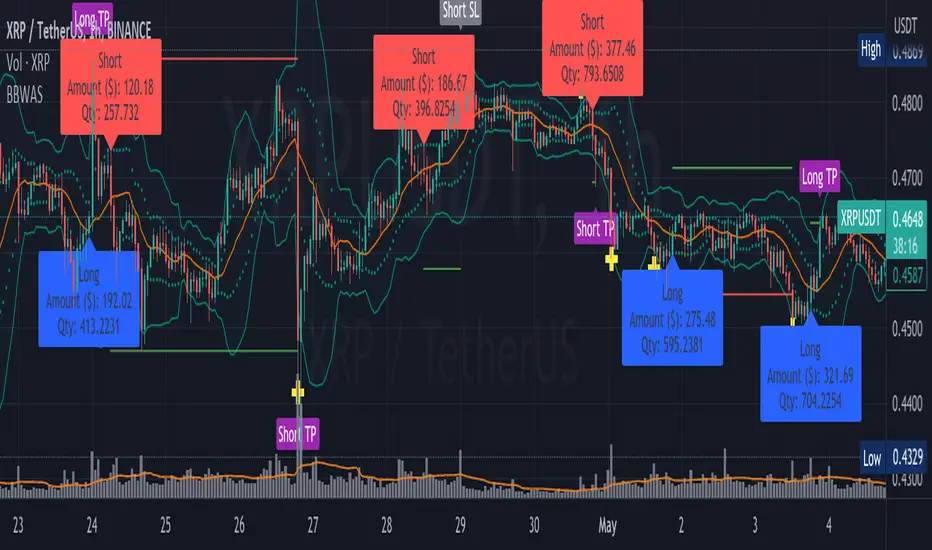
BBWAS Enhanced with Webhook Alerts and Money ManagementThe Enhanced BBWAS Indicator is a powerful tool designed to identify breakouts in the price of a security or asset. It utilizes Bollinger Bands, which consist of three lines: the upper band, the lower band, and the middle band (or basis). These bands help define the expected price range within which the asset is likely to fluctuate.
When the price breaks above the upper band or below the lower band, it indicates a potential breakout. A bullish breakout occurs when the price closes above the upper band, while a bearish breakout occurs when the price closes below the lower band.
In this enhanced version of the indicator, several new features have been added to provide more flexibility and functionality:
Webhook Alerts: Traders now have the ability to configure webhook alerts to trigger a bot or any external system. This allows for timely notifications when a breakout occurs, enabling automated actions or manual intervention as desired.
Multiple Moving Average Types: The indicator now supports different types of moving averages for increased customization. Traders can choose from popular moving average types such as Simple Moving Average (SMA), Exponential Moving Average (EMA) and Weighted Moving Average (WMA). This enables users to experiment and find the moving average type that best suits their trading strategy.
Money Management: To assist traders in managing risk, a money management feature has been incorporated into the indicator. It calculates the optimal position size or number of units to purchase for each trade, considering the desired risk per trade. By specifying a maximum risk per trade, traders can ensure that their position sizes are adjusted accordingly, helping to maintain risk control in their trading activities.
Dear traders, while we strive to provide you with the best trading tools and resources, we want to remind you to exercise caution and diligence in your investing decisions.
It is important to always do your own research and analysis before making any trades. Remember, the responsibility for your investments ultimately lies with you.
Happy trading!
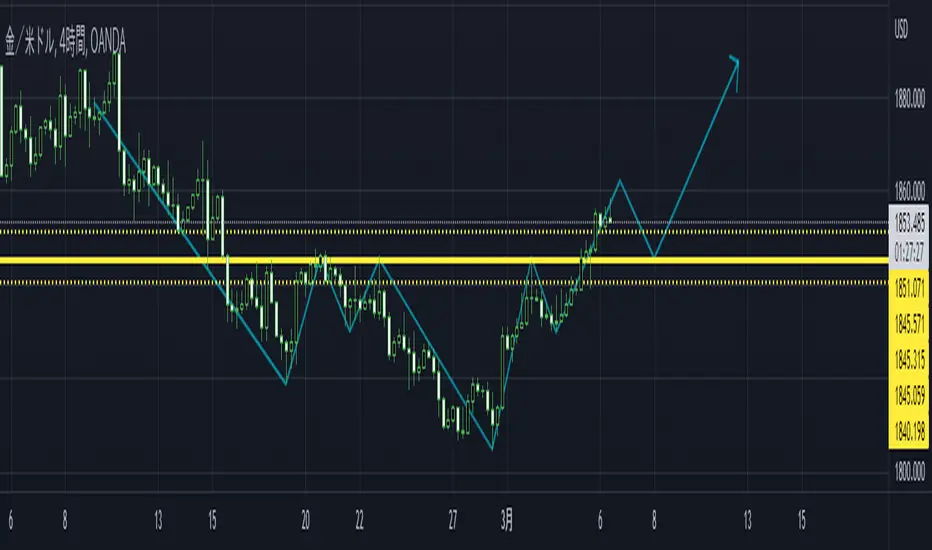
Role Reversal Detection Alert [MsF]Japanese below / 日本語説明は英文の後にあります。
-------------------------
When you draw a horizontal line on the W top or W bottom and be waiting for roll reversal, have you ever missed it when it rebounded at the horizontal line? It is a helpful indicator to prevent such oversight.
After the candle touches the horizontal line (including the touch of the leg), and then the candle body passes the alert judgment horizontal line, it will be alert.
The horizon line and the alert judment horizon line should be entered as parameters.
- Parameter
Input Horizontal Value: Enter the horizontal value
Band Range by pips : Enter the offset from horizontal line by pips
-------------------------
WトップやWボトムに水平線を引いてロールリバーサルを待ってる時に見事水平線で反発したのに見逃すことはありませんか?
そんな見落としを防止するためのお助け的なインジケーターです。
メイン水平線にローソク(ひげ含む)タッチ後、からアラート判定水平線を実体で抜けた場合にアラートを発報します。
メイン水平線とアラート判定水平線はそれぞれパラメータで入力する必要があります。
<パラメータ>
Input Horizontal Value:メイン水平線の価格を入力します
Band Range by pips :メイン水平線からアラート判定水平線のオフセットをpipsで入力します
RSI Multi Length With Divergence Alert [Skiploss]This is a modified indicator base code from RSI Multi Length and we will add some of functions by finding a classic/hidden divergence and alert.
The indicator returns information over RSI using multiple periods and calculates the percentage of overbought and oversold by overbought divided by oversold.
To find the divergence and hidden divergence we use base code from platform (Divergence Indicator) but change the input from normal to the average (RSI Multi Length).
RSI Settings
Maximum Length is maximum period.
Minimum Length is minimum period.
Overbought Level is value of the overbought level .
Oversold Level is value of the oversold level.
Source is input source of the indicator.
Divergence Settings
Pivot Right is value look back to the right side.
Pivot Left is value look back to the left side.
Max Range is maximum range value.
Min Range is minimum range value.
Alert Settings
It will be part of display of Divergence and Hidden Divergence.
Style Settings
Color of overbought/oversold/Bullish/Bearish which you can change as you wish.

Miyagi (10 in 1) + AlertsMiyagi: The attempt at mastering something for the best results.
Miyagi indicators combine multiple trigger conditions and place them in one toolbox for traders to easily use, produce alerts, backtest, reduce risk and increase profitability.
VWAP has been the main condition for entry for our trading community for quite some time now, however using VWAP alone can lead to poor entries and bags.
Miyagi adds filtering conditions which can then be used to improve entries as opposed to simply using VWAP alone.
Miyagi (10-in-1) + Alerts combines multiple trigger conditions in an easy to use format.
Each trigger or filtering condition is selectable and able to be combined using the selector checkboxes.
Trigger or filter conditions can be used on a different timeframe chart than the current user selected chart.
For instance, the user's chart can be set to a 15M for entry however using filtering from a 30 minute RSI.
It is recommended to not use a lower timeframe chart setting than the current chart timeframe.
The following trigger and filter conditions are present in the 10-in-1:
EMA: Takes two "Exponential Moving Averages" into effect for filtering with user selectable chart timeframe, length and sources.
EMA Trend Type is user selectable for Trend-following or Counter-trend which allows you to counter-trade the markets.
Beside the "Simple Moving Average" the EMA has a multiplier.
Calculation is SMAxMultipier / SMAxMultiplier of the previous candle.
MACD: Takes the "Moving Average Convergence Divergence" into effect for trigger condition or filtering with user selectable chart timeframe,
source, fast & slow length and signal smoothing. MACD is a trend-following momentum indicator that shows the relationship between two moving averages of a price.
The MACD is calculated by subtracting the EMA 26 period from the EMA 12. Long alert is triggered on crossing the MACD zero line upwards and short alert vise versa.
RSI: Takes the "Relative Stregth Index" into effect for trigger condition or filtering with user selectable chart timeframe, length, source, and oversold and overbought values.
The RSI is a technical oscillator that uses price and volume data for identifying overbought or oversold signals in an asset.
It can also be used to spot divergences which warn of a trend change in price. This oscillator moves between 0 and 100.
RSI > 80 is considered overbought and an RSI < 20 is considered oversold.
Stochastic RSI: oscillator version of RSI.
Takes the stochRSI into effect for trigger condition or filtering with user selectable chart timeframe, K D, length, upper and lower length.
stochRSI = (actual RSI - lowest RSI) / (highest RSI - lowest RSI)
VWAP: Takes the "Volume Weighted Average Price" into effect for trigger condition with user selectable chart timeframe, period, and VWAP lower line (long),
or VWAP Upper line (Short) values. VWAP is calculated by totaling the money traded for every transaction (price x volume) and then dividing by the total shares traded.
The VWAP appears as a single line on charts. It looks similar to a moving average line, but smoother. In general it is a intraday/week anchored indicator that resets,
but we are using a steady version over a selectable period of candles.
TTM: Takes the TTM squeeze indicator into effect for trigger condition with user selectable chart timeframe, length, multiplier, smoothing and trend direction.
The TTM is used to identify when to enter or exit a market for the best chance of profitability. It squeezes pairs well with other indicators, such as the ADX indicator.
For Multiplicator you can use Keltner and Boilinger Bands.
ADX: Takes the "Average Directional Movement Index" into effect for trigger condition with user selectable chart timeframe, smoothing, DI-length, a long and a short setting.
The ADX is used to detect trend direction with a positive and a negative direction indicator (+DI & -DI). The factor of those is a value between 0 and 100.
A low value can be a week trend or consolidation. A value > 25 is considered as a positive trend, >50 is a strong long trend >75 extremely strong trend.
Beside timeframe, you can choose smoothing and DI length.
SuperTrend: Takes the SuperTrend into effect for filtering with user selectable chart timeframe, ATR length and factor.
As an alternative to moving averages you can keep a fix distance to determine long or short trend.
That way you can avoid a lot of switching during a consolidation phase. Once crossed it switches trend direction.
The "Average True Rage" is used for calculation of the SuperTrend distance, it measures the volatility of the coin.
MFI: Takes the "Money Flow Index" into effect for filtering with user selectable chart timeframe, length, source, long and short settings.
The MFI is a technical oscillator that uses price and volume data for identifying overbought or oversold signals in an asset.
It can also be used to spot divergences which warn of a trend change in price. Like RSI this oscillator moves between 0 and 100.
MFI > 80 is considered overbought and an MFI < 20 is considered oversold.
W-Divergence: Takes the "Wolfpack Divergence" into effect for trigger condition with user selectable chart timeframe, length, lookback, divergence and ranges.
W-Divergence is MACD 3-8 setting with added divergence hunter.
How to use: Select the VWAP, and set the VWAP up as you would normally trade with your selected timeframe, period, and VWAP settings (long and short).
All entries will be shown, based on the VWAP settings.
From here, filtering can be implemented to produce better entries, ie using EMA/MACD/RSI/SuperTrend/MFI filtering.
Happy Trading!

ATR alerts & backtestingThe Basics
Alert will trigger if the current (real time) price surpasses the high of the ATR of the previous bar. (can also be set for the Low of the ATR). Each time the follow up candle surpasses the high of the previous ATR, the background will be coloured orange. This makes back testing easier on the eye. This can be turned off.
- Colours can be changed.
- Can also set a color and alert when the current price surpasses the Low of the ATR of the previous bar.
- ATR distance can be changed.
- Can be used on different chart types.
- Can be used as entry or exits in combination with bots.
- Can display only ATR top or bottom or both.
Example
An alert will trigger if the price of the current bar surpasses the red dot (ATR) of the previous bar.
Alerts can be created on all timeframes, if this is within your Tradingview plan.
Final Words
Disclaimer: Please use it with care and at own risk. The owner of this indicator is not liable for any financial losses.
Past performance is no guarantee of future returns.

STD Stepped Ehlers Optimal Tracking Filter MTF w/ Alerts [Loxx]STD Stepped Ehlers Optimal Tracking Filter MTF w/ Alerts is the traditional Ehlers Optimal Tracking Filter but with stepped price levels, access to multiple time frames, and alerts.
What is Ehlers Optimal Tracking Filter?
From "OPTIMAL TRACKING FILTERS" by John Ehlers:
"Dr. R.E. Kalman introduced his concept of optimum estimation in 1960. Since that time, his technique has proven to be a powerful and practical tool. The approach is particularly well suited for optimizing the performance of modern terrestrial and space navigation systems. Many traders not directly involved in system analysis have heard about Kalman filtering and have expressed an interest in learning more about it for market applications. Although attempts have been made to provide simple, intuitive explanations, none has been completely successful. Almost without exception, descriptions have become mired in the jargon and state-space notation of the “cult”.
Surprisingly, in spite of the obscure-looking mathematics (the most impenetrable of which can be found in Dr. Kalman’s original paper), Kalman filtering is a fairly direct and simple concept. In the spirit of being pragmatic, we will not deal with the full-blown matrix equations in this description and we will be less than rigorous in the application to trading. Rigorous application requires knowledge of the probability distributions of the statistics. Nonetheless we end with practically useful results. We will depart from the classical approach by working backwards from Exponential Moving Averages. In this process, we introduce a way to create a nearly zero lag moving average. From there, we will use the concept of a Tracking Index that optimizes the filter tracking for the given uncertainty in price movement and the uncertainty in our ability to measure it."
Included:
-Standard deviation stepping filter, price is required to exceed XX deviations before the moving average line shifts direction
-Selection of filtering based on source price, the moving average, or both; you can also set the Filter deviations to 0 for no filtering at all
-Toggle on/off bar coloring
-Toggle on/off signals
-Long/Short alerts

Any 8 Moving Averages - Alerts, Clouds & PercentagesANY 8 MOVING AVERAGES WITH ALERTS, COLOR CHANGING CLOUDS AND PERCENTAGE GAPS
This is a fully customizable moving average cloud with alerts. It has 8 moving averages that can be individually set to any type such as: EMA, SMA, HMA, WMA, VWMA & RMA. Each moving average paints green when price is above it and paints red when price is below it. They include colored clouds between the price and each moving average as well.
You can individually change the length, colors, type of moving average and turn them off for those of you that only want a few moving averages on your chart at once.
There is also a percentage gap table that tells you how far away the price is from each moving average which are labeled accordingly.
You can also set alerts for when price crosses each moving average.
***HOW TO USE***
When all the moving averages are green, buy dips down to the next lower moving average. When all the moving averages are red, short the tops up to the next moving average.
Trade in the direction of the trend and wait for all lines to turn one color before taking trades in that direction.
Make sure there is a big enough percentage gap to the next moving average before taking a trade.
***MARKETS***
This indicator can be used as a signal on all markets, including stocks, crypto, futures and forex.
***TIMEFRAMES***
This moving average can be used on all timeframes.
***TIPS***
Try using numerous indicators of ours on your chart so you can instantly see the bullish or bearish trend of multiple indicators in real time without having to analyze the data. Some of our favorites are our Auto Fibonacci, Directional Movement Index + Fisher Price Action, Volume Profile With Buy & Sell Pressure, Auto Support And Resistance and Money Flow Index in combination with this moving average cloud. They all have unique features to help you make better and faster trading decisions.
