Volume High Alert by ToledoCandelariaThis custom TradingView indicator visualizes volume activity by plotting colored boxes under each bar, highlighting different volume levels relative to a moving average. It helps traders identify significant volume spikes or drops, which can signal potential market moves or reversals.Key Features:Volume Analysis: The indicator compares the current bar's volume to a user-defined Simple Moving Average (SMA) of volume, calculated over a customizable period (default: 30 bars).
Color-Coded Boxes: Each bar is represented by a box with a color indicating its volume strength:Purple: Ultra-high volume (exceeds the SMA by a user-set multiplier, default: 2.0x).
Yellow: High volume (exceeds the SMA by a smaller multiplier, default: 1.5x, but below ultra-high).
Blue: Low volume (below the SMA by a user-set multiplier, default: 0.5x).
Green: Normal volume (falls within the defined thresholds).
Customizable Settings:Adjust the SMA length to fine-tune the volume baseline.
Modify the multipliers for ultra-high, high, and low volume thresholds.
Set the width of the boxes (in bars) for visual clarity.
Limit the number of displayed boxes (default: 500) to manage chart performance.
Alerts: The indicator includes an alert condition that triggers when a high-volume (yellow) bar is detected, allowing traders to stay informed of significant volume spikes in real-time.
How to Use:
Add the indicator to your TradingView chart (not as an overlay) and adjust the input settings to match your trading strategy. Watch for purple and yellow boxes to spot potential breakout or reversal signals, and use blue boxes to identify periods of low activity. Enable the alert to receive notifications for high-volume bars.This indicator is ideal for traders looking to monitor volume surges and lulls, providing a clear visual representation of market activity directly on the chart.
I hope that helps!
by Excalibur
Cerca negli script per "alert"

MF Logarithmic Log Trendline with Alerts by MigueFinanceWhat is Unique on This Indicator?
It allows you to set alerts for logarithmic trendlines including cross and touches and it works!
Not even tradingview has alerts for drawn logarithmic trendlines !
When on Logaritmic scale it looks like a normal trendline but when on the linear scale it looks like a real logarithmic curve!
And is free to use!
Overview
Finally an Indicator that has alerts/alarms that works with Logarithmic trendlines!
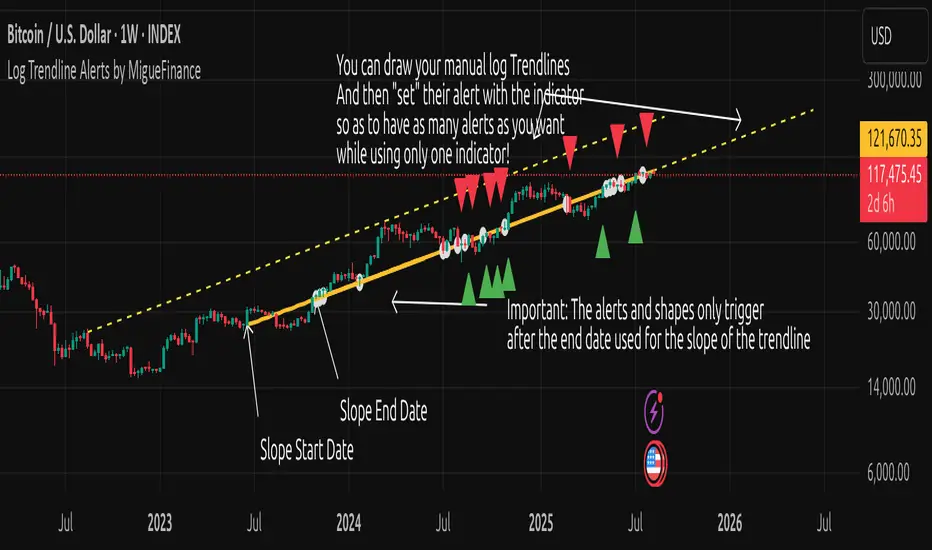
A- This indicator plots a customizable logarithmic (or linear) trendline based on user-defined start/end dates, extending forward to highlight support/resistance.
B- It shows green upward triangles for bullish breakouts and red downward triangles for bearish breakdowns or dots for touches that are not effective crosses of the trendline
C- It is also possible to set alert conditions with custom message for helping to trade the signals above/bellow the trendline
How to Use
1. Apply indicator to chart.
2. Adjust inputs: log/linear, price source, start/end dates, custom prices , label/triangle visibility.
3. Setting -1 for the price source adjusts the trendline automatically to the height of the chart for the specified date based on high, low, close or open of the candle for that date.
4. Watch for triangle signals on bar close.
5. Set alerts for breakouts/breakdowns or touches via TradingView.
Multiple Logarithmic Trendlines are possible!
You can put many logarithmic trendlines in your chart with alerts!, just as many as many alerts your current tradingview plan allows you to.
How to?
- Just use this indicator, get the logaritmic trendline you desire, set the alert, make sure is well set, and after setting the alert draw yourself on tradingview the logarithmic trendline that you are setting the alarm to (a new manual drawing).
- Then modify the settings of your indicator to create a new trendline, the previous one exists even if not visible as long as you have correctly set the alert, and if you did a drawing you can see your previous alert trendline.
Custom Messages on Alerts
- There are different options for the alerts, the one named "Any alert() function call" allows you to put custom messages that could be used on platforms like Wundertrade in order to set and execute automatic trades on buy/sell.
- The other options for the alerts give you fix messages and allows you to decide if get you an alert on a cross over or under or on a touch of the trendline.
Notes
- Signals on confirmed closes (no repainting).
- Designed for log-scaled charts but also works on linear charts.
- Tested on stocks, crypto, and more.
- Make sure that this indicator and your plotted chart are on the same scale, otherwise will look like floating, will move and would seem like it does not matches the chart.
Important Note
- The alerts and shapes only trigger after the "End Date" of the slope, not before or between them
You are welcome to follow me on my socials!
MigueFinance.
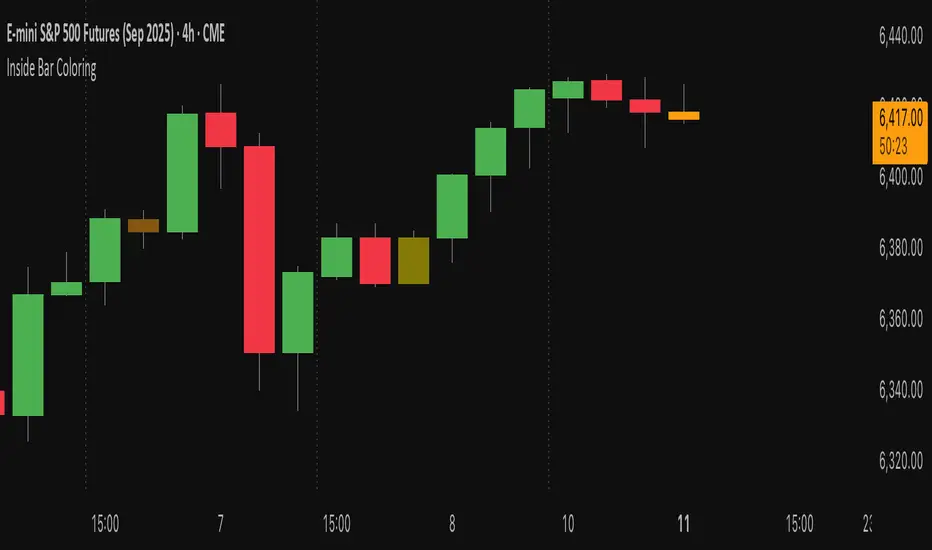
Inside Bar Coloring (Real-time + Historical) w/ AlertsDescription
This Pine Script v6 indicator identifies and colors inside bars, whose entire range (high and low) stays within the previous bar's range. It gives the option to color the real-time bar as well as historical inside bars.
Inside bars are colored differently based on whether they close above or below their opening price (bullish vs bearish). The indicator offers flexible display options including real-time-only highlighting, historical inside bar visualization with transparency, and optional triangle markers for enhanced visibility.
Utility
Inside bars represent periods of market consolidation and reduced volatility, and are by nature consolidating. During this equilibrium, it can be valuable to observe price development rather than engage with it. Conversely, a break of the equilibrium often marks a shift in volatility and provides opportunity. This indicator provides instant visual identification of this price action on your chart.
Features
Smart Coloring System: Separate colors for bullish (close ≥ open) and bearish (close < open) inside bars
Flexible Display Modes: Show only real-time bar, all historical bars, or customize transparency levels
Visual Markers: Optional triangles above or below inside bars
Real-time Alerts: Configurable alerts notify you when new inside bars form
Optimized Performance: Efficient Pine Script v6 code with minimal resource usage
Open Source: Released under Mozilla Public License 2.0
Settings
Customizable colors for bullish/bearish inside bars (real-time and historical)
Toggle historical inside bar display
Real-time bar only mode for clean charts
Adjustable marker position (above/below bars)
Alert activation with detailed price information
Auto AI Trendlines [TradingFinder] Clustering & Filtering Trends🔵 Introduction
Auto AI trendlines Clustering & Filtering Trends Indicator, draws a variety of trendlines. This auto plotting trendline indicator plots precise trendlines and regression lines, capturing trend dynamics.
Trendline trading is the strongest strategy in the financial market.
Regression lines, unlike trendlines, use statistical fitting to smooth price data, revealing trend slopes. Trendlines connect confirmed pivots, ensuring structural accuracy. Regression lines adapt dynamically.
The indicator’s ascending trendlines mark bullish pivots, while descending ones signal bearish trends. Regression lines extend in steps, reflecting momentum shifts. As the trend is your friend, this tool aligns traders with market flow.
Pivot-based trendlines remain fixed once confirmed, offering reliable support and resistance zones. Regression lines, adjusting to price changes, highlight short-term trend paths. Both are vital for traders across asset classes.
🔵 How to Use
There are four line types that are seen in the image below; Precise uptrend (green) and downtrend (red) lines connect exact price extremes, while Pivot-based uptrend and downtrend lines use significant swing points, both remaining static once formed.
🟣 Precise Trendlines
Trendlines only form after pivot points are confirmed, ensuring reliability. This reduces false signals in choppy markets. Regression lines complement with real-time updates.
The indicator always draws two precise trendlines on confirmed pivot points, one ascending and one descending. These are colored distinctly to mark bullish and bearish trends. They remain fixed, serving as structural anchors.
🟣 Dynamic Regression Lines
Regression lines, adjusting dynamically with price, reflect the latest trend slope for real-time analysis. Use these to identify trend direction and potential reversals.
Regression lines, updated dynamically, reflect real-time price trends and extend in steps. Ascending lines are green, descending ones orange, with shades differing from trendlines. This aids visual distinction.
🟣 Bearish Chart
A Bullish State emerges when uptrend lines outweigh or match downtrend lines, with recent upward momentum signaling a potential rise. Check the trend count in the state table to confirm, using it to plan long positions.
🟣 Bullish Chart
A Bearish State is indicated when downtrend lines dominate or equal uptrend lines, with recent downward moves suggesting a potential drop. Review the state table’s trend count to verify, guiding short position entries. The indicator reflects this shift for strategic planning.
🟣 Alarm
Set alerts for state changes to stay informed of Bullish or Bearish shifts without constant monitoring. For example, a transition to Bullish State may signal a buying opportunity. Toggle alerts On or Off in the settings.
🟣 Market Status
A table summarizes the chart’s status, showing counts of ascending and descending lines. This real-time overview simplifies trend monitoring. Check it to assess market bias instantly.
Monitor the table to track line counts and trend dominance.
A higher count of ascending lines suggests bullish bias. This helps traders align with the prevailing trend.
🔵 Settings
Number of Trendlines : Sets total lines (max 10, min 3), balancing chart clarity and trend coverage.
Max Look Back : Defines historical bars (min 50) for pivot detection, ensuring robust trendlines.
Pivot Range : Sets pivot sensitivity (min 2), adjusting trendline precision to market volatility.
Show Table Checkbox : Toggles display of a table showing ascending/descending line counts.
Alarm : Enable or Disable the alert.
🔵 Conclusion
The multi slopes indicator, blending pivot-based trendlines and dynamic regression lines, maps market trends with precision. Its dual approach captures both structural and short-term momentum.
Customizable settings, like trendline count and pivot range, adapt to diverse trading styles. The real-time table simplifies trend monitoring, enhancing efficiency. It suits forex, stocks, and crypto markets.
While trendlines anchor long-term trends, regression lines track intraday shifts, offering versatility. Contextual analysis, like price action, boosts signal reliability. This indicator empowers data-driven trading decisions.

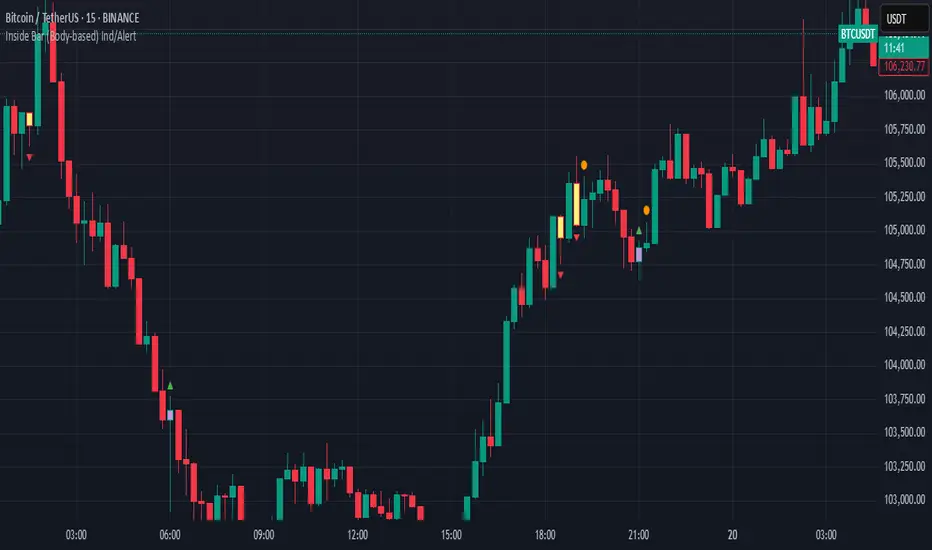
Inside Bar (Body-based) Ind/AlertDescription:
This indicator detects Inside Bar patterns based strictly on the candle body (open/close range) of the mother candle, rather than the traditional high/low wick method. An inside bar is highlighted when the current candle’s entire body is contained within the body of the previous candle.
It can be useful for traders who want a more conservative and reliable definition of inside bars, focusing on true consolidation periods and filtering out signals caused by extended wicks.
Features:
Body-based Inside Bar detection:
The indicator colors and marks candles where the current bar’s body is fully within the previous bar’s body.
Bullish/Bearish identification:
Bullish inside bars are marked in green, bearish in red.
Double Inside Bar Detection:
An optional feature marks when two consecutive candles’ bodies are inside the same mother bar body—potentially indicating stronger consolidation.
Alerts:
Set alerts for single or double inside bars for automated monitoring.
How to Use:
Add the indicator to your chart.
Look for colored bars or plotted shapes for inside bar signals based on candle bodies.
Use alerts to get notified in real time when inside bar patterns appear.
Note:
This script uses only the candle body (open and close) for inside bar calculations, which may help filter out less reliable signals found with wick-based approaches.
Candle Close Distance AlertThreshold-Based Distance:
You define a threshold percentage (threshold_percent) to specify what "far" means (e.g., 2%).
The script calculates the absolute distance between:
Close and Open
Close and High
Close and Low
If any of these distances exceed the specified threshold, the condition is triggered.
Visual Markers:
Green markers (triangle up) indicate the close is far from the open.
Red markers (triangle down) indicate the close is far from the high.
Blue markers (triangle down) indicate the close is far from the low.
These markers make it easy to spot significant price movements on the chart.
Customizable Alerts:
If enabled, alerts are triggered when any of the conditions are met.
Alerts are designed to notify you in real time if a candle closes far from the open, high, or low.

Moving Average ADX with Alerts# Moving Average ADX (MA ADX) Indicator
## Overview
The Moving Average ADX combines a weighted moving average (WMA) with ADX (Average Directional Index) momentum to create a dynamic, trend-following indicator. The indicator's line changes color based on the ADX strength and directional movement, helping traders identify strong trends and potential reversals.
## Key Features
- Color-changing WMA line based on ADX strength and direction
- Built-in alerts for trend changes
- Customizable ADX and moving average parameters
- Overlay indicator that plots directly on the price chart
## Color Signals
- **Green Line**: Strong bullish trend (ADX > threshold with +DI > -DI)
- **Red Line**: Strong bearish trend (ADX > threshold with -DI > +DI)
- **Black Line**: Weak or no trend (ADX < threshold)
## Parameters
- **DI Length**: Period for calculating Directional Movement (default: 14)
- **ADX Smoothing**: Smoothing period for ADX calculation (default: 14)
- **ADX MA Active**: Threshold for ADX to consider a trend strong (default: 18)
- **Length**: Period for the Weighted Moving Average (default: 34)
- **Source**: Price source for calculations (default: close)
## Trading Applications
1. **Trend Identification**
- Green line suggests riding bullish trends
- Red line suggests riding bearish trends
- Black line suggests ranging or weak trend conditions
2. **Entry Signals**
- Color changes from black to green: Potential bullish entry
- Color changes from black to red: Potential bearish entry
3. **Exit Signals**
- Color changes from green to black or red: Consider exiting longs
- Color changes from red to black or green: Consider exiting shorts
## Alert Functions
The indicator includes two built-in alerts:
1. Bullish Signal: Triggers when the indicator turns bullish (green)
2. Bearish Signal: Triggers when the indicator turns bearish (red)
## Best Practices
- Use in conjunction with other technical analysis tools
- Consider the overall market context
- Wait for confirmation of color changes before taking action
- Use appropriate position sizing and risk management

[Opening Range pre-Market Breakout Screener] with Alerts (TSO)=
with Alerts (TSO)
===========================================================================
===========================================================================
This Opening Range/pre-Market breakout screener lets you monitor up to 10 symbols/instruments simultaneously (9 plus the one currently displayed on the chart). It provides alerts when the price breaks out of the pre-market range, offering two options: 1) Immediate alerts as the breakout happens with the live bar, and 2) Alerts after the bar closes. The screener also labels breakouts on the chart and offers live status updates in the stats table. The Opening Range/pre-Market area is fully customizable, with a default setting optimized for US stock market pre-market hours (07:00 am-09:30 am ET). Additionally, you can set the Active Trading Session Schedule to define specific intraday periods when breakouts and alerts will be displayed.
What sets this indicator apart from other ORB indicators is its integrated screener for multiple symbols and an IMMEDIATE alert/status feature that notifies you the moment the price breaks through the pre-market range. Moreover, it can be used worldwide as it includes an active trading session schedule for every trading region globally!
===========================================================================
Explanation of all the Features/Inputs/Settings
---------------------------------------------------------------------------
>>> This is where the desired symbols can be turned on/checked to be screened for ORB breakout - the selected/checked symbols at creation of a 'Any alert() function call' alert will alert on any of the selected/checked symbols.
>>> Active Trading Session Hours, this is where Active Trading Session Hours can be setup during which breakouts will be shown on chart/table and alerts will trigger. Every trading region is included, by default it's set to a regular US trading session: 09:30am0-4:00pm ET.
>>> ORB Breakout Config is where the desired breakout approaches can be shown/alert turn on. Closed Bar Breakout: means that a breakout is considered as occurred only when a candle bar is fully closed. Live Breakouts: a breakout occurs immediately at price breakout thru pre-Market range, while candle bar is still open.
>>> Final section is simply the stats table location.
===========================================================================
Adding Alerts in TradngView
---------------------------------------------------------------------------
1) Consolidation alert(s) for the selected/checked symbols
- Select/check/find the desired symbols/instruments (when selecting symbols, make sure - they are from correct BROKER/SOURCE as pricing may differ between different brokers, causing confusion (under 1 broker/source, the symbol will be consolidated, under another it will not...))
-Right-click anywhere on any TradingView chart
-Click on Add alert
-Condition: Select this indicator by it’s name
-Immediately below, change it to "alert() function calls only"
-Expiration: Open-ended (that may require higher tier TradingView account, otherwise the alert will need to be occasionally re-triggered)
-Alert name: Anything
-Hit “Create”
-Note: If you change ANY Settings within the indicator – you must DELETE the current alert and create a new one per steps above, otherwise it will continue triggering alerts per old Settings!
* Once alert triggers, don't get confused, as it will show "Alert on SYMBOL", the SYMBOL will be where you created the major alert for all the symbols within the screener list! Within the alert, on the bottom, it will say: "SPY - LONG Breakout - Live" - this is where the correct symbol is for which the alert for consolidation was triggered!
===========================================================================
If you have any questions or issues with the indicator, please message me directly via TradingView.
---------------------------------------------------------------------------
Good Luck! (NOTE: Trading is very risky, past performance is not necessarily indicative of future results, so please trade responsibly!)

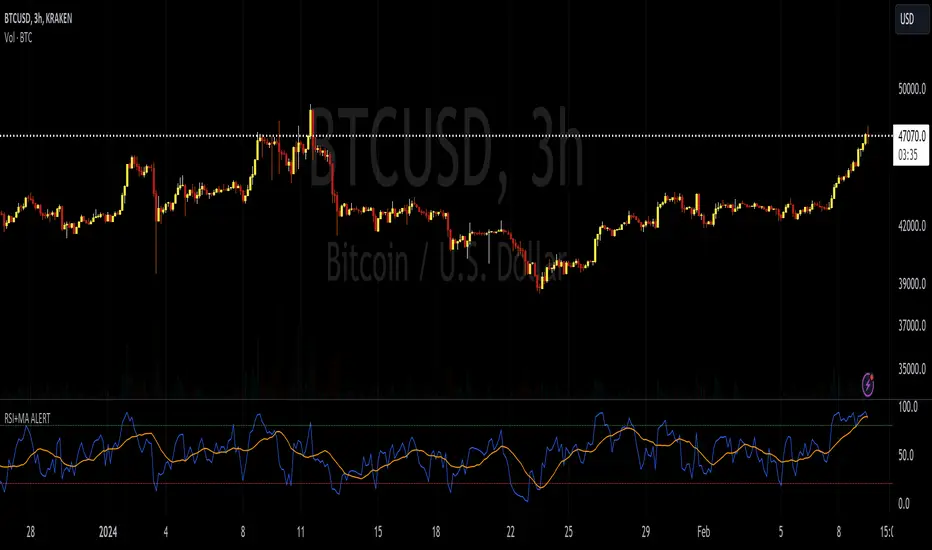
RSI+MA ALERTThis script is a custom indicator for use on the TradingView platform, which combines the Relative Strength Index (RSI) with a moving average applied to the RSI itself to smooth its movements and potentially identify trends or reversals more clearly.
The RSI is a momentum oscillator that measures the speed and variation of asset price movements. RSI values range from 0 to 100 and are generally considered overbought when above 70 and oversold when below 30. In our indicator, we adjust these levels to 80 and 20, respectively, to avoid premature or delayed signals. Furthermore, we have inserted customizable options within the script that allow the user to define their own overbought and oversold thresholds, thus improving compatibility with different strategies and market conditions.
The overbought metric means that the price may be at a point of downward reversal, while an oversold state may indicate an imminent upward reversal point. These levels are visualized as dotted horizontal lines on the indicator chart for guidance.
To capture the behavior of the RSI over time, we apply a simple moving average (SMA) to the RSI values, thereby smoothing the RSI graph and highlighting the broader trend of oscillator movement. This helps filter out the noise from smaller price movements and provides a clearer representation of trend momentum.
Regarding alerts, the indicator is programmed to send notifications when the RSI value crosses the defined overbought and oversold levels. This means that when the RSI drops below 20, the indicator triggers an oversold alert, while an RSI above 80 triggers an overbought alert. These levels, however, are user adjustable in code, allowing custom levels to be defined to match individual strategies.
Visually, the indicator plots two lines on the chart below the main price chart: a blue line for the RSI values and an orange line for the RSI moving average. The red (oversold - 20) and green (overbought - 80) horizontal lines delimit the critical levels, although these are also customizable. These are the fundamental features of this indicator that make it a useful tool for analyzing momentum and potentially identifying price reversals.
TradingView.To Strategy Template (with Dyanmic Alerts)Hello traders,
If you're tired of manual trading and looking for a solid strategy template to pair with your indicators, look no further.
This Pine Script v5 strategy template is engineered for maximum customization and risk management.
Best part?
This Pine Script v5 template facilitates the dynamic construction of TradingView.TO alerts, sparing users the time and effort of mastering the TradingView.TO syntax and manually create alert commands.
This powerful tool gives much power to those who don't know how to code in Pinescript and want to automate their indicators' signals via TradingView.TO bot.
IMPORTANT NOTES
TradingView.TO is a trading bot software that forwards TradingView alerts to your brokers (examples: Binance, Oanda, Coinbase, Bybit, Metatrader 4/5, ...) for automating trading.
Many traders don't know how to create TradingView.TO dynamically-compatible alerts using the data from their TradingView scripts.
Traders using trading bots want their alerts to reflect the stop-loss/take-profit/trailing-stop/stop-loss to break options from your script and then create the orders accordingly.
This script showcases how to create TradingView.TO alerts dynamically.
TRADINGVIEW ALERTS
1) You'll have to create one alert per asset X timeframe = 1 chart.
Example: 1 alert for BTC/USDT on the 5 minutes chart, 1 alert for BTC/USDT on the 15-minute chart (assuming you want your bot to trade the BTC/USDT on the 5 and 15-minute timeframes)
2) Select the Order fills and alert() function calls condition
3) For each alert, the alert message is pre-configured with the text below
{{strategy.order.alert_message}}
Please leave it as it is.
It's a TradingView native variable that will fetch the alert text messages built by the script.
4) TradingView.TO uses webhook technology - setting a webhook URL from the alerts notifications tab is required.
KEY FEATURES
I) Modular Indicator Connection
* plug your existing indicator into the template.
* Only two lines of code are needed for full compatibility.
Step 1: Create your connector
Adapt your indicator with only 2 lines of code and then connect it to this strategy template.
To do so:
1) Find in your indicator where the conditions print the long/buy and short/sell signals.
2) Create an additional plot as below
I'm giving an example with a Two moving averages cross.
Please replicate the same methodology for your indicator, whether a MACD , ZigZag, Pivots , higher-highs, lower-lows or whatever indicator with clear buy and sell conditions.
//@version=5
indicator("Supertrend", overlay = true, timeframe = "", timeframe_gaps = true)
atrPeriod = input.int(10, "ATR Length", minval = 1)
factor = input.float(3.0, "Factor", minval = 0.01, step = 0.01)
= ta.supertrend(factor, atrPeriod)
supertrend := barstate.isfirst ? na : supertrend
bodyMiddle = plot(barstate.isfirst ? na : (open + close) / 2, display = display.none)
upTrend = plot(direction < 0 ? supertrend : na, "Up Trend", color = color.green, style = plot.style_linebr)
downTrend = plot(direction < 0 ? na : supertrend, "Down Trend", color = color.red, style = plot.style_linebr)
fill(bodyMiddle, upTrend, color.new(color.green, 90), fillgaps = false)
fill(bodyMiddle, downTrend, color.new(color.red, 90), fillgaps = false)
buy = ta.crossunder(direction, 0)
sell = ta.crossunder(direction, 0)
//////// CONNECTOR SECTION ////////
Signal = buy ? 1 : sell ? -1 : 0
plot(Signal, title = "Signal", display = display.data_window)
//////// CONNECTOR SECTION ////////
Important Notes
🔥 The Strategy Template expects the value to be exactly 1 for the bullish signal and -1 for the bearish signal
Now, you can connect your indicator to the Strategy Template using the method below or that one.
Step 2: Connect the connector
1) Add your updated indicator to a TradingView chart
2) Add the Strategy Template as well to the SAME chart
3) Open the Strategy Template settings, and in the Data Source field, select your 🔌Connector🔌 (which comes from your indicator)
Note it doesn’t have to be named 🔌Connector🔌 - you can name it as you want - however, I recommend an explicit name you can easily remember.
From then, you should start seeing the signals and plenty of other stuff on your chart.
🔥 Note that whenever you update your indicator values, the strategy statistics and visuals on your chart will update in real-time
II) BOT Risk Management:
- Max Drawdown:
Mode: Select whether the max drawdown is calculated in percentage (%) or USD.
Value: If the max drawdown reaches this specified value, set a value to halt the bot.
- Max Consecutive Days:
Use Max Consecutive Days BOT Halt: Enable/Disable halting the bot if the max consecutive losing days value is reached.
- Max Consecutive Days: Set the maximum number of consecutive losing days allowed before halting the bot.
- Max Losing Streak:
Use Max Losing Streak: Enable/Disable a feature to prevent the bot from taking too many losses in a row.
- Max Losing Streak Length: Set the maximum length of a losing streak allowed.
Margin Call:
- Use Margin Call: Enable/Disable a feature to exit when a specified percentage away from a margin call to prevent it.
Margin Call (%): Set the percentage value to trigger this feature.
- Close BOT Total Loss:
Use Close BOT Total Loss: Enable/Disable a feature to close all trades and halt the bot if the total loss is reached.
- Total Loss ($): Set the total loss value in USD to trigger this feature.
Intraday BOT Risk Management:
- Intraday Losses:
Use Intraday Losses BOT Halt: Enable/Disable halting the bot on reaching specified intraday losses.
Mode: Select whether the intraday loss is calculated in percentage (%) or USD.
- Max Intraday Losses (%): Set the value for maximum intraday losses.
Limit Intraday Trades:
- Use Limit Intraday Trades: Enable/Disable a feature to limit the number of intraday trades.
- Max Intraday Trades: Set the maximum number of intraday trades allowed.
Restart Intraday EA:
III) Order Types and Position Sizing
- Choose between market or limit orders.
- Set your position size directly in the template.
Please use the position size from the “Inputs” and not the “Properties” tab.
I know it's redundant. - the template needs this value from the "Inputs" tab to build the alerts, and the Backtester needs it from the "Properties" tab.
IV) Advanced Take-Profit and Stop-Loss Options
- Choose to set your SL/TP in either USD or percentages.
- Option for multiple take-profit levels and trailing stop losses.
- Move your stop loss to break even +/- offset in USD for “risk-free” trades.
V) Miscellaneous:
Retry order openings if they fail.
Order Types:
Select and specify order type and price settings.
Position Size:
Define the type and size of positions.
Leverage:
Leverage settings, including margin type and hedge mode.
Session:
Limit trades to specific sessions.
Dates:
Limit trades to a specific date range.
Trades Direction:
Direction: Specify the market direction for opening positions.
VI) Logger
The TradingView.TO commands are logged in the TradingView logger.
You'll find more information about it in this TradingView blog post .
WHY YOU MIGHT NEED THIS TEMPLATE
1) Transform your indicator into a TradingView.TO trading bot more easily than before
Connect your indicator to the template
Create your alerts
Set your EA settings
2) Save Time
Auto-generated alert messages for TradingView.TO.
I tested them all and checked with the support team what could/couldn’t be done.
3) Be in Control
Manage your trading risks with advanced features.
4) Customizable
Fits various trading styles and asset classes.
REQUIREMENTS
* Make sure you have your TradingView.TO account
* If there is any issue with the template, ask me in the comments section - I’ll answer quickly.
BACKTEST RESULTS FROM THIS POST
1) I connected this strategy template to a dummy Supertrend script.
I could have selected any other indicator or concept for this script post.
I wanted to share an example of how you can quickly upgrade your strategy, making it compatible with TradingView.TO.
2) The backtest results aren't relevant for this educational script publication.
I used realistic backtesting data but didn't look too much into optimizing the results, as this isn't the point of why I'm publishing this script.
This strategy is a template to be connected to any indicator - the sky is the limit. :)
3) This template is made to take 1 trade per direction at any given time.
Pyramiding is set to 1 on TradingView.
The strategy default settings are:
* Initial Capital: 100000 USD
* Position Size: 1%
* Commission Percent: 0.075%
* Slippage: 1 tick
* No margin/leverage used

SuperTrend Multi Time Frame Long and Short Trading Strategy
Hello All
This is non-repainting Supertrend Multi Time Frame script, I got so many request on Supertrend with Multi Time Frame. This is for all of them ..I am making it open for all so you can change its coding according to your need.
How the Basic Indicator works
SuperTrend is one of the most common ATR based trailing stop indicators.
In this version you can change the ATR calculation method from the settings. Default method is RMA.
The indicator is easy to use and gives an accurate reading about an ongoing trend. It is constructed with two parameters, namely period and multiplier. The default values used while constructing a Supertrend indicator are 10 for average true range or trading period and three for its multiplier.
The average true range (ATR) plays an important role in 'Supertrend' as the indicator uses ATR to calculate its value. The ATR indicator signals the degree of price volatility .
The buy and sell signals are generated when the indicator starts plotting either on top of the closing price or below the closing price. A buy signal is generated when the ‘Supertrend’ closes above the price and a sell signal is generated when it closes below the closing price.
It also suggests that the trend is shifting from descending mode to ascending mode. Contrary to this, when a ‘Supertrend’ closes above the price, it generates a sell signal as the colour of the indicator changes into red.
A ‘Supertrend’ indicator can be used on spot, futures, options or forex, or even crypto markets and also on daily, weekly and hourly charts as well, but generally, it fails in a sideways-moving market.
How the Strategy works
This is developed based on SuperTrend.
Use two time frame for confirm all entry signals.
Two time frame SuperTrend works as Trailing stop for both long and short positions.
More securely execute orders, because it is wait until confine two time frames(example : daily and 30min)
Each time frame developed as customisable for user to any timeframe.
User can choose trading position side from Long, Short, and Both.
Custom Stop Loss level, user can enter Stop Loss percentage based on timeframe using.
Multiple Take Profit levels with customisable TP price percentage and position size.
Back-testing with custom time frame.
This strategy is develop for specially for automation purpose.
The strategy includes:
Entry for Long and Short.
Take Profit.
Stop Loss.
Trailing Stop Loss.
Position Size.
Exit Signal.
Risk Management Feature.
Backtesting.
Trading Alerts.
Use the strategy with alerts
This strategy is alert-ready. All you have to do is:
Go on a pair you would like to trade
Create an alert
Select the strategy as a Trigger
Wait for new orders to be sent to you
This is develop for specially for automating trading on any exchange, if you need to get that automating service for this strategy or any Tradingview strategy or indicator please contact me I am have 8 year experience on that field.
I hope you enjoy it!
Thanks,
Ranga

[Strategy Alert Webhook Demo] Buy One Sell One Buy One Sell One
Two Options to send Alert Order via Webhook
1. Order fill events with `alert_message` on strategy.close(), strategy.entry(), strategy.exit() and strategy.order()
NOTE: Need to fill the Alert Creation box with `{{strategy.order.alert_message}}`
2. Send Alert through `alert()`

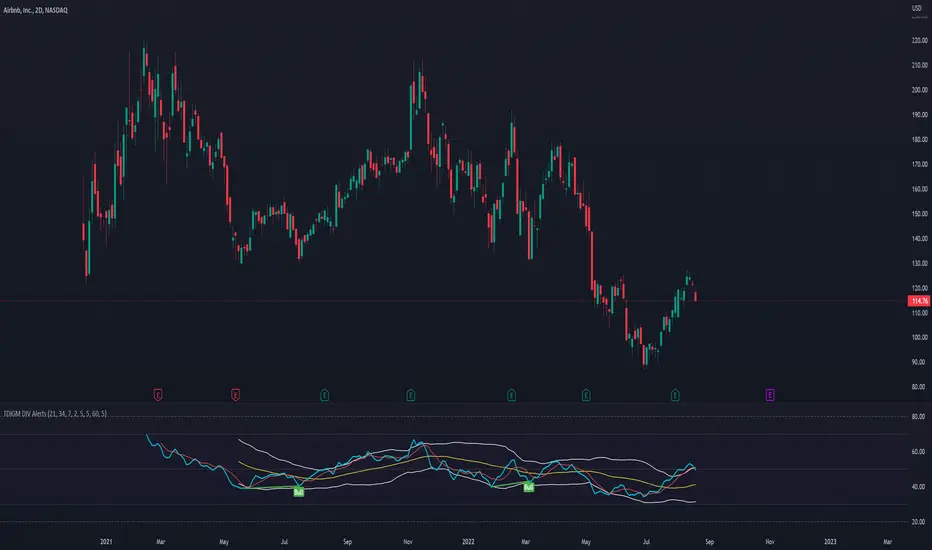
TDI - Traders Dynamic Index [Goldminds] with DIV RSI AlertsOriginally from Goldminds. Later modified by Jakub a Babo. I just added RSI DIV alerts. You're welcome. :)
Instruction: once you have have this indicator and press Alt + A to create alert.
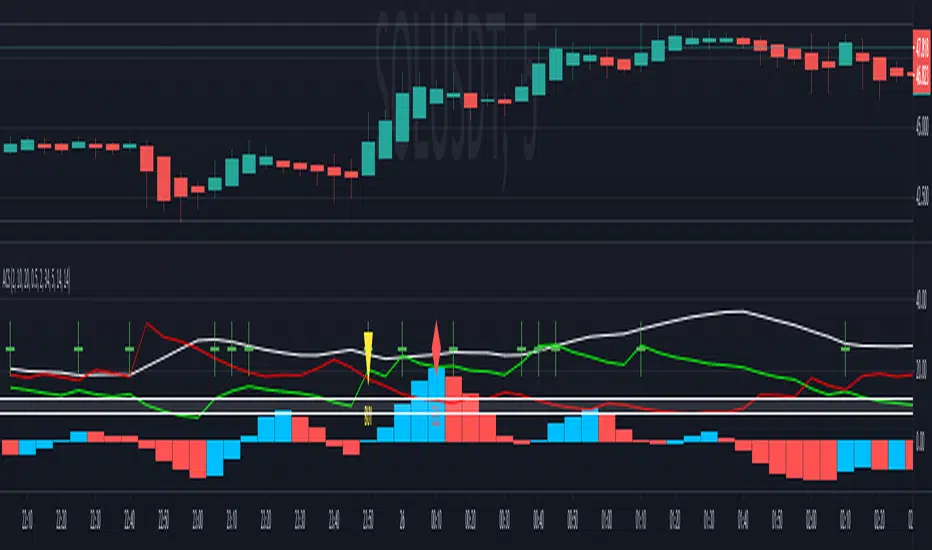
Agisko Crypto Scalper v4.2 (BUY/SELL)Indicator that generates BUY and SELL shapes with alerts.
OSC scale can be configured to visualize the oscillator better. Nothing required, just for visualization.
DMI mark is by default 10 which is fine for most situations.
DMI range is the buffer zone where BUY orders will be created. E.g.: DMI mark 10 and DMI range 1 will create a zone for BUY when DMI+ is between 9 and 11 (10-1 and 10+1).
This works perfect on the 5 minute chart and is suggested to use the SELL alert for exits or use a take profit (TP) of 1% with optional trailing if you use bots like 3 commas.
Stoploss is the same. Use the SELL alert or set a manual stoploss of 2-5%.
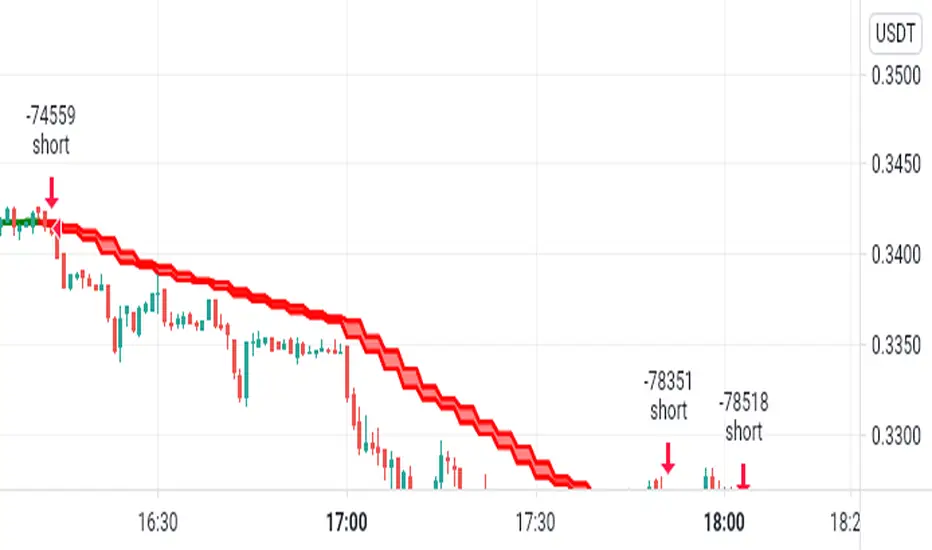
FIBAUS Directional Movement w/alertsIndicator uses the basis of traditional Directional Movement Theory with wider parameters. This allows users to see a change in volume and price direction simultaneously on any timeframe. The indicator works well on lower timeframes and should be use in combination with the multiple timeframe trading concept.
Alerts:
1.Coding also allows for alerts on Downtrend and Uptrend.
2.You can also set a manual alert when bars cross the zero line only.
Happy Trading,
FIBAUS

Open Close Cross Strategy R6.1 revised by yourmattieOriginal version: Open Close Cross Strategy R5 revised by JustUncle.
Change: script changed to a study script with custom alerts.
This revision is an open Public release, with just some minor changes. It is a revision of the Strategy "Open Close Cross Strategy R2" originally published by @JayRogers.
Revised by JustUncleL
Description :
Strategy based around Open-Close Moving Average Crossovers optionally from a higher time frame.
Read more about the indicator original script
Klik here
##USE AT YOUR OWN RISK##
Use this as overlayer on the original strategy to set custom alerts.
Info: with this study script no buy/sell arrows show up op the chart.
Does some know a solution for this issue:
Issue: sometimes it gives a false signal because even when you set "one per bar close" the custom set alert might come halfway the bar....and it might be a false signal when the bar is closed
Does somone know a fix for this? I tried with barstate.iscomfirmed but it didn't work for me.
Ps. I'm not a developer...just changed the scipt by watching a youtube tutorial.
Multi Time Frame Buy&Sell V4.0 [BACKTEST]Hi guys,this indicator Developed for Intraday and multi Time Frame Trading. Note: Invite only Script.Request to me Access permission to test this.
*** THIS IS STUDY VERSION ***
Time Frame : can use for 15 min / 30 min / 1h / 4h time
15 min configuration is best result for bitcoin and ethereum .
This can be used : Crypto Currency/ Bitcoins / ethereum ,Forex,currencies ,Index ,Commodity Gold / silver , Oil Market and in Equity / Futures
ETHUSDT Futures 15min
BTCUSDT Futures 15min:
GOLD /USD FOREX 15min:
HOW IT WORKS:
this indicator analyze EMA&SMA support and resistance then combine with pivot point and fibo levels is used to calculate the signals.and finally show entry label on
chart with target point and stop loss
HOW TO USE:
Creating a signal is as simple as adding the indicator called to your chart(buy or sell)label and background color change ( green=buy / red = sell)
green line is target and black line is stop loss.
in top of setting page you can see noise filter option . that can change it to get better result and reduce noise. in setting can set 3 target level and stoploss
NOT:all information show to info panel in chart.
strategy tester : enabled .All you can test this in live market in any segment.
NOT: can to change noise filter in setting setup until to get best result.
Choose any Date Month Year to Current Date and check the results below in the Strategy Tester.
REPAINT/NO REPAINT : No Repaint ,entery labal(buy or sell) and Background Color wont change. In the current candle position wait for the candle to close to see the
stability.
"Set alert": Select "Once per bar close" for your alert options.
There are 5 alerts:
- BUY
- SELL
- BUY OR SELL (for free TV users)
- take profit
- stop loss
Review and Feedback.Thank you!
Any issues report to me to Fix.Thank you!
how To Get access : Use the link below to obtain access to this indicator or PM us to obtain access.

Multi Time Frame Buy&Sell V4.0 [ALERTSETUP]Hi guys,this indicator Developed for Intraday and multi Time Frame Trading. Note: Invite only Script.Request to me Access permission to test this.
*** THIS IS STUDY VERSION ***
Time Frame : can use for 15 min / 30 min / 1h / 4h time
15 min configuration is best result for bitcoin and ethereum .
This can be used : Crypto Currency/ Bitcoins / ethereum ,Forex,currencies ,Index ,Commodity Gold / silver , Oil Market and in Equity / Futures
ETHUSDT Futures 15min
BTCUSDT Futures 15min:
GOLD /USD FOREX 15min:
HOW IT WORKS:
this indicator analyze EMA&SMA support and resistance then combine with pivot point and fibo levels is used to calculate the signals.and finally show entry label on
chart with target point and stop loss
HOW TO USE:
Creating a signal is as simple as adding the indicator called to your chart(buy or sell)label and background color change ( green=buy / red = sell)
green line is target and black line is stop loss.
in top of setting page you can see noise filter option . that can change it to get better result and reduce noise. in setting can set 3 target level and stoploss
NOT:all information show to info panel in chart.
strategy tester : enabled .All you can test this in live market in any segment.
NOT: can to change noise filter in setting setup until to get best result.
Choose any Date Month Year to Current Date and check the results below in the Strategy Tester.
REPAINT/NO REPAINT : No Repaint ,entery labal(buy or sell) and Background Color wont change. In the current candle position wait for the candle to close to see the
stability.
"Set alert": Select "Once per bar close" for your alert options.
There are 5 alerts:
- BUY
- SELL
- BUY OR SELL (for free TV users)
- take profit
- stop loss
To Get access - Send me a private chat message in tradingview.com to get access.Or request in comment section below.
Review and Feedback.Thank you!
Any issues report to me to Fix.Thank you!
Use the link below to obtain access to this indicator:

T3-CCI Alerts [SystemAlpha]This is an alert companion of the T3-CCI Strategy based on FX Sniper's T3-CCI indicator. Instead of using just the normal buy and sell signal, we added an option to use trend filters, trailing stop loss and take profit targets.
The TTM scalper indicator of John Carter’s Scalper Buys and Sells was originally created by HPotter and is a close approximation of the one described in his book Mastering the Trade.
In this study you have a choice of:
Trend Filters:
- Average Directional Index ( ADX ) – buy when price is trend is up and sell when trend is down.
- Moving Average (MA) – buy when price close above the defined moving average and sell when price close below moving average
- Parabolic SAR – buy when SAR is above price is above price and sell when SAR is below price.
- All - Use ADX , MA and SAR as filters
For MA Filter , you can use the “TF MA Type” and "TF MA Period" parameter to select Simple or Exponential Moving Average and length.
Stop Loss:
- Average True Range (ATR) – ATR % stop as trailing stop loss.
- Parabolic SAR ( SAR ) – Parabolic SAR adapted as trailing stop loss.
For ATR , you can use the “ATR Trailing Stop Multiplier” parameter to set an initial offset for trailing stop loss.
Take Profit Target:
- Average True Range (ATR) – ATR % stop as trailing stop loss.
- Standard % – Percent as target profit
For ATR , you can use the “ATR Take Profit Multiplier” parameter to set an initial offset for trailing stop loss.
Additional feature include:
- Show Bar Colors
Alerts:
When creating alerts use “Once Per Bar Close” parameter for Long and Short and “Once Per Bar” for Close, Trailing Stop, and Take Profit.
TradingView Links:
Strategy:
T3-CCI Indicator:
Advance ADX:
How to use:
1. Apply the script by browsing through Indicators --> Invite-Only scripts and select the indicator
2. Once loaded, click the gear (settings) button to select/adjust the parameters based on your preference.
3. Wait for the next BUY or SELL signal to enter the trade!
Disclaimer:
The indicator and signals generated do not constitute investment advice; are provided solely for informational purposes and therefore is not an offer to buy or sell a security; are not warranted to be correct, complete or accurate; and are subject to change without notice.

TTM Scalper Alerts [SystemAlpha]This is an alert companion of the TTM Scalper Strategy based on TTM scalper indicator. Instead of using just the normal buy and sell signal, we added an option to use trend filters, trailing stop loss and take profit targets.
The TTM scalper indicator of John Carter’s Scalper Buys and Sells was originally created by HPotter and is a close approximation of the one described in his book Mastering the Trade.
In this study you have a choice of:
Trend Filters:
- Average Directional Index ( ADX ) – buy when price is trend is up and sell when trend is down.
- Moving Average (MA) – buy when price close above the defined moving average and sell when price close below moving average
- Parabolic SAR – buy when SAR is above price is above price and sell when SAR is below price.
- All - Use ADX , MA and SAR as filters
For MA Filter , you can use the “TF MA Type” and "TF MA Period" parameter to select Simple or Exponential Moving Average and length.
Stop Loss:
- Average True Range (ATR) – ATR % stop as trailing stop loss.
- Parabolic SAR ( SAR ) – Parabolic SAR adapted as trailing stop loss.
For ATR , you can use the “ATR Trailing Stop Multiplier” parameter to set an initial offset for trailing stop loss.
Take Profit Target:
- Average True Range (ATR) – ATR % stop as trailing stop loss.
- Standard % – Percent as target profit
For ATR , you can use the “ATR Take Profit Multiplier” parameter to set an initial offset for trailing stop loss.
Additional feature include:
- Show Bar Colors
Alerts:
When creating alerts use “Once Per Bar Close” parameter for Long and Short and “Once Per Bar” for Close, Trailing Stop, and Take Profit.
TradingView Links:
Strategy:
Reference:
HPotter TTM scalper indicator Strategy
How to use:
1. Apply the script by browsing through Indicators --> Invite-Only scripts and select the indicator
2. Once loaded, click the gear (settings) button to select/adjust the parameters based on your preference.
3. Wait for the next BUY or SELL signal to enter the trade!
Disclaimer:
The indicator and signals generated do not constitute investment advice; are provided solely for informational purposes and therefore is not an offer to buy or sell a security; are not warranted to be correct, complete or accurate; and are subject to change without notice.

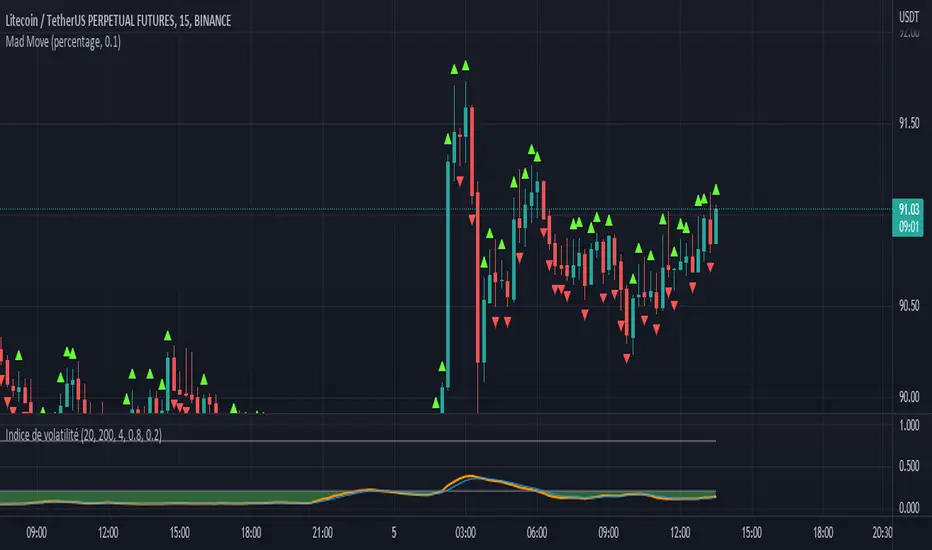
Mad MoveMad Move allows to highlight big candles on graph and trigger alerts when a big candle appears.
it allows you to react quickly on your trades if necessary.
Only one parameter:
"Move Size: price variation amount (default: 30)
Time frame is decisive. Logically, the smaller it is, the more the relevance increases
To create an alert, you must activate the script on the graph with the correct desired setting (Time frame + Move Size), then in the alert editor, select Mad Move in the "condition" field.
Hancock - Filtered Volume OBV OSC [Alerts]This is an alert version of the strategy found here
This doesn't have the trailing stop or stop loss risk management included, i'll work on a release that has risk management included as best i can with alerts. Make sure to set a stop loss with your alert command.
Happy trading
Hancock

Price alertThis indicator is an indicator for setting alerts.
Set alerts after adding them to the chart.
By setting an alert, you can notify the closing price to your smartphone or smartwatch.
