MA + MACD alert TrendsThis is a strategy/combination of warning indicators using 6MA+MACD.
The strategy details are as follows: This is a simple warning strategy created so that we don't have to monitor the candlestick chart too often.
Note: This isn't an entry strategy; it's a signaling strategy for upcoming trends. For maximum efficiency, we should incorporate more formulas into the command. In the case below, I use Fibonacci to enter the command.
This strategy setting works for a 15-minute time frame, but it can still work for different time frames.
It has been working well with Gold and USOIL for the last two years, as well as with currency pairs like EURUSD and many others.
Components:
EMA100 + EMA200 + MA400 + MA800
MACD (timeframe greater than 1 timeframe)
Fibonacci retreat.
Uptrend alert:
Candles on both EMAs (100-200) + 2 SMAs (400-800)
In the previous 80 candles:
EMA100 cross up to EMA200
At the same time, the MACD cross up 0.
The uptrend warning will trigger when EMA6 cuts down to MA10. That's when the price creates the top and we'll wait for the market to go back to the Fibonacci threshold of 0.618 and start buying (or wait for markets to break up the trendline to buy).
Downtrend alert:
Candles are below both EMAs ( 100-200 ) + 2 SMAs ( 400-800 )
In the previous 80 candles:
EMA100 cross down to EMA200
At the same time, the MACD cross down zero.
The downtrend warning will trigger when EMA6 cuts to MA10. That's when the price creates a bottom and we'll wait for the market to go back to the Fibonacci threshold of 0.618 and start selling (or wait for the market to break down the trendline to sell).
Recommended RR: 1:1
If you have any questions please let me know!
Cerca negli script per "alert"

Heatmap MACD Strategy - Pineconnector (Dynamic Alerts)Hello traders
This script is an upgrade of this template script.
Heatmap MACD Strategy
Pineconnector
Pineconnector is a trading bot software that forwards TradingView alerts to your Metatrader 4/5 for automating trading.
Many traders don't know how to dynamically create Pineconnector-compatible alerts using the data from their TradingView scripts.
Traders using trading bots want their alerts to reflect the stop-loss/take-profit/trailing-stop/stop-loss to breakeven options from your script and then create the orders accordingly.
This script showcases how to create Pineconnector alerts dynamically.
Pineconnector doesn't support alerts with multiple Take Profits.
As a workaround, for 2 TPs, I had to open two trades.
It's not optimal, as we end up paying more spreads for that extra trade - however, depending on your trading strategy, it may not be a big deal.
TradingView Alerts
1) You'll have to create one alert per asset X timeframe = 1 chart.
Example : 1 alert for EUR/USD on the 5 minutes chart, 1 alert for EUR/USD on the 15-minute chart (assuming you want your bot to trade the EUR/USD on the 5 and 15-minute timeframes)
2) For each alert, the alert message is pre-configured with the text below
{{strategy.order.alert_message}}
Please leave it as it is.
It's a TradingView native variable that will fetch the alert text messages built by the script.
3) Don't forget to set the webhook URL in the Notifications tab of the TradingView alerts UI.
EA configuration
The Pyramiding in the EA on Metatrader must be set to 2 if you want to trade with 2 TPs => as it's opening 2 trades.
If you only want 1 TP, set the EA Pyramiding to 1.
Regarding the other EA settings, please refer to the Pineconnector documentation on their website.
Logger
The Pineconnector commands are logged in the TradingView logger.
You'll find more information about it from this TradingView blog post
Important Notes
1) This multiple MACDs strategy doesn't matter much.
I could have selected any other indicator or concept for this script post.
I wanted to share an example of how you can quickly upgrade your strategy, making it compatible with Pineconnector.
2) The backtest results aren't relevant for this educational script publication.
I used realistic backtesting data but didn't look too much into optimizing the results, as this isn't the point of why I'm publishing this script.
3) This template is made to take 1 trade per direction at any given time.
Pyramiding is set to 1 on TradingView.
The strategy default settings are:
Initial Capital: 100000 USD
Position Size: 1 contract
Commission Percent: 0.075%
Slippage: 1 tick
No margin/leverage used
For example, those are realistic settings for trading CFD indices with low timeframes but not the best possible settings for all assets/timeframes.
Concept
The Heatmap MACD Strategy allows selecting one MACD in five different timeframes.
You'll get an exit signal whenever one of the 5 MACDs changes direction.
Then, the strategy re-enters whenever all the MACDs are in the same direction again.
It takes:
long trades when all the 5 MACD histograms are bullish
short trades when all the 5 MACD histograms are bearish
You can select the same timeframe multiple times if you don't need five timeframes.
For example, if you only need the 30min, the 1H, and 2H, you can set your timeframes as follow:
30m
30m
30m
1H
2H
Risk Management Features
All the features below are pips-based.
Stop-Loss
Trailing Stop-Loss
Stop-Loss to Breakeven after a certain amount of pips has been reached
Take Profit 1st level and closing X% of the trade
Take Profit 2nd level and close the remaining of the trade
Custom Exit
I added the option ON/OFF to close the opened trade whenever one of the MACD diverges with the others.
Help me help the community
If you see any issue when adding your strategy logic to that template regarding the orders fills on your Metatrader, please let me know in the comments.
I'll use your feedback to make this template more robust. :)
What's next?
I'll publish a more generic template built as a connector so you can connect any indicator to that Pineconnector template.
Then, I'll publish a template for Capitalise AI, ProfitView, AutoView, and Alertatron.
Thank you
Dave

RSI + Divergences + Alerts [MisterMoTA]The indicator RSI + Divergences + Alerts by MisterMoTA is an RSI indicator that fills the RSI and RSI moving average with 4 different colors (growing up, falling up, falling down and rising down colors), users can customize colors from dashboard , also can be disabled the fill if the user want a standard RSI.
The dafault value of RSI is 14 and value of the moving average is 50 ( a dynamic 50 rsi line is better for trend identification than a standard 50 line) and users can change the values from indicator settings.
For detecting the divergences displayed in the indicator, I integrated in our script the default Divergences indicator from Tradingview, users can display, hide and change colors for regular and hidden divergences.
RSI indicator display also trend conditions for RSI and RSI MA, the RSI MA angle is calculated using ATR value, the slope of the RSI Noving Average can help to identify trend conditions too.
The script comes with 12 different alerts, if need different alerts please let me know in the comments and will update the script with your request:
Alert for Regular Bullish Divergence
Alert for Regular Bearish Divergence
Alert for Hidden Bullish Divergence
Alert for Hidden Bearish Divergence
Alert for RSI Overbought
Alert for RSI Extreme Overbought
"Alert for RSI Oversold
Alert for RSI Extreme Oversold
Alert for RSI Crossing Above RSI MA
Alert for RSI Crossing Bellow RSI MA
Alert for RSI Crossing Above 50
Alert for RSI Crossing Bellow 50
Please follow me for other script like this one.
Kind regards,
MisterMoTA

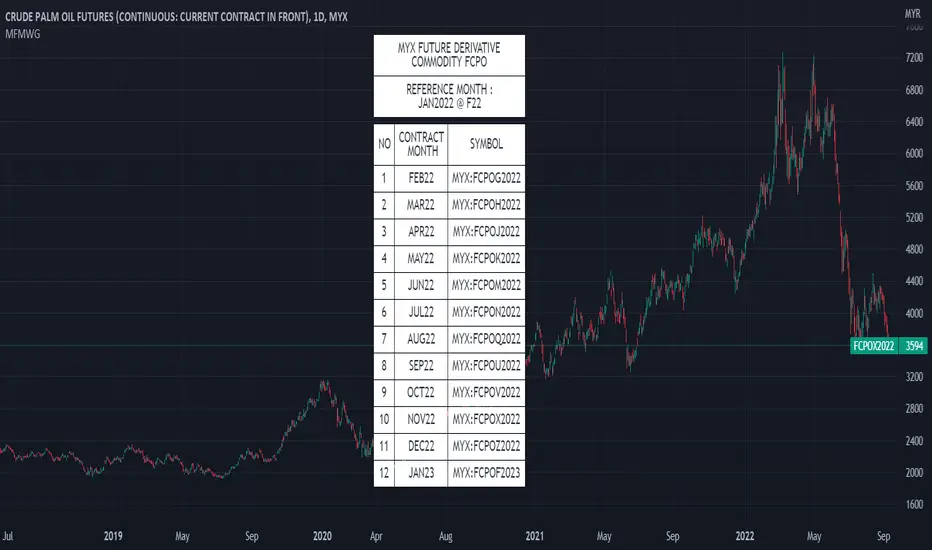
MYX Future Market Watchlist Generator█ OVERVIEW
This indicator listed all Future market in Malaysia and categorize them into Contract Month, Spread, Current Contract and Continuous Contract.
The indicator was developed to make user easier to make watchlist, suitable for beginners and experts in Malaysia Future Market.
This cover all Malaysia Future Markets as follows :
1. Commodity - FCPO, FPKO, FGLD, FTIN, FPOL and FUPO
2. Equity - FKLI and FM70
3. SSF - FCIM, FDRB, FGAM, FHAR, FINA, FMEG, FGEM, FGEN, FTEL and FTOP
4. Financial - FKB3, FMG3, FMG5 and FMGA
█ INSPIRATIONS
This indicator got inspirations from the previous indicators which I developed :
MYX Malaysia Bursa Futures Derivatives Auto Detect
FCPO Contract Month Table
█ CREDITS
I dedicated to known members in this industry especially who actively involved in Malaysia Future Market.
BURSATRENDBANDCHART
zhafrihandsome
XMODEUS
HAIDOJO_trading
datuksri
wrtech2020
FaizHebat
█ FEATURES
1. As mentioned in overview, main ability to categorize and export into watchlist.
2. Dark or light theme table including table position.
█ IMPORTANT NOTES
1. This indicator is one time usage only to generate watchlist through alert.
2. Use live chart to generate alert.
3. Set Alert Frequency to All.
4. Remove Alert once watchlist is done.
5. Usage method is similar to this video . (Sorry no audio provided)
█ EXAMPLE OF USAGE
Higher order Orderblocks + Breakerblocks + Range + AlertsThis script identifies Orderblocks, Breakerblocks and Range using higher order pivots and priceaction logic.
I tried to reduce the number of blocks to make the chart cleaner, for this purpose I use only second order pivots for both MSB lines and supply/demand boxes, I also tried to filter out shifts in MS and false breakouts.
Any box has GRAY color until it gets tested.
After successful test box gets colors:
RED for Supply
GREEN for Demand
BLUE for any Breakerblocks
For cleaner chart and script speed all broken boxes deletes from chart.
It gives comparatively clean chart on any TF, even on extra small (5m, 3m, 1m).
For Range there is option to plot 0.25, 0.5, 0.75 lines.
I usually use log scale on charts and there is an option to use it for proper range mean.
In previous my scripts i have requests to make alerts and this time i made it.
It has customizable alert catching all needed alerts into one output:
- Alert MSB - when market structure changes alert will inform you about its direction, MSB line and new Demand/Supply.
- Alert Orderblock or Breakerblock test - alerts when block was tested and it holds (in other words when it get RED/GREEN/BLUE colors)
- Alert New Range - when new range detected
- Alert Range test - alerts when range top or botoom was tested and it holds.
some examples :

Profit Percentage TrackerThis script provides a quick and easy way to visualize profits in a chart, based on the given entry date and price.
Optionally, alerts can be sent when profits cross up the given " profit unit ".
In short:
Tracks how much profit one could take based on the input " entry date " and the input " entry price "
These inputs are interactive (www.tradingview.com)
Displays the result in a label on top of the last candle
(Optional) Sends alerts based on the given " profit unit ", that is: if ' 0.5 ' is given, then an alert is triggered every time the profit is raised by that number
(Be careful with low values, as TradingView could stop an alert if it triggers too much.)
For alerts to be displayed, a " script alert " must be created right after the script was added to the chart:
- www.tradingview.com
(Choose ' Profits ' as condition and ' Any alert() function call ')
Good to know: if you check " Notify on app ", alerts can be delivered directly to your phone:
i.imgur.com
Prerequirements :
The chart's timezone has to be set to " Exchange " (this is required in order to support the alert's logic):
- kodify.net

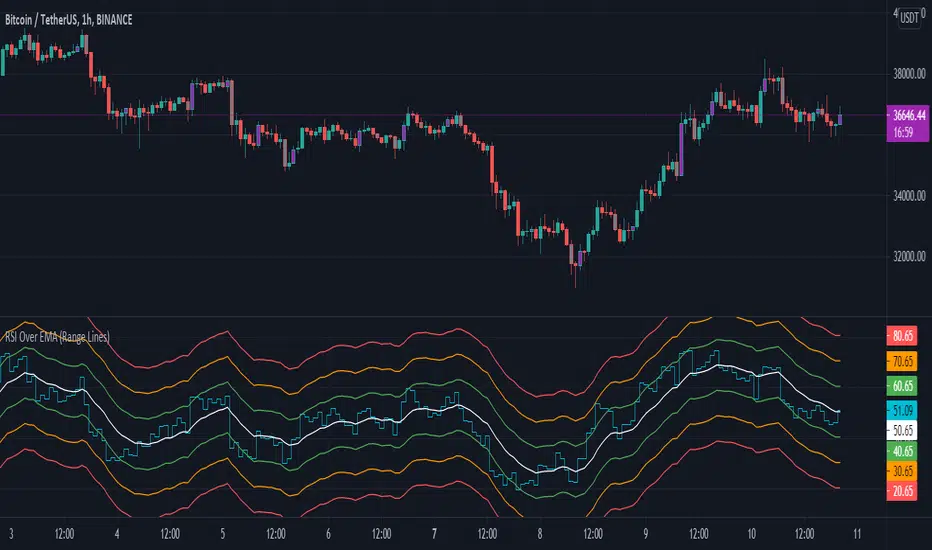
RSI Over EMA (Range Lines)This is another version of the RSI over EMA Trend Sniper script that I released here:
This one gives you better control across pairs wither higher volatility with the extra lines and more alert possibilities.
Here are the useful Alert functions within this indicator:
LONGS:
-Aqua line (RSI Line) - Crossing UP (Long Alert) on the Lower Green line
-Aqua line (RSI Line) - Crossing UP (Long Alert) on the Upper Green line
-Aqua line (RSI Line) - Crossing UP (Long Alert) on the Lower Amber line
-Aqua line (RSI Line) - Crossing UP (Long Alert) on the Upper Amber line
-Aqua line (RSI Line) - Crossing UP (Long Alert) on the Lower Red line
-Aqua line (RSI Line) - Crossing UP (Long Alert) on the Upper Red line
SHORTS:
-Aqua line (RSI Line) - Crossing DOWN (Short Alert) on the Lower Green line
-Aqua line (RSI Line) - Crossing DOWN (Short Alert) on the Upper Green line
-Aqua line (RSI Line) - Crossing DOWN (Short Alert) on the Lower Amber line
-Aqua line (RSI Line) - Crossing DOWN (Short Alert) on the Upper Amber line
-Aqua line (RSI Line) - Crossing DOWN (Short Alert) on the Lower Red line
-Aqua line (RSI Line) - Crossing DOWN (Short Alert) on the Upper Red line
You can setup alerts for the Aqua line (RSI Line) 'crossing up' (Long Alert) or 'crossing down' (Short Alert) on any of the colored EMA lines.
By default the lines are spread out at 10/20/30 and that should cover high volatility charts. But, this is customizable and you can reduce the size of Green/Amber/Red lines to try and get a better more focused setup for whichever coin you are trading on. I have found this version of the RSI over EMA to work better with alt coins that are generally more volatile, but using it on Bitcoin works too.
I am using this for Cryptocurrency alerts, but not for automation to enter or exit a trade. It's important to only use this on normal candles, and only use it as a confirmation of a possible good entry or exit.
888 BOT #alerts█ 888 BOT #alerts (open source)
This is an Expert Advisor 'EA' or Automated trading script for ‘longs’ and ‘shorts’, which uses only a Take Profit or, in the worst case, a Stop Loss to close the trade.
It's a much improved version of the previous ‘Repanocha’. It doesn`t use 'Trailing Stop' or 'security ()' functions (although using a security function doesn`t mean that the script repaints) and all signals are confirmed, therefore the script doesn`t repaint in alert mode and is accurate in backtest mode.
Apart from the previous indicators, some more and other functions have been added for Stop-Loss, re-entry and leverage.
It uses 8 indicators, (many of you already know what they are, but in case there is someone new), these are the following:
1. Jurik Moving Average
It's a moving average created by Mark Jurik for professionals which eliminates the 'lag' or delay of the signal. It's better than other moving averages like EMA , DEMA , AMA or T3.
There are two ways to decrease noise using JMA . Increasing the 'LENGTH' parameter will cause JMA to move more slowly and therefore reduce noise at the expense of adding 'lag'
The 'JMA LENGTH', 'PHASE' and 'POWER' parameters offer a way to select the optimal balance between 'lag' and over boost.
Green: Bullish , Red: Bearish .
2. Range filter
Created by Donovan Wall, its function is to filter or eliminate noise and to better determine the price trend in the short term.
First, a uniform average price range 'SAMPLING PERIOD' is calculated for the filter base and multiplied by a specific quantity 'RANGE MULTIPLIER'.
The filter is then calculated by adjusting price movements that do not exceed the specified range.
Finally, the target ranges are plotted to show the prices that will trigger the filter movement.
Green: Bullish , Red: Bearish .
3. Average Directional Index ( ADX Classic) and ( ADX Masanakamura)
It's an indicator designed by Welles Wilder to measure the strength and direction of the market trend. The price movement is strong when the ADX has a positive slope and is above a certain minimum level 'ADX THRESHOLD' and for a given period 'ADX LENGTH'.
The green color of the bars indicates that the trend is bullish and that the ADX is above the level established by the threshold.
The red color of the bars indicates that the trend is down and that the ADX is above the threshold level.
The orange color of the bars indicates that the price is not strong and will surely lateralize.
You can choose between the classic option and the one created by a certain 'Masanakamura'. The main difference between the two is that in the first it uses RMA () and in the second SMA () in its calculation.
4. Parabolic SAR
This indicator, also created by Welles Wilder, places points that help define a trend. The Parabolic SAR can follow the price above or below, the peculiarity that it offers is that when the price touches the indicator, it jumps to the other side of the price (if the Parabolic SAR was below the price it jumps up and vice versa) to a distance predetermined by the indicator. At this time the indicator continues to follow the price, reducing the distance with each candle until it is finally touched again by the price and the process starts again. This procedure explains the name of the indicator: the Parabolic SAR follows the price generating a characteristic parabolic shape, when the price touches it, stops and turns ( SAR is the acronym for 'stop and reverse'), giving rise to a new cycle. When the points are below the price, the trend is up, while the points above the price indicate a downward trend.
5. RSI with Volume
This indicator was created by LazyBear from the popular RSI .
The RSI is an oscillator-type indicator used in technical analysis and also created by Welles Wilder that shows the strength of the price by comparing individual movements up or down in successive closing prices.
LazyBear added a volume parameter that makes it more accurate to the market movement.
A good way to use RSI is by considering the 50 'RSI CENTER LINE' centerline. When the oscillator is above, the trend is bullish and when it is below, the trend is bearish .
6. Moving Average Convergence Divergence ( MACD ) and ( MAC-Z )
It was created by Gerald Appel. Subsequently, the histogram was added to anticipate the crossing of MA. Broadly speaking, we can say that the MACD is an oscillator consisting of two moving averages that rotate around the zero line. The MACD line is the difference between a short moving average 'MACD FAST MA LENGTH' and a long moving average 'MACD SLOW MA LENGTH'. It's an indicator that allows us to have a reference on the trend of the asset on which it is operating, thus generating market entry and exit signals.
We can talk about a bull market when the MACD histogram is above the zero line, along with the signal line, while we are talking about a bear market when the MACD histogram is below the zero line.
There is the option of using the MAC-Z indicator created by LazyBear, which according to its author is more effective, by using the parameter VWAP ( volume weighted average price ) 'Z-VWAP LENGTH' together with a standard deviation 'STDEV LENGTH' in its calculation.
7. Volume Condition
Volume indicates the number of participants in this war between bulls and bears, the more volume the more likely the price will move in favor of the trend. A low trading volume indicates a lower number of participants and interest in the instrument in question. Low volumes may reveal weakness behind a price movement.
With this condition, those signals whose volume is less than the volume SMA for a period 'SMA VOLUME LENGTH' multiplied by a factor 'VOLUME FACTOR' are filtered. In addition, it determines the leverage used, the more volume , the more participants, the more probability that the price will move in our favor, that is, we can use more leverage. The leverage in this script is determined by how many times the volume is above the SMA line.
The maximum leverage is 8.
8. Bollinger Bands
This indicator was created by John Bollinger and consists of three bands that are drawn superimposed on the price evolution graph.
The central band is a moving average, normally a simple moving average calculated with 20 periods is used. ('BB LENGTH' Number of periods of the moving average)
The upper band is calculated by adding the value of the simple moving average X times the standard deviation of the moving average. ('BB MULTIPLIER' Number of times the standard deviation of the moving average)
The lower band is calculated by subtracting the simple moving average X times the standard deviation of the moving average.
the band between the upper and lower bands contains, statistically, almost 90% of the possible price variations, which means that any movement of the price outside the bands has special relevance.
In practical terms, Bollinger bands behave as if they were an elastic band so that, if the price touches them, it has a high probability of bouncing.
Sometimes, after the entry order is filled, the price is returned to the opposite side. If price touch the Bollinger band in the same previous conditions, another order is filled in the same direction of the position to improve the average entry price, (% MINIMUM BETTER PRICE ': Minimum price for the re-entry to be executed and that is better than the price of the previous position in a given %) in this way we give the trade a chance that the Take Profit is executed before. The downside is that the position is doubled in size. 'ACTIVATE DIVIDE TP': Divide the size of the TP in half. More probability of the trade closing but less profit.
█ STOP LOSS and RISK MANAGEMENT.
A good risk management is what can make your equity go up or be liquidated.
The % risk is the percentage of our capital that we are willing to lose by operation. This is recommended to be between 1-5%.
% Risk: (% Stop Loss x % Equity per trade x Leverage) / 100
First the strategy is calculated with Stop Loss, then the risk per operation is determined and from there, the amount per operation is calculated and not vice versa.
In this script you can use a normal Stop Loss or one according to the ATR. Also activate the option to trigger it earlier if the risk percentage is reached. '% RISK ALLOWED' wich is calculated according with: '%EQUITY ON EACH ENTRY'. Only works with Stop Loss on 'NORMAL' or 'BOTH' mode.
'STOP LOSS CONFIRMED': The Stop Loss is only activated if the closing of the previous bar is in the loss limit condition. It's useful to prevent the SL from triggering when they do a ‘pump’ to sweep Stops and then return the price to the previous state.
█ ALERTS
There is an alert for each leverage, therefore a maximum of 8 alerts can be set for 'long' and 8 for 'short', plus an alert to close the trade with Take Profit or Stop Loss in market mode. You can also place Take Profit limit and Stop Loss limit orders a few seconds after filling the position entry order.
- 'MAXIMUM LEVERAGE': It is the maximum allowed multiplier of the % quantity entered on each entry for 1X according to the volume condition.
- 'ADVANCE ALERTS': There is always a time delay from when the alert is triggered until it reaches the exchange and can be between 1-15 seconds. With this parameter, you can advance the alert by the necessary seconds to activate it earlier. In this way it can be synchronized with the exchange so that the execution time of the entry order to the position coincides with the opening of the bar.
The settings are for Bitcoin at Binance Futures (BTC: USDTPERP) in 15 minutes.
For other pairs and other timeframes, the settings have to be adjusted again. And within a month, the settings will be different because we all know the market and the trend are changing.

ATR with Impulse AlertsThis is a very simple script which simply plots an ATR (the built-in ATR function, using RMA) and plots a cross when the previously closed bar is larger than the ATR by a given threshold. There are also alert conditions set so you can be alerted when these impulse bars show up, either up or down bars. Have fun and safe trading!

Woodies CCI Trading System - Patterns - AlertsWoodies CCI Trading System - Patterns (Alert Mode) .
The Woodies CCI was initially designed for trading Stocks, Options and the Future Market.
However, different styles of traders can make use of it in various markets and any chart timeframes.
The Woodies CCI Trading System - Patterns takes a Strategy Builder like approach and can be easily configured to scan simultaneously for any available pattern.
The purpose of this tool is to compress everything down to 1 alert to warn of any opportunities, and it can also be automated .
To further improve the success rate , the patterns' performance can be studied with the help of the Strategy Tester .
The Strategy Tester Mode allows for instant backtesting on historical data.
It can assist in determining the right combination of patterns and exit rules , and it can help decide which patterns are better for which market.
This trading system contains all the particular features as described by Woodie, and more.
▪ Pattern Recognition (entry signals based on well-defined patterns)
- Trade patterns that are in agreement with the established trend
1. Zero-Line Reject (ZLR)
2. Trend Line Break (TLB) - with the trend
3. Horizontal Trend Line Break (HTLB) - with the trend
4. Tony Trade (TT)
5. GB100 (GB)
6. Reverse Divergence (RD)
- Trade patterns that are against the trend (these patterns indicate the possibility of a change in trend direction and are recommended for experienced traders)
1. Shamu Trade (ST)
2. The Famir Trade (FT)
3. Vegas Trade (VT)
4. Ghost Trade (GT)
5. Hook From Extreme (HFE)
6. Trend Line Break (TLB) - counter-trend
7. Horizontal Trend Line Break (HTLB) - counter-trend
▪ Exit rules
1. CCI Trend Line Breaks
2. CCI crossing back through the 100 lines
3. TCCI hooking or going flat, not moving, or no progress
4. CCI hook from extremes
5. Profit target hit
6. CCI forming a flat top formation
7. CCI crossing a Horizontal Trend Line
8. When the LSMA disagrees with the trade
9. CCI crossing the Zero-Line (ZL)
▪ WCCI Histogram coloring based on Woodie's trend definition
- Blue for Uptrend
- Red for Downtrend
- Gray for No Trend
- Yellow for trend establishment
▪ The LSMA is on the Zero-Line - it is the 25 period Least Squares Moving Average (it shows the ZL as a series of red and green segments)
- Red segments - the market price is below LSMA
- Green segments - the market price is above LSMA
▪ Chop Zone Indicator (CZI) - Positioned on the levels +100 and -100 (it shows market direction)
- Cyan shows up market
- Brown shows down market
- Multiple colors show market in a sideways mode
▪ Sidewinder Indicator (SI) - Positioned on the levels +200 and -200
- Red shows a flat or non-trending market
- Yellow shows a trending market
- Green shows a strong trending market
▪ The Woodies CCI (14) is indicated with the fuchsia color
▪ WCCI length auto-change to 20 on 1-hour chart intervals and higher
▪ The Turbo CCI (6) has a dark red color
▪ TWCCI auto-hide on 1-hour chart intervals and higher
▪ Early Alert Functionality available (eg 20 seconds before the signal is considered valid)
▪ Simplified Alerts
- An all in one alert
- Alerts for entry triggers
- Alerts for exit conditions
▪ Some Pattern Statistics are available on the chart in a panel
Simple Steps to set it up:
1 - Choose at least 1 pattern ( with-the-trend patterns are friendlier than the counter-trend ones)
2 - Choose at least 1 exit condition
3 - Set the alerts (1 for Entry and 1 for Exit, or 1 alert running for both Entry and Exit)
For Beginners:
For the new trader, the trend continuation patterns are easier to manage.
Newcomers should stick to trend-following patterns until they feel very confident!
Here are Three Entry Choices:
1 - Conservative -
Wait until the bar closes to enter - This is the easiest to execute.
2 - Conservative to Aggressive -
Woodie would like the beginner to enter the market if, with 20 seconds left in the bar, a valid CCI pattern presents itself.
3 - Very Aggressive -
Enter trade as soon as the bar indicates a signal during price bar formation. This is for experienced traders, as the signal conditions are final at the close of the bar and the intra-bar changes are not recorded.
Your implicit learned skills are put to the test here. Be fair to yourself and allow yourself time to grow and improve your skills.
You are strongly urged to follow the Option 2.
Money Management: Apply an Initial Protective Stop; Use Trade Exits; Study the past performance - Statistics (Strategy Tester Mode).
Related Tools:
Woodies-CCI Trading System - Patterns - Strategy Tester
Risk Management System (Stop Loss, Take Profit, Trailing Stop Loss, Trailing Take Profit) - it can be connected to the Woodies-CCI Trading System - Patterns - Alerts
Early/Delayed Signal Explained

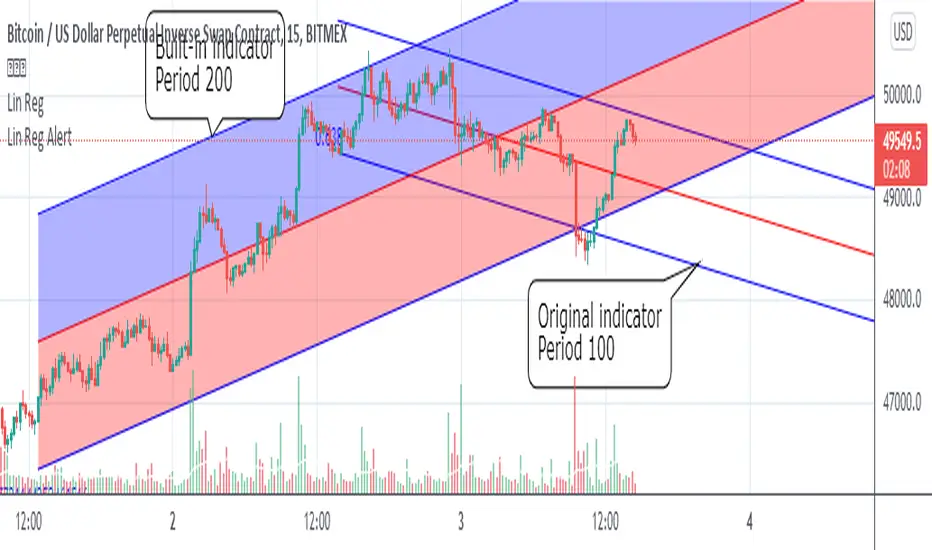
Linear Regression Channel with AlertNote: I use Google Translate.
Added alert function to "Linear regression" of built-in indicator.
I use Pine script version 4.
The basic behavior is the same as the built-in indicator,
The following points are different.
1. Fills between line objects are only lines because they do not correspond in Version 4.
2. The "Use Deviation" switch can not be reproduced, so it is displayed or hidden.
3. Line color and line width can not be changed.
4. You can use 3 types of alerts: "upper and lower channel line", "center line" and "all lines".
I get a warning of repainting, but I think there is no problem.
Please contact me if there is something wrong.
内臓インジケーターの「線形回帰」にアラート機能を追加しました。
Pineスクリプト Version4を使用しています。
基本的な挙動は内臓インジケーターと変わりませんが、
以下の点が異なります。
1.ラインオブジェクト間の塗りつぶしは、Version4で対応していないようなので線のみです。
2.「偏差を使う」の切り替えは再現できていないので、表示か非表示かになっています。
3.線色、線の太さの変更はできません。
4.「上下のチャネルライン」、「センターライン」、「すべてのライン」の3種類のアラートを使うことができます。
リペイントのWarningが出ますが、特に問題ないと思います。
何か問題があればご連絡ください。
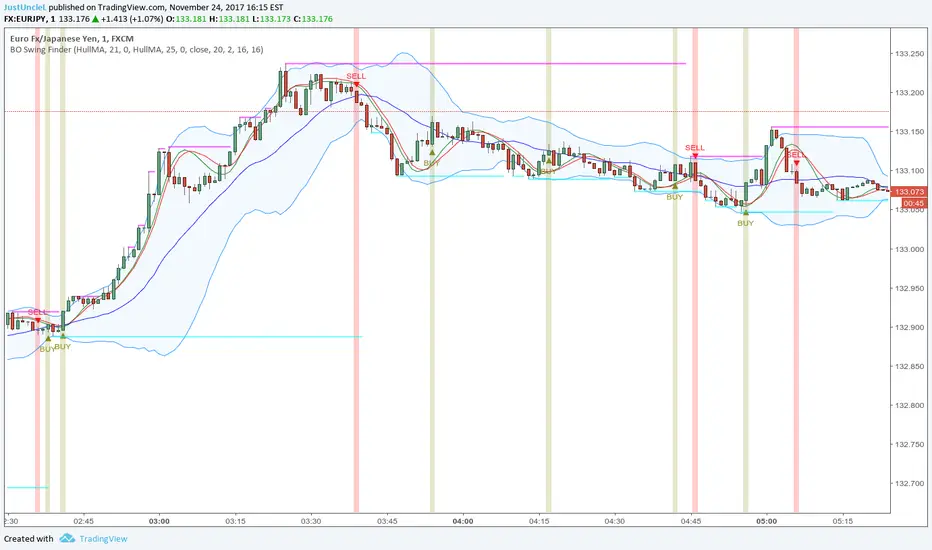
BO Swing Finder R0.6 by JustUncleLThis indicator alert study attempts to detect confirmed Swing points. It uses Bollinger Band centre line crosses as the main signal. The main detection occurs by looking for the first BB centre line cross that was initiated from outside the Bollinger Channel (alternatively KC channel can be used).
The optional HullMA (any any other MA pair) are used to confirm the swing direction. The indicator also plots the two KitKat Support and Resistance lines with optional High/Low labelling on KitKat1 lines.
This indicator tool is suitable for any time frame and can be traded with Binary Option (even 1min) orders (2-3 candle expiry) or as Forex trade orders. It is suitable for Currencies, Cryptocurrencies and Metals. May also be useful on other markets as well.
The MA filtering options, each MA line can be a different type, with an optional offset:
SMA = Simple Moving Average.
EMA = Exponential Moving Average.
WMA = Weighted Moving Average
VWMA = Volume Weighted Moving Average
SMMA = Smoothed Simple Moving Average.
DEMA = Double Exponential Moving Average
TEMA = Triple Exponential Moving Average.
HullMA = Hull Moving Average, fast moving MA.
SSMA = Ehlers Super Smoother Moving average, similar results to HullMA.
ZEMA = Near Zero Lag Exponential Moving Average.
TMA = Triangular (smoothed) Simple Moving Average.
NOTE: The signal calculations do occur on the current candle, so the state of the signal may re-build until the current candle is closed. I have designed the script to behave this way on purpose. This gives traders the option of
preparing their trade early or even taking the trade early if they want. Otherwise the trader can be more conservative and wait for signal candle to close, to give them a confirmed signal. (This is NOT re-painting as the historical signal states are fixed and will not change, unless you change some setup options.)
Hints:
1) As with all indicator and alerting tools, not all signals will yield a tradable successful swing. You need to apply you own analysis on each signal to determine the probability of success.
2) When using the MA to filter the signals you should use it for two types of filtering:
Supportive that confirm swing like fast moving MAs with fairly short lengths, eg HullMA(21,25).
Long Term Direction with smoother longer length MAs like SMMA(180,220) to show up swings back into direction of the longer term trends.
Inspiration: @Lyiness
References:
Momentum VMA KITKAT CROSS v2.1 by vdubus (- Vdubus_Channel www.vdubus.co.uk)
N-Consecutive Candle Marker (SMA Filter & Consolidated Alert)Certainly, here is the English version of the Pine Script description for posting on TradingView.
---
## 📈 N-Consecutive Candle Marker (SMA Filter & Consolidated Alert)
### 📝 Overview
This indicator automatically displays a **signal mark** on the chart when a user-defined number ($N$) of **consecutive bullish or bearish candles** occurs.
It includes an optional **SMA (Simple Moving Average) filter** to restrict signals to conditions favoring a **short-term counter-trend (reversal) trade**. It also consolidates both bullish and bearish signals into a **single alert mechanism** for simplified management.
### ⚙️ Key Features
#### 1. N-Consecutive Candle Detection
* **Consecutive Count (N)**: The indicator detects continuous candles of the same color based on the `Consecutive Candle Count (N)` input setting.
* **Bullish Signal (Red Marker)**: A mark is placed above the high of the closing candle after the bullish sequence is complete.
* **Bearish Signal (Blue Marker)**: A mark is placed below the low of the closing candle after the bearish sequence is complete.
#### 2. SMA Filter (Counter-Trend Logic)
When **`Use SMA Filter`** is enabled, the signal conditions are filtered against the SMA, which focuses on potential **short-term bounces or pullbacks** against the broader trend.
* **Bullish Signal Condition**: The consecutive bullish candles must close **below** the SMA (`close < sma_value`). This typically targets a bounce in a downtrend.
* **Bearish Signal Condition**: The consecutive bearish candles must close **above** the SMA (`close > sma_value`). This typically targets a pullback/dip in an uptrend.
#### 3. Performance & Alert Consolidation
* **Display Limit**: Enabling **`Use Display Limit`** restricts the plotted marks to the **last N bars** defined by `Limit Display to Last N Bars`. This automatically deletes old labels, helping to **maintain chart performance**.
* **Consolidated Alert**: Both bullish and bearish signals trigger the same **single `alert()` function**, simplifying the process of setting up notifications in TradingView.
### 💡 How to Use
1. Add the indicator to your chart.
2. Set the **`Consecutive Candle Count (N)`** to your desired number of consecutive bars (e.g., 3, 4, etc.).
3. If you want to use the reversal filter, switch **`Use SMA Filter (On/Off)`** to **On**. Adjust the `SMA Period` as needed.
4. In the TradingView alert creation menu, select this indicator and choose **"Any function call"** or **"N-Consecutive Candle Marker (SMA Filter & Consolidated Alert)"** to set up your consolidated alert.
> ⚠️ **Disclaimer**: This indicator detects specific candle patterns. Always combine this signal with other forms of technical analysis and context for making trading decisions.
ご要望いただいたTradingViewに投稿する際のインジケーターの説明文として、機能、使い方、フィルターロジックに焦点を当てた文章を作成しました。
この説明文は、Pine Scriptの公開ライブラリの投稿テンプレートに合わせて、**概要、使い方、主要機能**を明確に伝える構造にしています。
---
## 📈 N-Consecutive Candle Marker (SMA Filter & Consolidated Alert)
### 📝 概要 (Overview)
このインジケーターは、設定した本数($N$)の**連続した陽線または陰線**が出現した際に、チャート上に**サイン(マーク)**を自動で表示します。
オプションで**SMA(単純移動平均線)フィルター**を適用することができ、トレンドの状況に応じた**短期的な逆張りサイン**に限定することが可能です。また、陽線サインと陰線サインを**一つのアラート**で統合して通知できるため、管理が容易です。
### ⚙️ 主要機能 (Key Features)
#### 1. N連続ローソク足の検出
* **連続本数の設定 (N)**: `Consecutive Candle Count (N)` の設定値に基づき、連続した同色ローソク足を検出します。
* **陽線サイン (Red Marker)**: 連続陽線が完了した足の高値の上にマークを表示します。
* **陰線サイン (Blue Marker)**: 連続陰線が完了した足の安値の下にマークを表示します。
#### 2. SMAフィルター (逆張りロジック)
`Use SMA Filter` を **オン** にすることで、サインの出現条件にトレンドフィルターを追加します。これは、トレンド方向に対する**一時的な反発・押し目**を狙う、**逆張り的なロジック**を採用しています。
* **陽線サインの出現条件**: 終値がSMAの**下**にある状態で、連続陽線が出現した場合。
* **陰線サインの出現条件**: 終値がSMAの**上**にある状態で、連続陰線が出現した場合。
#### 3. パフォーマンス最適化とアラート統合
* **表示制限**: `Use Display Limit` をオンにすると、描画されるマークの数を**直近のN本**に制限し、古いマークを自動で削除することで、チャート描画の**パフォーマンスを維持**します。
* **統合アラート**: 陽線・陰線どちらのサインが出た場合でも、**単一の `alert()` 関数**でメッセージを出し分けます。これにより、アラート設定をシンプルに保てます。
### 💡 使い方 (How to Use)
1. インジケーターをチャートに追加します。
2. **`Consecutive Candle Count (N)`** を希望する連続本数に設定します(例: 3本連続、4本連続など)。
3. トレンドフィルターを使用したい場合は、**`Use SMA Filter (On/Off)`** をオンに切り替えます。
4. TradingViewのアラート設定画面で、このインジケーターを選択し、**「どんな関数呼び出しでも」**または**「N-Consecutive Candle Marker (SMA Filter & Consolidated Alert)」**を選んでアラートを設定してください。
> ⚠️ **注意点**: このインジケーターは、連続足という特定のパターンのみを検出するものです。トレード判断を行う際は、他のテクニカル分析や環境認識と組み合わせてご利用ください。

MA Strength Indicator EnhancedThe "MA Strength" is an indicator that measures market trend strength or (in the case of forex pairs) the relative strength of individual currencies based on up to five different moving averages (MA). It offers multiple calculation methods, such as simple summation, normalized value, or measuring ATR/percentage distance from the price. The results are summarized in a clear table, and it provides customizable alerts for trend changes or shifts in currency strength. The high level of configurability (e.g., MA weighting, "all MA alignment" requirement) allows for fine-tuning the strategy.
💬 Interpreting the Table (Top Rows)
The top row of the table shows the final output of the indicator. This changes according to the set "Table Mode".
Trend Mode: The top row shows the final, aggregated trend status (e.g., "BULLISH", "NEUTRAL") and the corresponding "Trend Value". This is the value the indicator compares to its thresholds.
Forex Mode: (Only on 6-character pairs): The top two rows show the strength of the Base currency and the Quote currency separately.
Calculation of the top rows:
The indicator calculates the individual score of all active MAs (according to the chosen method).
Trend Value: This is the final value calculated from the scores.
If "Enable Averaging" is ON, this will be the average of the scores (e.g., MA1 score is 5.0, MA2 score is 7.0 -> Trend Value is 6.0).
If averaging is OFF, this will be the sum of the scores (e.g., 5.0 + 7.0 = 12.0).
Forex Calculation: "Forex Mode" uses this "Trend Value". If the Trend Value is +6.0 (on an EURUSD pair):
The Base currency (EUR) value will be +6.0.
The Quote currency (USD) value will be -6.0.
The indicator compares these values to the thresholds to determine the "STRONG" status for EUR and "WEAK" status for USD.
📊 Calculation Methods
The indicator can calculate trend strength using 5 methods. The final "Trend Value" is derived from the results of these calculations.
Sum:
Description: Simply adds up the individual scores of all enabled moving averages (MA).
Formula: If the price is above an MA, it gets the "Score Above" value (e.g., +2.0); if below, it gets the "Score Below" value (e.g., -2.0).
Example: Result = (MA1 score) + (MA2 score) + ...
Normalized:
Description: Takes the sum obtained by the "Sum" method and converts it to a scale between -100% (maximally bearish) and +100% (maximally bullish). It takes into account the maximum possible positive and negative scores.
Formula: Result = (Total Score / Max Possible Score) * 100
Percentage Distance:
Description: This method also considers distance. The further the price is from the MA in percentage terms, the higher the score.
Formula: MA Score = (|Close Price - MA| / MA * 100) * Weight (The "Weight" is the "Score Above/Below" value set in settings).
ATR Distance:
Description: Similar to percentage distance, but normalizes the distance using volatility via ATR (Average True Range).
Formula: MA Score = (|Close Price - MA| / ATR) * Weight
Candle Count:
Description: Counts how many consecutive candles have been above or below the MA. It multiplies this number by the set weight.
Formula: MA Score = (Number of consecutive candles) * Weight
⚙️ Settings Options
Moving Averages (MA 1-5)
For each moving average, you can set:
Enable MA: Turn the specific MA on or off.
Type: The type of moving average (SMA, EMA, WMA, etc.).
Period: The period of the MA (e.g., 50, 200).
Score Above / Below: The most important setting. This defines the "weight" of the MA in the calculation. In "Sum" mode, this is a fixed score; in distance-based modes, this is a multiplier (weight). It is advisable to write a positive number for "Score Above" and a negative number for "Score Below".
Calculation Settings
Enable Averaging: If this is on, the indicator shows the average of the active MA scores, not the total score.
Exception: This function is not available in "Normalized" mode.
Require All MA Alignment: This is a strict filter. If enabled, the indicator only gives a "BULLISH" (or "STRONG") signal if the price is above all enabled moving averages. Similarly, a "BEARISH" signal only occurs if the price is below all moving averages. If the price is on the opposite side of even just one MA (e.g., above 4, below 1), the status becomes "NEUTRAL", regardless of the scores.
Strength / Trend Thresholds
Enable Extra Levels: If active, statuses are expanded: "EXT. BULLISH" / "EXT. BEARISH" (Trend mode) or "EXT. STRONG" / "EXT. WEAK" (Forex mode). This indicates stronger, overbought/oversold conditions.
Threshold setting: The thresholds (e.g., "Strong Above - ATR") determine when the calculated value counts as a "STRONG" or "WEAK" status.
🔢 Setting Thresholds via Calculation
If "Enable Averaging" is OFF, the "Trend Value" shown in the table will be the sum of the individual MA scores. Therefore, we must define the threshold by adding up the minimum expected performance from each moving average. This allows us to set different expectations for short, medium, and long-term averages.
Step 1: Determine MA weights
In our example, we use 3 active MAs with the following weights (Score Above values):
MA1 (Short): Weight = +2
MA2 (Medium): Weight = +3
MA3 (Long): Weight = +4
Step 2: Determine the minimum expected distance
Define a minimum distance expected from each MA to trigger a "Strong" signal.
Step 3: Calculate target scores and the final threshold
Note: If "Enable Averaging" is ON, the resulting value (sum of target scores) must be
averaged to get the final threshold.
Example 1: ATR Distance
-Goal: I want a "Strong" signal if the price is...
...at least 1.0 ATR above MA1 (Short),
...at least 1.5 ATR above MA2 (Medium),
...and at least 2.0 ATR above MA3 (Long).
-Calculation (Expected Distance * Weight):
MA1 Target Score: 1.0 * 2 = 2.0
MA2 Target Score: 1.5 * 3 = 4.5
MA3 Target Score: 2.0 * 4 = 8.0
-Final Threshold (Sum of Target Scores): 2.0 + 4.5 + 8.0 = 14.5
-Setting: Set "Strong Above - ATR" threshold to 14.5.
If "Enable Averaging" is ON, the obtained value must be averaged, and the result will be the
threshold: 4.8 (14.5 / 3 = 4.83).
Example 2: Percentage Distance
-Goal: I want a "Strong" signal if the price is...
...at least 0.5% above MA1,
...at least 1.0% above MA2,
...and at least 1.5% above MA3.
-Calculation (Expected Distance * Weight):
MA1 Target Score: 0.5 * 2.0 = 1.0
MA2 Target Score: 1.0 * 3.0 = 3.0
MA3 Target Score: 1.5 * 4.0 = 6.0
-Final Threshold (Sum): 1.0 + 3.0 + 6.0 = 10.0
-Setting: Set "Strong Above - Percentage" threshold to 10.0.
If "Enable Averaging" is ON, the obtained value must be averaged, and the result will be the
threshold.
Example 3: Candle Count
-Goal: I want a "Strong" signal if...
...at least 3 consecutive candles are above MA1,
...at least 5 consecutive candles are above MA2,
...and at least 10 consecutive candles are above MA3.
-Calculation (Expected Candle Count * Weight):
MA1 Target Score: 3 * 2.0 = 6.0
MA2 Target Score: 5 * 3.0 = 15.0
MA3 Target Score: 10 * 4.0 = 40.0
-Final Threshold (Sum): 6.0 + 15.0 + 40.0 = 61.0
-Setting: Set "Strong Above - Candle" threshold to 61.0.
If "Enable Averaging" is ON, the obtained value must be averaged, and the result will be the
threshold.
Example 4: Sum
In this mode, distance does not matter, only whether the price is above or below the MA.
-Goal: "Strong" signal if the price is above the long-term averages, but can be below the short-term (MA1).
MA1 (Short): Can be below (Weight: -2.0)
MA2 (Medium): Must be above (Weight: +3.0)
MA3 (Long): Must be above (Weight: +4.0)
-Calculation: -2.0 + 3.0 + 4.0 = 5.0
-Setting: Set "Strong Above - Sum" threshold to 5.0.
If it must be above all three moving averages, the threshold would be 2.0 + 3.0 + 4.0 = 9.0.
If "Enable Averaging" is ON, the obtained value must be averaged, and the result will be the
threshold.
Example 5: Normalized
The basic logic is similar to the "Sum" method.
-Goal: "Strong" signal if price is above MA2 and MA3, but potentially below MA1.
-Calculation: Target Sum: 5.0. Max Possible Score (above all): 9.0.
-Threshold: (5.0 / 9.0) * 100 = 55.5
In this calculation method, averaging cannot be set.
The Usage of the "ATR %" Row
The "ATR %" row shows the percentage movement of an average candle.
How to use this with "Percentage Distance" mode:
This number gives a baseline. It helps decide if the "Percentage Distance" threshold is realistic.
Example: You see the "ATR %" value is hovering around 1.2%. This means a "normal" candle moves about 1.2%.
If you set the Percentage threshold to 0.5%, it is too low. The indicator will constantly give a "Strong" signal because even average movement (noise) exceeds the threshold.
Correct Usage: If "normal" movement is 1.2%, then a "strong" movement (trend) needs to be significantly larger. For example, set the threshold to double the ATR %: 2.4 (2 * 1.2). Thus, you only get a "Strong" signal if the movement is twice the average volatility.
Supplementary Information
Rounding Differences:
The numbers displayed in the table and the precision of calculations in the background differ.
Table Display: The indicator rounds numbers to two decimal places in the table. So, if the value is 0.996, the table shows 1.00 (rounded up).
Internal Calculation: The background calculation uses much higher precision. When determining status (STRONG vs NEUTRAL), the program compares the precise, unrounded value to the threshold.
Result: Due to rounding, it may happen that if the threshold is 1.00 and the table shows 1.00, the status flickers between Strong and Neutral. If this is bothersome, it is advisable to set a slightly lower threshold (e.g., 0.98).
🔔 Alert Settings
The indicator can send alerts when the status changes.
Alert Method:
Trend: Alerts when the main trend status changes (e.g., from "NEUTRAL" to "BULLISH"). You can specify which direction to alert for (e.g., only "BULLISH").
Forex: Works only on 6-character forex pairs. You can set separate alerts for the Base or Quote currency.
Forex Strength Level: You can specify at which status level to alert (e.g., "WEAK" or "EXT. STRONG").
📈 Trading Tips
Trend Confirmation: Use the "BULLISH" / "BEARISH" status to confirm your existing strategy (e.g., breakouts, bounces off support).
Forex Pairing: In Forex mode, look for pairs where the Base currency is "STRONG" and the Quote currency is "WEAK" (or "EXT. STRONG" / "EXT. WEAK") for a long position.
Short Position: Reverse the above (Base: WEAK, Quote: STRONG).

XAutoTrade Alert Builder v1.1Automate Your NinjaTrader Trading with TradingView Alerts
The XAutoTrade Alert Builder is a flexible Pine Script strategy that bridges TradingView alerts with
NinjaTrader automated trading. Design custom entry signals, configure exit strategies, and execute trades
automatically on your NinjaTrader account - all from TradingView charts.
Key Features
📊 Flexible Signal Logic
- Configure buy/sell signals independently
- Compare any two indicators or price sources using crossover, crossunder, greater than, or less than
logic
- Visual buy/sell markers on chart for easy signal verification
🎯 Multiple Exit Methods
1. ATM Strategy - Leverage your existing NinjaTrader ATM templates for advanced order management
2. Source Signals - Exit positions based on opposite entry signals
3. Fixed Levels - Set stop loss and profit targets using ticks or percentage
⚙️ NinjaTrader Integration
- Direct webhook integration with XAutoTrade backend service
- Multi-account support (trade multiple accounts simultaneously)
- Position sizing and max position limits
- Market or limit order types with configurable offset
- Time-in-force options (DAY/GTC)
- Active hours filter (US ET timezone) to control when alerts execute
🔐 Secure & Reliable
- Webhook secret authentication
- Symbol override capability
- Real-time status indicator showing configuration readiness
How It Works
1. Configure Entry Signals - Choose your buy/sell logic by comparing any two data sources (price,
indicators, etc.)
2. Set Exit Strategy - Select ATM templates, signal-based exits, or fixed stop/profit levels
3. Connect to NinjaTrader - Enter your XAutoTrade webhook secret and account details
4. Create Alert - Use the strategy's alert system to send formatted JSON payloads to your XAutoTrade
webhook
5. Trade Futures & Stocks Automatically - TradingView alerts trigger real trades in your NinjaTrader account
Perfect For
- Traders wanting to automate TradingView strategies in NinjaTrader
- Users with existing ATM templates who want TradingView signal automation
- Multi-account traders managing several NinjaTrader accounts
- Anyone seeking a no-code bridge between TradingView and NinjaTrader
Requirements
- Active XAutoTrade account and subscription
- NinjaTrader 8 with XAutoTrade AddOn installed
- TradingView Premium/Pro account (for webhook alerts)

Reversal Zones — entry + anchored exit + alerts (fixed)Script Description — Reversal Zones (Entry + Anchored Exit + Alerts)
This indicator automatically identifies potential reversal points in price action using a pattern of 4–5 consecutive candles in one direction followed by a reversal candle.
It then calculates dynamic Buy and Sell Zones based on the average range of recent candles and plots them visually on the chart — helping you identify ideal entry and exit zones with clean precision.
⚙️ How It Works
Pattern Detection:
Looks for 4–5 consecutive candles of the same color (bullish or bearish).
When the next candle reverses direction, that point becomes the reference candle.
Zone Calculation:
Takes the average of the last N candle ranges (default = 5).
X = Average candle range
Y = X ÷ Divisor (default = 10)
Plots:
BUY Zone – Below the low of the bullish reversal candle
(two lines: Low - X and Low - X - Y)
SELL Zone – Above the high of the bearish reversal candle
(two lines: High + X and High + X + Y)
Anchored Zones:
After a Buy signal, the indicator monitors for a new swing high and anchors a Sell zone there.
After a Sell signal, it monitors for a swing low and anchors a Buy zone there.
The original entry zone remains visible and is never overwritten.
Zone Extension:
Each zone extends to the right for a configurable number of bars (extendBars, default = 20).
🔔 Alerts
The script includes built-in alert conditions:
Buy Zone Hit → Triggers when price enters/touches any Buy Zone (entry or anchored).
Sell Zone Hit → Triggers when price enters/touches any Sell Zone (entry or anchored).
You can create alerts by:
Clicking Add Alert (🔔) on the chart.
Selecting this script as the condition.
Choosing Buy Zone Hit or Sell Zone Hit.
Setting alert frequency to “Once Per Bar Close”.
🎨 Customizable Inputs
Candle count (N) → Number of candles used to calculate average range.
Divisor → Controls Y distance (refines zone width).
Extend lines right → Number of bars to extend each zone line.
Minimum / Maximum consecutive candles → Controls pattern sensitivity.
Colors, line width, and label visibility are all adjustable.
💡 Best Use Cases
Identify reversal entry zones in trend exhaustion areas.
Combine with volume spikes or RSI divergence for confluence.
Use alerts for potential option writing or countertrend setups.
🧩 Credits
Created by Neeraj Sakharkarr
Designed for traders who want clean, rule-based reversal setups with automatic entry/exit zones.

Test for firing alerts on candle openThis fires an alert on every candle open. Nice to use if you need to test the performance of TradingView Alerts.
Auto Fibonacci Retracements with Alerts [SwissAlgo]AUTO-FIBONACCI RETRACEMENT: LEVELS, ALERTS & PD ZONES
Automatically maps Fibonacci retracement levels with Premium/Discount (PD) zones and configurable alerts for technical analysis study.
------------------------------------------------------------------
FEATURES
Automatic Fibonacci Levels Detection
Identifies swing extremes (reference high and low to map retracements) from a user-defined trend start date and trend indication automatically
Calculates 20 Fibonacci levels (from -2.618 to +2.618) automatically
Dynamically updates Fib levels as price action develops, anchoring the bottom (in case of uptrends) or the top (in case of downtrends)
Detects potential Trend's Change of Character automatically
Premium/Discount (PD) zone visualization based on trend and price extremes
Visual Components
Dotted horizontal lines for each Fibonacci level
'Premium' and 'discount' zone highlighting
Change of Character (CHoCH) marker when a trend anchor breaks (a bottom is broken after an uptrend, a top is broken after a downtrend)
Adaptive label colors for light/dark chart themes
Alert System
Configurable alerts for all Fibonacci levels
Requires 2 consecutive bar closes for confirmation (reduces false signals)
CHoCH alert when a locked extreme is broken
Set up using "Any alert() function call" option
------------------------------------------------------------------
USE CASES
Two Primary Use Cases:
1. PROSPECTIVE TREND MAPPING (Real-Time Tracking)
Set start date at or just before an anticipated swing extreme to track levels as the trend develops:
For Uptrend : Place start date near a bottom. The bottom level locks after consolidation, while the top updates in real-time as the price climbs higher
For Downtrend : Place start date near a top. The top-level locks after consolidation, while the bottom updates in real-time as the price falls lower
This mode tracks developing price action against Fibonacci levels as the swing unfolds.
2. RETROSPECTIVE ANALYSIS (Historical Swing Study)
Set the start date at a completed swing extreme to analyze how the price interacted (and is interacting) with the Fibonacci levels:
Both high and low are already established in the historical data
Levels remain static for analysis purposes
Useful for analyzing price behavior relative to Fibonacci levels, studying retracement dynamics, and assessing a trading posture
------------------------------------------------------------------
HOW TO USE
Set 'Start Date' : Select Start Date (anchor point) at or just before the swing extreme (bottom for uptrend, top for downtrend)
Choose Trend Direction (Up or Down): direction is known for retrospective analysis, uncertain for prospective analysis
Update the start date when significant structure breaks occur to begin analyzing a new swing cycle.
Configure alerts as needed for your analysis
------------------------------------------------------------------
TECHNICAL DETAILS
♦ Auto-Mapped Fibonacci Retracement Levels:
2.618, 2.000, 1.618, 1.414, 1.272, 1.000, 0.882, 0.786, 0.618, 0.500, 0.382, 0.236, 0.118, 0.000, -0.272, -0.618, -1.000, -1.618, -2.000, -2.618
♦ Premium/Discount (PD) Zones:
Uptrend: Green (discount zone) = levels 0 to 0.5 | Red (premium zone) = levels 0.5 to 1.0
Downtrend: Red (premium zone) = levels 0 to 0.5 | Green (discount zone) = levels 0.5 to 1.0
The yellow line represents the 0.5 equilibrium level
♦ Lock Mechanism:
The indicator monitors for new extremes to detect a Change of Character in the trend (providing visual feedback and alerts). It locks the anchor swing extreme after a timeframe-appropriate consolidation period has elapsed (varies from 200 bars on second charts to 1 bar on monthly charts) to detect such potentially critical events.
------------------------------------------------------------------
IMPORTANT NOTES
This is an educational tool for technical analysis study. It displays historical and current price relationships to Fibonacci levels but does not predict future price movements or provide trading recommendations.
DISCLAIMER: This indicator is for educational and informational purposes only. It does not constitute financial advice or trading signals. Past price patterns do not guarantee future results. Trading involves substantial risk of loss. Always conduct your own analysis and consult with qualified financial professionals before making trading decisions. By using this indicator, you acknowledge and agree to these limitations.
3MA/EMA Alerts指标名称(中文/英文)
中文名:多均线趋势指标(带上穿与金叉提醒)
英文名:Multi MA/EMA Trend Indicator (with Price & Golden Cross Alerts)
指标功能介绍(中文)
多均线趋势指标(带上穿与金叉提醒) 是一个可自定义的均线工具,适用于趋势分析和交易信号提醒。
核心功能:
多均线显示
默认显示 EMA20,EMA80/200 可选择显示
每条均线可独立选择 EMA 或 SMA
自定义颜色和线宽
价格上穿均线提醒
当价格向上突破任意开启的均线时触发提醒
可用于捕捉短线趋势启动点
金叉提醒
当短期均线向上穿过中长期均线时触发提醒
可用于捕捉潜在的趋势反转或加速
中文 UI
参数和提醒信息均为中文,便于快速理解和使用
适用场景
趋势确认
趋势反转捕捉
短线入场和长期持仓参考
Indicator Description (English)
Multi MA/EMA Trend Indicator (with Price & Golden Cross Alerts) is a customizable moving average tool for trend analysis and trading alerts.
Key Features:
Multiple Moving Averages
Default display: EMA20; EMA80/200 optional
Each MA can be set as EMA or SMA individually
Customizable colors and line widths
Price Cross Alerts
Alerts when price crosses above any active MA
Helps identify short-term trend initiation points
Golden Cross Alerts
Alerts when a short-term MA crosses above a mid/long-term MA
Useful for detecting trend acceleration or reversal signals
User-Friendly Interface
Parameters and alerts are labeled in Chinese (can be translated)
Applications
Trend confirmation
Trend reversal detection
Short-term entries and long-term position guidance

Feza Feza Upper and Lower Band with AlertsFeza Feza Upper and Lower Band with Alerts. Feza Feza Upper and Lower Band with Alerts. Feza Feza Upper and Lower Band with Alerts. Feza Feza Upper and Lower Band with Alerts. Feza Feza Upper and Lower Band with Alerts.
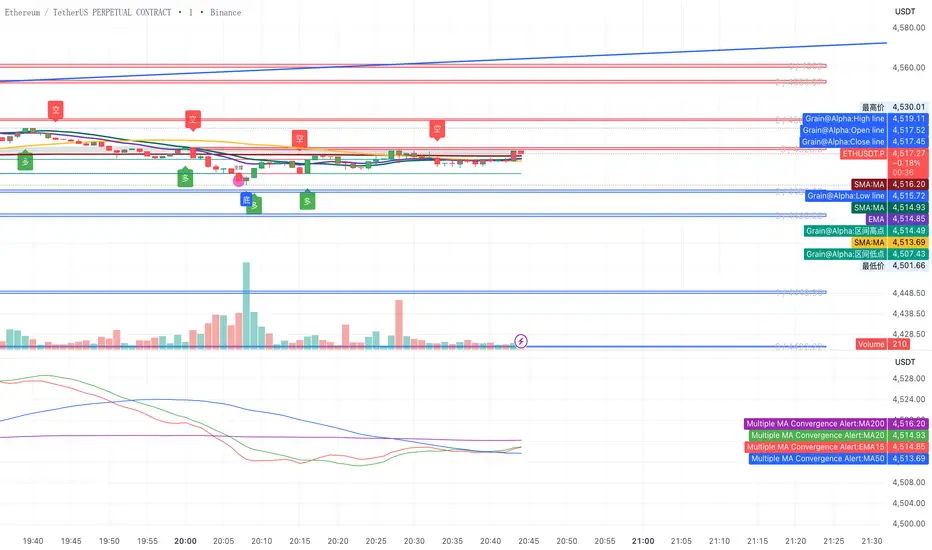
ma btc Multiple MA Convergence Alertbtc and eth ma15 20 50 200if converge
alert("EMA15, MA20, MA50, MA200 are converging/overlap crossing!", alert.freq_once_per_bar_close)
EMA 200 MultiTF G/R + Cross Alerts by LifeHack Trader1. Indicator Setup
The script starts by defining the version of Pine Script (v5) and creating an indicator called "EMA 200 MultiTF G/R + Cross Alerts by LifeHack Trader."
The overlay=true parameter ensures that the indicator is plotted directly on the price chart.
2. Function to Get EMA200
A custom function getEma200 is defined to retrieve the 200-period Exponential Moving Average (EMA) for a specified timeframe (tf).
This function uses the request.security function to fetch the close price's EMA from different timeframes.
3. Calculate EMA200 for Multiple Timeframes
The script calculates the EMA200 for four timeframes: 15 minutes ("15"), 1 hour ("60"), 4 hours ("240"), and 1 day ("D").
These values are stored in variables (ema15, ema1h, ema4h, ema1d) and represent the EMA for each timeframe.
4. Determine Price Above or Below EMA200 (G/R)
For each timeframe, the script checks whether the closing price is above or below the EMA200.
It uses boolean checks to determine if the price is above the EMA200, assigning the status "G" (Green) for above and "R" (Red) for below.
5. Cross Signal Detection (Up/Down)
The script detects crossovers and crossunders between the price and EMA200 for each timeframe.
A crossover signal is detected when the price crosses above the EMA200 (bullish), and a crossunder signal is detected when the price crosses below the EMA200 (bearish).
These signals are stored in separate variables (crossUp, crossDown).
6. Display a Table with G/R Status and Cross Alerts
A table is created and displayed in the top-right corner of the chart. The table shows the status (G or R) for each timeframe and the cross signal (▲ for crossover, ▼ for crossunder, or - for no cross event).
The table is updated with the respective values for each timeframe every time a new bar is formed.
7. Alert Conditions
The script defines alert conditions based on the crossovers and crossunders.
When a price crosses above the EMA200 (cross-up), an alert is triggered for a potential buy opportunity. When the price crosses below the EMA200 (cross-down), an alert is triggered for a potential sell opportunity.
Alerts are configured for each timeframe (15 minutes, 1 hour, 4 hours, and 1 day).
This script provides a comprehensive system for monitoring price action relative to the EMA200 on multiple timeframes, highlighting crossovers, and delivering visual feedback and alerts based on the price's relationship with the EMA.

15/30M Alerts"X Candle Close":
Same as in 5m Enter alert: it's really helpful to wait for a 15m/30m candle to be confirmed, to see f. e. whether a candle really broke a support / resistance or not - and to prevent making bad decisions.
More infos: www.reddit.com
