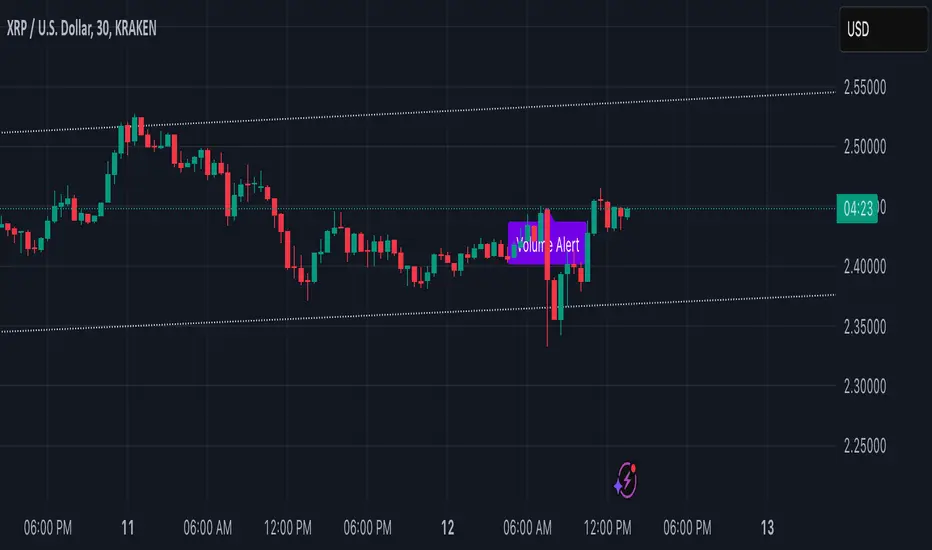
Volume Alert with Adaptive Trend - MissouriTimElevate your market analysis with our "Volume Alert with Adaptive Trend" indicator. This powerful tool combines real-time volume spike notifications with a sophisticated adaptive trend channel, providing traders with both immediate and long-term market insights. Customize your trading experience with adjustable volume alert thresholds and trend visualization options.
Features Summary
Volume Alert Features:
Volume Spike Detection:
Alerts you when volume exceeds a user-defined multiplier of the 20-period Simple Moving Average (SMA) of volume, helping identify potential market interest or significant price movements.
Visual Notification:
A "Volume Alert" label appears on the chart in a striking purple color (#7300E6) with white text, making high volume bars easily noticeable.
Customizable Sensitivity:
The volume spike threshold is adjustable, allowing you to set how sensitive the alert should be to volume changes, tailored to your trading strategy.
Alerts:
An alert condition is set to notify you when a volume spike occurs, ensuring you don't miss potential trading opportunities.
Adaptive Trend Features
Adaptive Channel:
Visualizes market trends through a dynamic channel that adjusts to price movements, offering insights into trend direction, strength, and potential reversal points.
Lookback Period:
Choose between short-term or long-term trend analysis with a toggle that adjusts the calculation period for the trend channel.
Channel Customization:
Fine-tune the trend channel with options for deviation multiplier, line styles, colors, transparency, and extension preferences to match your visual trading preferences.
Non-Repainting:
The trend lines are updated only on the current bar, ensuring the integrity of historical data for backtesting and strategy development.
Integrated Utility
Combination of Tools: This indicator marries the immediacy of volume alerts with the strategic depth of trend analysis, offering a comprehensive view of market dynamics.
User Customization: With inputs for both volume alerts and trend visualization, the indicator can be tailored to suit various trading styles, from scalping to swing trading.
This indicator ensures you're always in tune with market movements, providing crucial information at a glance to inform your trading decisions.
Cerca negli script per "alert"
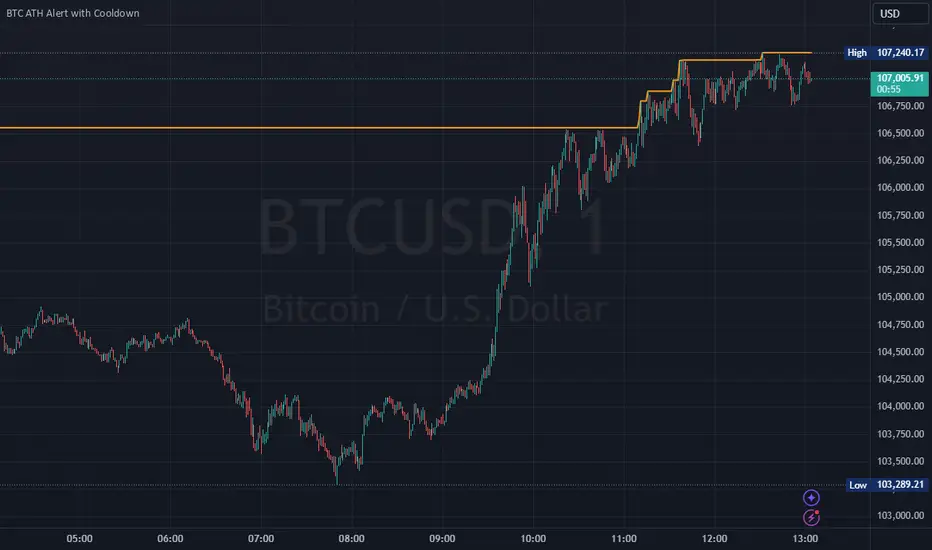
Bitcoin All-Time High (ATH) Alert with Cooldown₿ Bitcoin All-Time High (ATH) Alert with Cooldown 🚀👩🚀
🔍 What it does:
This indicator tracks new all-time highs (ATHs) and alerts you when Bitcoin (or any asset) reaches a fresh ATH, while avoiding alert spam with a customizable cooldown period.
✨ Key Features
✅ Alerts for New ATHs: Never miss when Bitcoin makes history!
✅ Cooldown Period: Prevents multiple alerts within a short timeframe (customizable in settings).
✅ ATH Line on Chart: A clear, visual line marking the all-time high price.
✅ Manual Reset Option: Reset the ATH for testing or specific chart conditions.
⚙️ How to Use
Add the Indicator: Apply it to your chart like any other indicator. Ideally on a small time frame, the cooldown is 20 bars by default (adjustable) which gives 20 minutes on the 1 min chart.
Customize Settings:
- Cooldown Period (bars): Set the number of bars to wait before triggering another alert (e.g., 20 bars).
- Show All-Time High Line: Toggle to display or hide the ATH line visually.
- Reset All-Time High: Use this to manually reset the ATH to the current bar's high.
Create an Alert:
Open the "Alerts" menu.
Select the condition: "New All-Time High" .
Choose a trigger type:
Once Per Bar: For immediate alerts when a new ATH occurs.
Once Per Bar Close: To confirm the ATH at the end of each bar.
🛠️ Who is it for?
Traders and HODLers who want to stay on top of price action.
Anyone looking for clean and efficient ATH tracking with no redundant alerts
🚀 Never miss a new ATH again. Stay ahead of the market!
Hull MA with Alerts and LabelsThis script is designed to help traders visually track market trends using various types of moving averages (MAs) and to receive alerts when certain conditions are met. Here’s a detailed breakdown of how the script works:
1. User Inputs and Customization:
MA Length: Traders can define the length of the moving average (default is 100).
Confirmation Candles: The trader can specify how many candles must confirm a trend before the script triggers a signal (default is 1).
MA Variation: The trader can choose between different moving average types: Simple Moving Average (SMA), Exponential Moving Average (EMA), Weighted Moving Average (WMA), or Hull Moving Average (HMA).
Source: Traders select the price source for the moving average calculation (e.g., close price).
Ribbon Transparency: Allows control over the transparency level of the ribbon plotted between the moving averages.
Bullish/Bearish Ribbon Colors: The user can choose the colors for bullish and bearish trends.
2. Moving Average Calculations:
The script provides multiple options for calculating moving averages:
SMA (Simple Moving Average)
EMA (Exponential Moving Average)
WMA (Weighted Moving Average)
HMA (Hull Moving Average)
For the Hull Moving Average (HMA), it uses a specific formula that smoothens the movement and reduces lag, which is helpful for more reactive trend detection.
3. Plotting Moving Averages and Trend Ribbon:
The script calculates two key moving averages:
MHULL: The main moving average, selected based on the user’s chosen MA variation and source.
SHULL: A shifted version of the MHULL to help compare trends (shifted by 2 bars).
These two moving averages are plotted on the chart for visualization. MHULL is plotted in green (or another color if changed), while SHULL is plotted in red. A ribbon is drawn between MHULL and SHULL to indicate trends visually. The ribbon changes color depending on whether the trend is bullish (MHULL > SHULL) or bearish (MHULL < SHULL). The ribbon’s transparency can be adjusted for visual clarity.
4. Trend Detection:
Bullish Trend: The script checks if the price has closed above MHULL for the defined number of confirmation candles. If confirmed, a bullish trend is detected.
Bearish Trend: Similarly, the script checks if the price has closed below SHULL for the confirmation period, indicating a bearish trend.
The script tracks whether the market is in a bullish or bearish trend and prevents repeated signals by remembering the current trend state.
5. Alerts and Labels:
Bullish Alerts and Labels: When a confirmed bullish trend is detected (i.e., price closes above MHULL for the entire confirmation period and MHULL > SHULL), the script triggers an alert notifying the trader of the bullish condition. A "BULLISH" label is placed on the chart near the low of the candle where the trend was confirmed.
Bearish Alerts and Labels: If a confirmed bearish trend is detected (i.e., price closes below SHULL for the confirmation period and MHULL < SHULL), the script triggers an alert for the bearish condition. A "BEARISH" label is placed on the chart near the high of the candle where the trend was confirmed.
These alerts and labels help traders act quickly on trend changes and align their trading strategy with market conditions.
6. Practical Use for Traders:
For traders, this script offers:
Customizability : It allows traders to define the length and type of moving averages, choose price sources, and control how signals are confirmed.
Visual Trend Representation : The plotted MA lines and colored ribbons help traders easily see market direction.
Early Warnings : With alerts and labels, the script gives traders early signals when trends are shifting, allowing them to adjust positions accordingly.
Trend Confirmation : The script waits for a user-defined number of confirmation candles before signaling a new trend, reducing false signals.
Overall, the script helps traders automate their strategy by tracking moving averages and alerting them when key trend conditions are met.

[TTI] ATR Trailing Stop Alerts––––HISTORY & CREDITS 🏦
The Trailing Stop Alert is a TradingView indicator developed by TintinTrading, which is designed to help traders manage their positions by updating and alerting them about their trailing stop levels. This tool is a valuable addition to a trader's arsenal, as it automates the process of maintaining trailing stop levels and alerts the user when they are updated or hit.
––––WHAT IT DOES 💡
The Trailing Stop Alert indicator calculates trailing stop levels based on the Average True Range (ATR) of an asset over a specified lookback period. It takes user inputs for trail type (Long or Short), lookback period, ATR length, ATR multiplier, and bar time. The indicator can be applied to any financial instrument and will dynamically update the trailing stop level based on price action. When the trailing stop level is updated or hit, the indicator generates alerts to inform the user of these events.
––––HOW TO USE IT 🔧
1. Add the Trailing Stop Alert indicator to your TradingView chart.
2. Configure the settings according to your preferred parameters:
👉Trail Type: Choose between "Long" or "Short" based on your trading position.
👉Lookback: Set the number of bars to look back for determining the highest high or lowest low.
👉ATR Length: Set the period for calculating the Average True Range.
👉ATR Multiplier: Set the multiplier to adjust the trailing stop distance.
👉Bar Time: Set the time at which the indicator starts updating the trailing stop levels.
3. The indicator will plot the trailing stop level on the chart, and update it as the price action unfolds.
4. When the trailing stop level is updated or hit, you will receive an alert in the form of a message with the new level or a notification that the stop has been hit.
5. Adjust your stop loss orders accordingly based on the trailing stop levels provided by the indicator.
By using the Trailing Stop Alert indicator, you can effectively manage your positions and reduce the risk of giving back profits in a trade.

Glow-Node AlertsGlow Node Multi Pair Alerts
This indicator allows you to set a single alert in trading view while being alerted of Glow Node auto pilot signals from up to 32 forex pairs.
How to Use
Simply open the indicator on screen.
By default the indicator will have all forex pairs unselected.
Open the settings and toggle the forex pair you would like to set an alert for in the current timeframe.
(Alert signals are optimised using our glow node auto pilot feature. These alerts cant be used with custom settings due to the pair switching.)
Set an alert in trading view and select the drop down.
Select Glow Node Multi alerts and your good to go......
Supported Pairs:
XAUUSD
XAGUSD
AUDCAD
AUDCHF
AUDJPY
AUDNZD
AUDUSD
CADCHF
CADJPY
CHFJPY
EURAUD
EURCAD
EURCHF
EURGBP
EURJPY
EURNZD
EURUSD
GBPAUD
GBPCAD
GBPCHF
GBPJPY
GBPNZD
GBPUSD
NZDCAD
NZDCHF
NZDJPY
USDCAD
USDCHF
USDJPY
BTCUSD
ETHUSD
LTCUSD

Argo II - (alerts for 3commas composite bots) - publicThis script lets users create BUY/SELL alerts for 3commas composite bots (1 alert = 12 pairs) in a simple way, based on a built in set of indicators that can be tweaked to work together or alone through the study settings.
There is a version of this script for single pair bots, with slightly more features here .
If the user choses to create both BUY and SELL signals from the study settings, the (1) alert created will send both BUY and SELL signals for all 12 pairs selected. At this stage, the script forces the user to select 12 pairs in the study settings. If less pairs are inserted, it will not work. Also, the script will only send alerts for the pairs selected in the study settings, not for the current chart (if different).
How to use:
- Add the script to the current chart
- Open the study settings , insert bot details and select 12 pairs. You should write the pairs manually, using the format BTC , ADA, ETH, etc. They MUST be in capital letters or 3commas will not recognize them.
- Still in the study settings, tweak the deal start/close conditions from various indicators until happy. The study will plot the entry / exit points below the current chart (1 = buy, 2 = sell)
- Make sure your strategy works for all the pairs you have selected, simply by checking each chart with the same study settings
- When happy, right click on the "..." next to the study name, then "Add alert'".
- Under "Condition", on the second line, chose "Any alert () function call". Add the webhook from 3commas, give it a name, and "create".
That's it.
Notes:
- If you insert coins that are not available for the quote currency and exchange of your choosing, the script will not work and return an error.
- Make sure you run tests with paper trading or dummy bots (i.e without actual bot ID) to ensure your alerts trigger as intended on all coins.
- If alerts trigger too much (i.e they all trigger at the same time for all coins), Trading View will stop the alert. So probably not ideal for a scalping bot. It could also be the sign the script doesn't work as intended.
- The script is a bit slow on my side. I am a beginner in pinescript, so if anyone knows how to simplify it, please let me know.
- if anyone knows how to tell the script to function with less than 12 pairs (when not filling the 12 fields in the setting), please also let me know :)
Traders Hedge - Pro with AlertsDear Traders,
"You can't connect the dots looking forward; you can only connect them looking backwards. So you have to trust that the dots will somehow connect in your future." ~Steve Jobs
This quote from Steve Jobs, explains the very essence of this indicator.
Trading is Simple, Why make it complicated. ~ Ravi Chandran
The main motto building this Traders Hedge - Pro indicator is to equip retail traders with a multi purpose tool which in itself will act as a complete trading setup.
This indicator will help you in understanding the market structure and planning your possible entries & exits well in advance.
The indicator & setup is independent of time frames & will work for all trading instruments.
Traders Hedge - Pro Indicator with Alerts you can also set Alerts on your favourite scripts and time frames, to get notification when a Demand or a Supply Zone is created or any Price rejection is formed.
List of all the features is provided below.
1. Trade Type - A quick auto setup for Intraday or Swing trades
2. CPR - Identifies the market structure and helps to plan mean reversions trade setups
3. Weekly Support & Resistance - Automatically identifies and displays the higher time frame support & resistance levels
4. Price Action Triggers - Alert with a trigger symbol shown on the respective candle where a possible price reversal is expected
5. Targets - Plots the possible Major & Minor targets, which helps in planning our possible profit booking & stop loss zones
6. Developing Pivots - Plots the price mean reversion zones for the upcoming trading session
7. Supply & Demand Zones - Plots the demand and supply zones by changing the color of the candle
8. Dynamic Dz & Sz Price Tracking - It dynamically identifies and plots the support & resistance levels
9. Opening Range - Plots the identified opening range on the chart
10. PEMA - Helps in visualizing the trend and also acts as a dynamic support & resistance levels
To set Alerts follow the steps provided below.
1. Go to the symbol chart and select the time frame on which you want to set Alerts.
2. Select Alerts Tab and click on Create Alert, shortcut key Alt+A
3. In Condition Select the option “Price Rejection Alerts“ or “Zone Alerts“ for which you want the alerts to be shown
4. In Options, select Once Per Bar Close
5. Select expiry as per your preference or keep it open-ended
6. Select Alerts Actions as per your preference
7. Alert name is optional
8. Default message is “Price Rejection Alerts“ or “Zone Alert” and can be modified
9. Click on Create and in the warning window select Continue Anyway
How to get the indicator:
To know more about the indicator & to download please check the link in the signature below.
Once you have active alert, you will keep getting notification whenever a Price rejection or new Demand / Supply zone gets created in the identified symbol and time frame you have selected.
Please do feel free to use the indicator and give your valuable feed backs which will help me in optimizing it to a great extent.
I would love to thank each of the traders in this Trading View community in helping me improve on my trading skills.
Happy Trading!

EMA CrossoversUseful for identifying and receiving alerts about uptrends and downtrends.
This script uses two Exponential Moving Averages (EMAs) to find price uptrends and downtrends. An Exponential Moving Average (EMA) is a type of moving average that places a greater weight and significance on the most recent data points. The script produces uptrend and downtrend signals based on crossovers and divergences between the two EMAs, the user will be able to spot a trend change (when the EMAs crossover) and to determine the strength of the current trend (when the EMAs diverge). It is also posible to get alerts for uptrends and downtrends on the web and mobile app with sound and pop-ups as well as via email. The optimal time to enter and exit the market can be concluded from this trend changes.
The user can set their own EMAs, by default they are set to 21 and 55 periods for medium and long term respectively. When the medium term EMA crosses below the long term EMA the asset is in a downtrend and the price will decline, and when the medium term EMA crosses above the long term EMA the asset is in an uptrend and price will increase.
This scripts plots the following indicators and signals on the chart to help the user to identify trends:
1.- Medium and long term EMAs as lines overlaid on the price chart.
2.- Up green triangles above bars when the price is on an uptrend and down red triangles below bars when the price is on a downtrend.
3.- Arrows with text to indicate the start of an uptrend or downtrend.
The user can enable and disable the indicators and signals as well as set colors and shapes to their liking.
This script also lets the user create alerts for uptrends and downtrends. To create a new alert using this script follow this instructions:
1.- Once you added this script to your chart, go to the alerts panel (right on web or bottom tool bar on the mobile app) and add a new alert (alarm clock icon with a plus sign).
2.- A modal window will open. On the “Condition” dropdown menu select “EMA Crossovers”.
3.- On the next dropdown menu (right below the “Condition” one) you can select from two types of alerts “Uptrend started” and “Downtrend started”.
4.- Lastly you can set all the normal alert options and create the alert.

Demand Supply Indicator With AlertsThe Demand Supply Zone indicator with Alerts helps in identifying the Demand Supply zones on chart by pinpointing them.
The indicator looks for Demand Zone patterns, Drop-Base-Rally or Rally-Base-Rally , when such pattern is identified the indicator marks it on the chart. Likewise, if the indicator identifies Supply Zone patterns, Rally-Base-Drop or Drop-Base-Drop the indicator marks it as Supply Zone. The basing candles are changed to Blue color and the Legout candles are changed to Black color by default.
Using the Demand Supply Zone Indicator with Alerts you can also set Alerts on your favourite scripts and timeframes, to get notification when Demand Supply Zones are formed.
List of all the features is provided below.
1. You can choose which patterns the indicator should identify.
2. Number of candles in basing from 1 to 6.
3. Strength of the legout.
4. Identify follow-through patterns.
5. Hide Single Legout patterns.
6. Strength of the first legout in follow through pattern.
7. Strength of the second legout in the follow through pattern.
8. Customize Basing Color
9. Customize Legout Color
10. Display Pattern Name
11. Display Proximal and Distal Values
12. Color customization for Demand Supply Zone Labels
13. Set Alerts based on Demand Supply Zone formation
To set Alerts follow the steps provided below.
1. Go to the symbol chart and select the timeframe on which you want to set Alerts.
2. Select Alerts Tab and click on Create Alert, shortcut key Alt+A
3. In Condition Select, Demand Supply Indicator With Alerts
4. In Options, select Once Per Bar Close
5. Select expiry as per your preference or keep it open-ended
6. Select Alerts Actions as per your preference
7. Alert name is optional
8. Default message is “Zone Alert” and can be modified
9. Click on Create and in the warning window select Continue Anyway
Once you have active alert, you will keep getting notification whenever a Demand/Supply zone in identified on the symbol and time frame you selected.
Use the link below to obtain access to this indicator.

lineAlertslineAlerts is a powerful tool to define Buys, Sells and Buy-Sell lines for repeating actions.
The possibilities vary from 1 Buy and/or Sell to repetitive Buying and Selling at definable lines from a specified point in time (Year, Month, Day and Hour to begin).
lineAlerts provides:
+ optional StartBuy and optional EndSell
+ in repeat mode: optional definable ending-action (Buy or Sell, which overwrites Stop-Out/Abort)
+ buy- and sell Lines can be angled separately by using non-zero entries in the Angle %perDay parameter
+ configurable Stop Loss (Percentage, Stop-Out/Abort-Only, Flat or Angled like Buy-Sell-Lines)
+ profit calculation and effective alerts can be set further than the beginning time (ActiveAfter#Hours)
+ empty-bar-correction for lower-liquidity pairs on short timescales (automatically on)
+ optional visual extension to the right for currently active buy-sell lines
+ Slippage Max. Percentage parameter, added to order price for Buying, subtracted for Selling
(represented in the Buy-Sell markings and LastPrice lines, also calculated in Profit/Loss percentages)
+ Full Autoview Alerts automation in the Order parameters (for spot trading, this can be replaced with
your own API commands while creating or modifying the TradingView alerts):
- Separate order size entries for Buying and Selling
- Choice between Percentage or absolute Amount for both Buying and Selling
(choose the corresponding alert-drop-down option when creating an alert!)
The timeframe for running lineAlerts depends on the scale (duration) of the defined pattern.
Running on a very small resolution, e.g. 1-5 Min, is suitable for a pattern of a few days to a week at most.
This is because of the limited available historic data. Keeping your pattern lines shorter than a week on these micro-timeframes will produce accurate results/output. A pattern which may last a few weeks or even months can run flawlessly on a 1H resolution for example.
"Once per bar" is the best alert option in any case. To avoid multiple signals within 1 bar in highly volatile times, it is better to create the alert on the 1 or 4 Hour chart in stead of the daily chart for a pattern of multiple weeks for example.
lineAlerts is suitable for any timeframe on any chart which is open 24/7, like most crypto currencies.
My other published indicators contain a handy combination of new and classical indicators and oscillators.
With lineAlerts, the one defining the lines is in complete control. Results might indicate how good one is at defining trade patterns and at defining suitable stop losses, but lineAlerts is not an indicator as such.
lineAlerts is more something like a visually definable price-line alerter with various stop loss and ending options. There will be a video available with some more explaining.
WARNING:
Note that if an Autoview extension is active for the charted exchange and the according TradingView alerts are activated, it works right out of the box, so make sure to have all order decimals right...
GuidoN - December 2019, July 2020

Vertical Horizontal Moving Average [AneoPsy & alexgrover] Moving average adapting to the strength of the trend, this is made possible by using the square of the vertical-horizontal filter as a smoothing factor. Alerts are included with two different types of conditions available to the user.
Settings
Length : Period of the moving average
Src : Input data for the indicator
Alerts : Types of conditions to be used in the alerts, when set to "VHMA Direction Change" alerts are triggered once the VHMA is either rising or declining, else the alerts are based on the crosses between Src and the VHMA
Usage
The VHMA can be used as a fast or slow-moving average in a moving average crossover system, or as input for other indicators.
VHMA of with length = 25 and sma with length = 200.
VHMA with length = 25 used as input for the RSI with length = 14.
Details
The vertical-horizontal filter is a measure of the strength of the trend and lay in a (0,1) range, to calculate it you just need to divide the rolling range over with the rolling sum of the absolute price changes, squaring the result allow to get lower results with higher values of length .
Squared vertical horizontal filter with length = 50, the value is low when the market is ranging and high when trending.
To set the alerts go in the alert panel, click on create alert, and select VHMA in "condition", choose between the buy or sell alert. If Src = closing price or another indicator dependant on the closing price select in options "once per bar close", if the indicator using the opening or lagged closing prices values as input select "One per bar" instead.
Thanks
Thanks to AneoPsy for adding the color change, the idea to use two kinds of conditions for the alert, and for its feedback, you can follow him
www.tradingview.com
and finally thanks to you for reading and for your support, only one last script left for the month, then we'll start July with some pretty interesting indicators, I hope you'll like them ^^/

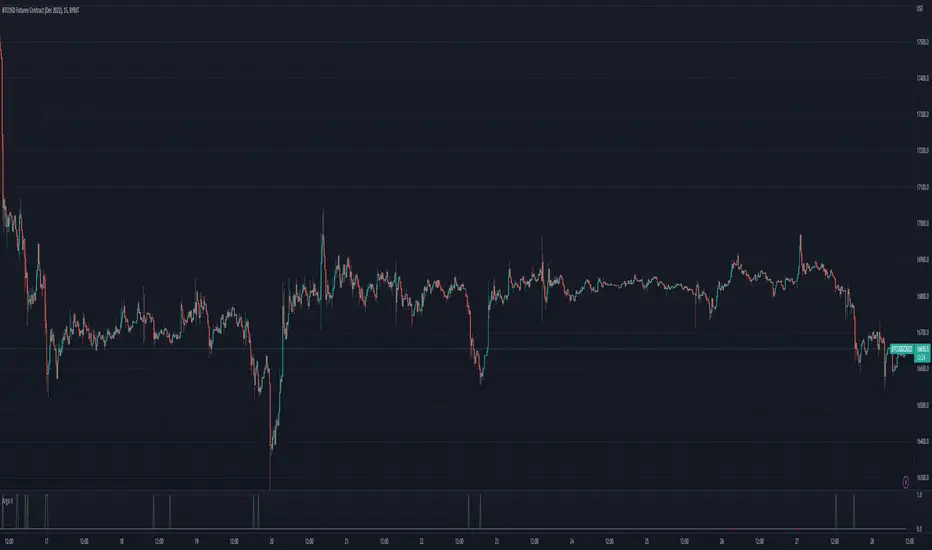
Scalp with AlertsThis is for entry alert for the strategy i posted here :
Use both on same chart. Here is how to use :
For long entries >
Go to alerts and add new alert. Choose 'Scalp with Alerts', plot3, long . Do rest settings as per your wish.
For short entries >
Choose short instead long, rest same.
Here is how to trade the whole setup:
Make sure no position is already open in same direction you want to trade(ie. long, short) .
Set the alert. Do not set alram on every bar setting. So after one ring it will deactivate .
When you get alram, open position. Place close position order at profit of 50 USD.
Do not open any new position in same direction until your this open order gets closed.
Once order closed , activate the alert again. Make sure you do not have more than one position open at same time.
User pyramid laddering technique to average your entry if price goes down after you open the position.
By using proper risk and money management you will make consistent profit. I use 25x leverage on Bitmex, you can use whatever is fit for you.
Try to avoid more then 25x leverage otherwise your portfolio can wipe out fast.
If is rainy season at my place and if you like my work, occasionally buying a coffee will boost me again.
My BTC address:
3BMEXvkAngigKesAYzi9wuBJyiCc5HxmJk
If you already bought me coffee, why not come over to inbox and have some chit chat :) .

Pivot Points High Low Multi Time Frame + AlertsThis script is a modified version of “Pivot Points High Low Multi Time Frame” for TradingView, enhanced with price alerts when the market reaches or crosses recent pivot levels.
What it does:
Detects Pivot Highs and Pivot Lows based on your chosen timeframe and bar settings.
Draws visual lines and labels at each pivot level for clear identification.
Keeps track of the latest pivot high and low values.
Triggers an alert condition when the price crosses either of those pivots.
Alert conditions included:
🔔 Price Crossed Pivot High — notifies when the price touches or moves above the last pivot high.
🔔 Price Crossed Pivot Low — notifies when the price touches or moves below the last pivot low.
How to use:
Add the script to your chart in TradingView.
Click the Alarm (🔔) icon → choose Add Alert.
Under Condition, select this indicator and pick one of the two alert types.
Choose your preferred alert frequency (Once per bar, Every time, etc.).
Tip: You can also visually see when alerts are triggered — small green and red triangles will appear above or below the bars where the price crosses a pivot.

ShockDrop Alerts v1⚡ ShockDrop Alerts — Rapid Drop & Drawdown Detector
ShockDrop Alerts helps you react instantly to sudden market shocks.
It tracks both fast price drops and intraday drawdowns, plotting clean visual arrows and sending alerts when volatility spikes — so you can respond before small dips turn into major moves.
⚙️ How It Works
• Fast Drop (FAST) – detects sharp declines (e.g. 2 % in 4 minutes) using 1-minute data across any timeframe.
• Drawdown (DD) – triggers when price trades a set percentage below the day’s session high (e.g. 2 %).
Each alert type has its own independent cooldown timer and can be toggled on or off.
🎯 What You’ll See
• FAST → 🔴 red arrow above the bar (rapid drop detection)
• DD → 🟠 orange arrow below the bar (intraday drawdown)
These appear only when your defined conditions are met. Connect them to TradingView alerts for instant popup, email, mobile, or webhook notifications.
🧭 Key Features
• Detects high-velocity price shocks in real time
• Separate cooldowns for FAST and DD triggers
• Extended-hours toggle to include pre/post-market data
• Clean, clutter-free visuals — only actionable arrows
• Uses 1-minute precision data, works on any symbol or timeframe
• Supports server-side alerts (TradingView Pro +)
📬 Why Traders Use It
• Get early warnings during flash crashes or liquidity spikes
• Automate risk-based exits when markets accelerate downward
• Track SPY, QQQ, crypto, or futures for rapid reversals
• Stay alert to high-impact news events — such as surprise policy comments, earnings releases, or market-moving presidential posts — that can cause sudden volatility
Requires TradingView Pro + for continuous server-side alerting.

TGFA Flexible Alerts Multi-MA CrossoversTGFA Flexible Alerts, Multi-MA Crossovers
Description
Flexible MA crossovers with BUY/SELL alerts, customizable candle colors, and an info box for ATR/volatility insights. Supports EMA/SMA/HMA/VWAP on any chart.
Overview
TGFA Flexible Alerts is a versatile Pine Script indicator for traders seeking customizable moving average (MA) crossovers, visual signals, and quick-reference metrics. It overlays crossover lines (e.g., fast EMA over slow SMA), generates BUY/SELL labels and alerts, colors candles based on themes, and includes an optional info box with ATR bands, support/resistance, and trend projections. Built for any symbol and timeframe (optimized for 1H intraday), it auto-detects Heikin Ashi charts and handles mixed MA types like responsive HMA with lagging EMAs. All logic uses built-in TA functions for reliability—no repainting on confirmed bars.
Key Features
MA Crossover Engine: Configurable lines (EMA, SMA, HMA, VWAP) with dynamic colors (HMA tints green/red based on slope). Enable/disable via inputs.
Invert Signals Toggle: Flips BUY/SELL logic for mixed MA setups (e.g., HMA as fast line over EMA).
Reasoning: Traditional crossovers assume a fast line (low lag) crossing above a slow line (high lag) for buys. HMA's hull design makes it ultra-responsive, so it may "lead" too aggressively—causing premature signals. Inverting aligns it with user intuition (e.g., HMA dipping below then recovering signals strength), reducing false positives in trending markets. Test on your pairs!
Visual Alerts: BUY/SELL labels at crossover price (with optional price display and offset adjustment).
Single MA Overlays: Independent plots for EMA/SMA/HMA/VWAP (length 0 to hide).
Info Box: Real-time table with current price, ±1/2 ATR bands, median price (over lookback), trend (SMA50 slope), volatility % (ATR normalized), support/resistance (recent highs/lows), and reversal projections (tied to SMA50 pivot for up/down bias).
Candle Coloring: 20+ themes (dark/light canvases) for bull/bear/reversal/low-volume bars—e.g., Emerald Blaze greens uptrends, dims on low vol. Toggle off for no changes.
Chart Source Flexibility: Auto-switches to Heikin Ashi if detected; manual override for Regular/HA.
Alerts fire on crossovers/crossunders (custom messages with ticker/interval). Open-source for forking.
How to Use
Add to Chart: Search in TradingView's public library, apply to any symbol (e.g., stocks, forex). Best on 1H for intraday, but works on daily/weekly too.
Setup Crossovers: Choose Line 1/2 types/lengths (e.g., HMA 9 over SMA 20). Enable "Invert Signals" if using HMA—prevents lag mismatches in volatile assets.
Alerts & Labels: Toggle labels for visuals; set TradingView alerts on "Buy"/"Sell" conditions. Use offset for crowded charts.
Info Box Insights: Enable for quick scans—e.g., enter long near support if trend is bullish and price > median. Adjust ATR length (default 14) for sensitivity.
Candle Themes: Pick a scheme (e.g., Neon Pulse for dark mode); it overrides bar colors without altering data.
Customization Tip: For HMA-heavy setups, invert + short lengths (5-9) catch turns early; pair with volume filter in alerts.
Limitations & Disclaimers - Designed for overlay on price charts; may overlap in tight ranges—adjust transparency via styles.
HMA can repaint intra-bar; signals confirm on close. Not back tested for all assets—validate with strategy tester.
Info box projections use SMA(50) as a trend pivot (same for up/down as reference); customize via code for advanced calcs. Candle colors are cosmetic only.
This is an analysis tool, not advice. Trading involves risk; combine with fundamentals/news. Past performance isn't indicative of future results. No liability for losses.
I'm still a newbie, so feedback encouraged!
Thank you!!
ThisGirl

ICT Killzones Pro Suite — ICT & SMC Indicator with AlertsThe ICT Killzones Pro Suite is a complete ICT and Smart Money Concepts (SMC) indicator that brings together the most important institutional concepts into one single tool.
Instead of manually drawing sessions, structure breaks, liquidity levels or imbalances, this ICT indicator for TradingView automatically plots them with precision and full customization.
It is widely used by traders in Forex, Indices, Crypto and Commodities who want to study market structure the same way institutions do.
🔎 Features
✅ Killzones (Asia, London, New York)
Session boxes with customizable colors
50% midline level for equilibrium reference
Real-time status display (“In Killzone” / “Out of Killzone”)
✅ Equal Highs & Equal Lows (Liquidity zones)
Automatic detection of EQH/EQL
Equality tolerance parameter
Zone expiry (bars)
Rejection filter (2 consecutive closes)
Option to show only the latest active EQH/EQL
✅ Break of Structure (BOS) & Market Structure Shift (MSS)
Detects continuation (BOS) and reversal (MSS) structures
Customizable line styles and colors
“Body only” or “Body/Wick” break modes
Option to show only the latest signals
✅ Open Price Range (OPR)
Institutional daily open level in UTC
Historical OPR memory for backtesting
Optional labels for quick identification
✅ Previous Highs and Lows
Daily (PDH/PDL), Weekly (PWH/PWL), Monthly (PMH/PML)
Full label system
Customizable line width/style
Breakout alerts for each level
✅ Fair Value Gaps (FVGs)
Automatic imbalance detection
Wick or body detection modes
Highlighted imbalance candles in yellow
✅ Alerts Engine
One global alert condition
Modular alerts:
• Killzone opens/closes
• EQH/EQL created or broken
• BOS/MSS bullish & bearish signals
• Previous Highs/Lows breakouts
• FVGs
⚙️ Parameters Explained
Killzones: start/end times in UTC, colors, extension lines, 50% midline
EQH/EQL: tolerance (0 = strict equality, >0 = margin allowed), expiry age (bars), rejection filter, body/wick break type, latest only toggle
BOS/MSS: swing bars (pivots), body vs wick detection, line styles & widths, only-latest option
OPR: exact UTC time (HH:MM), history toggle, label size/color
Previous Highs/Lows: daily/weekly/monthly levels, line styles, label settings, breakout alerts
FVGs: wick vs body detection, candle highlight color
Alerts: global condition + per-module toggles (sessions, liquidity, BOS/MSS, FVG)
Every parameter is fully customizable, making this SMC indicator adaptable to any trading style or timeframe.
📌 Why use this ICT & SMC indicator?
Saves time by automating repetitive tasks
Provides an institutional framework directly on charts
Keeps analysis structured and consistent
Optimized for intraday scalping and swing trading
⚠️ Disclaimer
This script is for educational purposes only. It does not guarantee profits or predict markets with certainty. Always use proper risk management.
🔑 Access
This is an invite-only script on TradingView.
Click Request Access on this page to apply.

Interval Price AlertsInterval Price Alerts
A versatile indicator that creates horizontal price levels with customizable alerts. Perfect for tracking multiple price levels simultaneously without having to create individual horizontal lines manually.
Features:
• Create evenly spaced price levels between a start and end price
• Customizable price interval spacing
• Optional price labels with flexible positioning
• Alert capabilities for both price crossovers and crossunders
• Highly customizable visual settings
Settings Groups:
1. Price Settings
• Start Price: The lower boundary for price levels
• End Price: The upper boundary for price levels
• Price Interval: The spacing between price levels
2. Line Style
• Line Color: Choose any color for the price level lines
• Line Style: Choose between Solid, Dashed, or Dotted lines
• Line Width: Adjustable from 2-4 pixels (optimized for opacity)
• Line Opacity: Control the transparency of lines (0-100%)
3. Label Style
• Show Price Labels: Toggle price labels on/off
• Label Color: Customize label text color
• Label Size: Choose from Tiny, Small, Normal, or Large
• Label Position: Place labels on Left or Right side
• Label Background: Set the background color
• Background Opacity: Control label background transparency
• Text Opacity: Adjust label text transparency
4. Alert Settings
• Alert on Crossover: Enable/disable upward price cross alerts
• Alert on Crossunder: Enable/disable downward price cross alerts
Usage Tips:
• Great for marking key price levels, support/resistance zones
• Useful for tracking multiple entry/exit points
• Perfect for scalping when you need to monitor multiple price levels
• Ideal for pre-market planning and level setting
Notes:
• Line width starts at 2 for optimal opacity rendering
• Labels can be fully customized or hidden completely
• Alert messages include the symbol and price level crossed

Interval Highlighter with High/Low AlertsInterval Highlighter with High/Low Alerts
Overview:
This Pine Script indicator enhances chart analysis by highlighting specific time intervals and marking the highest and lowest prices within those periods. It supports three customizable modes:
Date Range: Highlight a user-defined period with background shading and plot the highest and lowest prices.
Days of the Week: Highlight specific weekdays with background colors and plot the highest and lowest prices for each day.
Intraday Interval: Highlight a specific intraday time range (e.g., 12:30 PM to 4:30 PM) with background shading and plot the highest and lowest prices within that interval.
Alerts are triggered when the price touches any of the highlighted high or low levels, providing real-time notifications for potential trading opportunities.
High and low lines extend to the right and remain visible after the interval ends. This ensures they act as actionable reference points for alerts between intervals, allowing users to monitor critical levels until a new interval of the same category forms.
Features:
Customizable Time Intervals: Define specific date ranges, weekdays, or intraday intervals to highlight on the chart.
High/Low Tracking: Automatically plots the highest and lowest prices within the defined intervals.
Real-Time Alerts: Set up alerts to notify when the price touches any of the highlighted high or low levels.
Actionable Lines: High/low lines remain visible after interval completion to serve as reference points for alerts.
Visual Enhancements: Customize background colors and line styles for each interval type.
Usage:
Apply the indicator to your chart.
Configure the desired modes (Date Range, Days of the Week, Intraday Interval) in the settings.
Customize the appearance settings to match your preferences.
Set up alerts based on the highlighted high/low levels.
Disclaimer:
This indicator is designed to assist in identifying potential areas of interest based on historical high and low levels within specified intervals. It is not intended as a standalone trading signal. Users should employ additional technical analysis tools and conduct thorough research before making trading decisions.

Session & Swing Levels + Smart AlertsMulti-Timeframe Level Tracker with Advanced Alert System
This comprehensive indicator combines session-based trading levels with multi-timeframe swing analysis, for key level identification and alert management.
Key Features:
Session Analysis:
Asia Session (7:00 PM - 4:00 AM ET) - Tracks high/low levels during Asian market hours
London Session (3:00 AM - 11:00 AM ET) - Identifies key European session levels
Previous Day Levels - Displays prior day's high and low levels
Visual session backgrounds and customizable timezone support
Multi-Timeframe Swing Detection:
Up to 5 configurable timeframes (default: 15m, 1h, 4h, 1D, 1W)
Intelligent swing high/low identification using customizable pivot strength
Each timeframe uses distinct colors for easy identification
Advanced Alert System:
Anti-repainting protection - Alerts only trigger on confirmed bars for reliable live trading
Specific alert messages for each level type (Asia High, London Low, Previous Day levels, etc.)
Individual alert toggles for each session and timeframe
Timestamps in Eastern Time for consistency
Visual Customization:
Independent color schemes for sessions and timeframes
Configurable line styles (solid, dashed, dotted) and widths
Separate styling for active vs. mitigated levels
Optional line extension past mitigation points
📊 How It Works:
Level Creation: Automatically identifies and draws key levels at session closes
Mitigation Detection: Monitors price interaction with levels in real-time
Visual Updates: Changes line appearance when levels are crossed
Smart Alerts: Sends targeted notifications with level-specific information

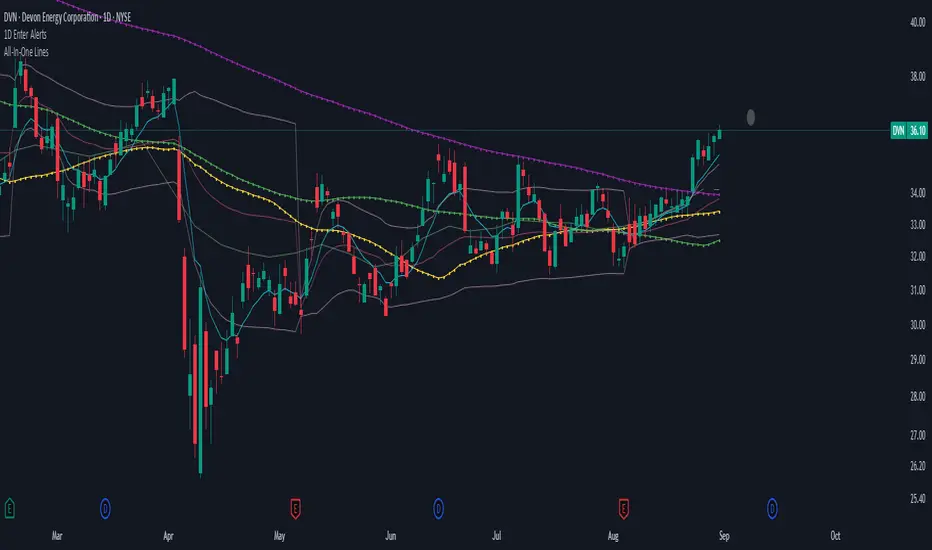
1D Enter AlertsThis is only a remaining of an experiment. I had real swing enter alerts, but it just made more sense to use classic TradingView alerts for horizontal / trendline / SMA breaks.
(Btw you can set up a horizontal alert in TradingView just by hovering the mouse on the chart so it's at the price point you aim for, and pressing "Alt + A").
Once this horizontal alert triggered I would usually wait for confirmation of the move on the 5m. If it's f. e. a break of an SMA and I'm not convinced yet, I might wait until end of the day. For exactly that purpose the following alert comes in handy:
"X Candle Close":
Is triggered 15m before market close - good reminder to check a stock again to see whether a resistance / support break was valid - and the stock should be entered as a swing, or maybe whether it should be closed as a loss.
"Z Trend Change: UP" + "Z Trend Change: DOWN":
Same as on 5m Exit Alert: meant to be only applied on SPY, and to have it set up to never end!
Criteria:
SPY broke through daily EMA 8 or daily SMA today, indicating an important short-term change on the daily chart.
Is triggered 15m before market close
More infos: www.reddit.com
MacD Alerts MACD Triggers (MTF) — Buy/Sell Alerts
What it is
A clean, multi-timeframe MACD indicator that gives you separate, ready-to-use alerts for:
• MACD Buy – MACD line crosses above the Signal line
• MACD Sell – MACD line crosses below the Signal line
It keeps the familiar MACD lines + histogram, adds optional 4-color histogram logic, and marks crossovers with green/red dots. Works on any symbol and any timeframe.
How signals are generated
• MACD = EMA(fast) − EMA(slow)
• Signal = SMA(MACD, length)
• Buy when crossover(MACD, Signal)
• Sell when crossunder(MACD, Signal)
• You can compute MACD on the chart timeframe or lock it to another timeframe (e.g., 1h MACD on a 4h chart).
Key features
• MTF engine: choose Use Current Chart Resolution or a custom timeframe.
• Separate alert conditions: publish two alerts (“MACD Buy” and “MACD Sell”)—ideal for different notifications or webhooks.
• Visuals: MACD/Signal lines, optional 4-color histogram (trend & above/below zero), and crossover dots.
• Heikin Ashi friendly: runs on whatever candle type your chart uses. (Tip below if you want “regular” candles while viewing HA.)
Settings (Inputs)
• Use Current Chart Resolution (on/off)
• Custom Timeframe (when the above is off)
• Show MACD & Signal / Show Histogram / Show Dots
• Color MACD on Signal Cross
• Use 4-color Histogram
• Lengths: Fast EMA (12), Slow EMA (26), Signal SMA (9)
How to set alerts (2 minutes)
1. Add the script to your chart.
2. Click ⏰ Alerts → + Create Alert.
3. Condition: choose this indicator → MACD Buy.
4. Options: Once per bar close (recommended).
5. Set your notification method (popup/email/webhook) → Create.
6. Repeat for MACD Sell.
Webhook tip: send JSON like
{"symbol":"{{ticker}}","time":"{{timenow}}","signal":"BUY","price":"{{close}}"}
(and “SELL” for the sell alert).
Good to know
• Symbol-agnostic: use it on crypto, stocks, indices—no symbol is hard-coded.
• Timeframe behavior: alerts are evaluated on bar close of the MACD timeframe you pick. Using a higher TF on a lower-TF chart is supported.
• Heikin Ashi note: if your chart uses HA, the calculations use HA by default. To force “regular” candles while viewing HA, tweak the code to use ticker.heikinashi() only when you want it.
• No repainting on close: crossover signals are confirmed at bar close; choose Once per bar close to avoid intra-bar noise.
Disclaimer
This is a tool, not advice. Test across timeframes/markets and combine with risk management (position sizing, SL/TP). Past performance ≠ future results.

AMD Liquidity Sweep with AlertsAMD Liquidity Sweep with Alerts
Identify key liquidity levels from the Asian trading session with visual markers and alerts.
📌 Key Features:
Asia Session Detection
Customizable start/end hours (0-23) to match your trading timezone
Automatically calculates session high/low
Smart Swing Level Identification
Finds the closest significant swing high ≥ Asia high
Finds the closest significant swing low ≤ Asia low
Adjustable pivot sensitivity (# of left/right bars)
Professional Visuals
Dashed reference lines extending into the future
Blue-highlighted key levels
Clean label formatting with precise price levels
Trading Alerts
Price-cross alerts for liquidity breaks
Visual markers (triangles) when levels are breached
Separate alerts for buy-side/sell-side liquidity
Customization Options
Toggle intermediate swing highlights
Adjust label sizes
💡 Trading Applications:
Institutional Levels: Identify zones where Asian session liquidity pools exist
Breakout Trading: Get alerted when price breaches Asian session ranges
S/R Flip Zones: Watch how price reacts at these key reference levels
London/NY Open: Use Asian levels for early European session trades
🔧 How to Use:
Set your preferred Asia session hours
Adjust pivot sensitivity (default 1 bar works for most timeframes)
Enable alerts for breakouts if desired
Watch for reactions at the plotted levels

BTC Breakout Alert📈 BTC Breakout & Fakeout Detector with Volume, RSI & MACD Filters
This script helps identify high-confidence breakout setups by combining price action, volume spikes, and optional momentum filters (RSI & MACD). It’s designed to alert you when Bitcoin (or any asset) breaks above a defined resistance level with strong conviction — and warns you if that move turns out to be a fakeout.
🔍 Features:
✅ Confirmed Breakout Alerts: Triggers when price closes above your set resistance level with volume ≥ 1.5× the 20-period average.
⚠️ Fakeout Detection: Highlights when price closes back below resistance within a few candles after breakout.
📊 Momentum Filters:
RSI > 50 for bullish confirmation
MACD line > signal line to support breakout momentum
🔔 Custom Alerts: Built-in alert conditions for both breakout and fakeout events.
🔼🔽 Visual Markers: Arrows plotted directly on the chart for clear entry and caution zones.
🕒 Works on all timeframes and any asset that includes volume data.
Ideal for breakout traders who want more than just a price spike — this tool ensures volume and momentum alignment, helping you reduce false signals and react with more confidence.
