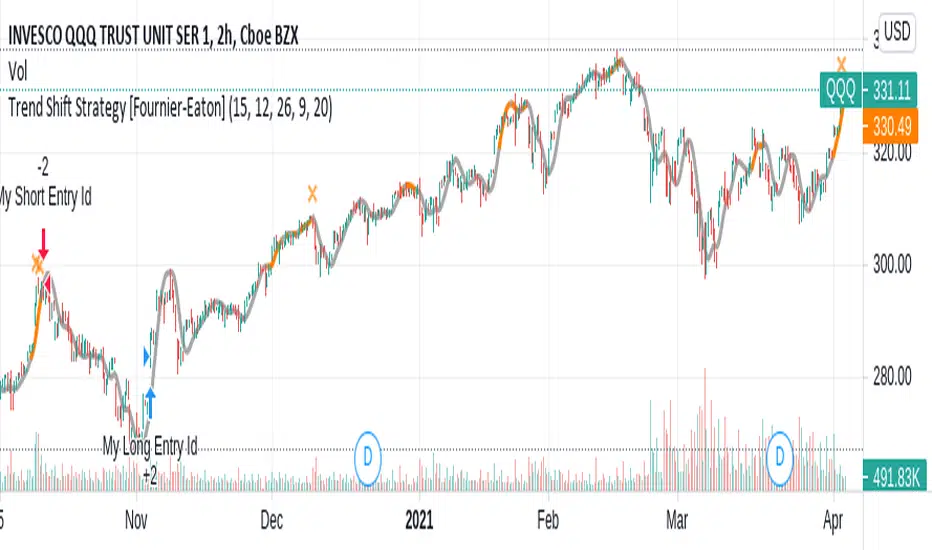
Trend Shift Strategy [Fournier-Eaton]This is a version 0.1 of a revamped Trend Shift Indicator (strategy version).
There are three main components:
A moving average with color to indicate caution (for those trading short-term)
A series of cross indications above bar to indicate further warning (for those trading mid-term)
Longer term buy and sells informing the trades of the indicator itself. (for those trading longer term)
I'd like some suggestions on how to improve this script, please make them in the comments. I do hope this is useful.
Also please see the indicator version of this:
Cerca negli script per "trend"
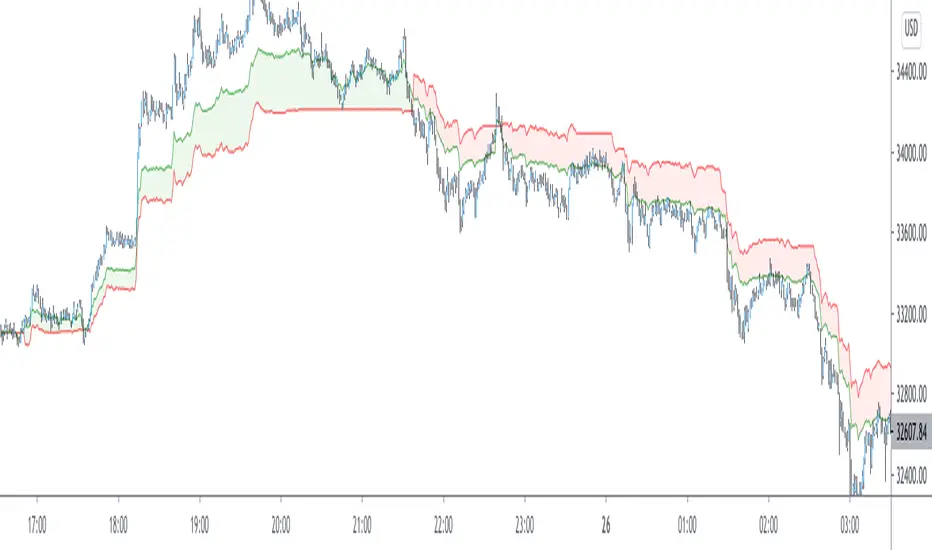
Trend MagicTrend Magic is originally a MT platform (MetaTrader) indicator and it can be used with any forex trading systems / strategies for additional confirmation of trading entries or exits. Converted the MT platform code to TradingView Pine version 4. Also you can use Multiple Time Frame.
It also works well with Crypto and Stock Markets.
Trend Magic consists of two main calculation parts as momentum and volatility:
First part is ATR based (like ATR Trailing Stop) logic, second part is all about CCI which also determines the color of Trend Magic.
Blue: when CCI is positive
Red: when CCI is negative
Also added alert condition regarding price crosses :
when LOW CrossesAbove TM
and HIGH CrossesBelow TM
Enjoy
Kıvanç Özbilgiç

Trend Line Fibonacci [TLF]TLF is a price based Adaptive Scalping Indicator ideally to be used over lower timeframes
1min, 5min,.... 30 min
Its made using pivot calculations of fibonacci lookback lengths, which gives it an adaptability
default lookback lengths are:
55,89,144,233
This indicator is a pine script clone of Trend Line Fibonacci as available in MT4
google search ( prorealcode , trend line fibonacci )
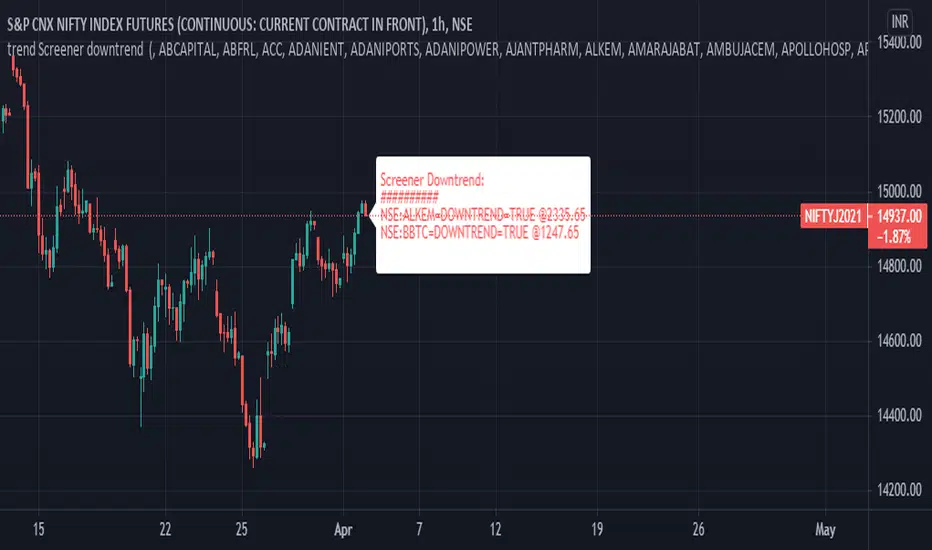
trend Screener downtrendthis is in continuation with - previous trend screener i have published, In this code only downtrend screener is there ,This is type of custom screener I searched and made to screen bulk stocks any one can modify it, other may get help out of it.
you can change or add new symbol in input section.
in my code i have made defined and printed last close price when downtrend was true.
1. downtrend = ema (close,55)< ema (close,144) and ema (close,144)< ema (close,388) and ema (close,388)<ema(close,576) and close<ema(close,388)
if the indicator is printing DOWNTREND=TRUE or UPTREND=TRUE then the corresponding stock is in currently in that trend out of the stocks listed in the code
in one code only 40 (max) stocks can be called.
to add more stocks I copied same code and changed the stocks in the code, now you can screen 80 stocks at a time.
This code runs on each bar and checks if the stocks is in uptrend or down trend.
you can customize this screener according to your requirement.
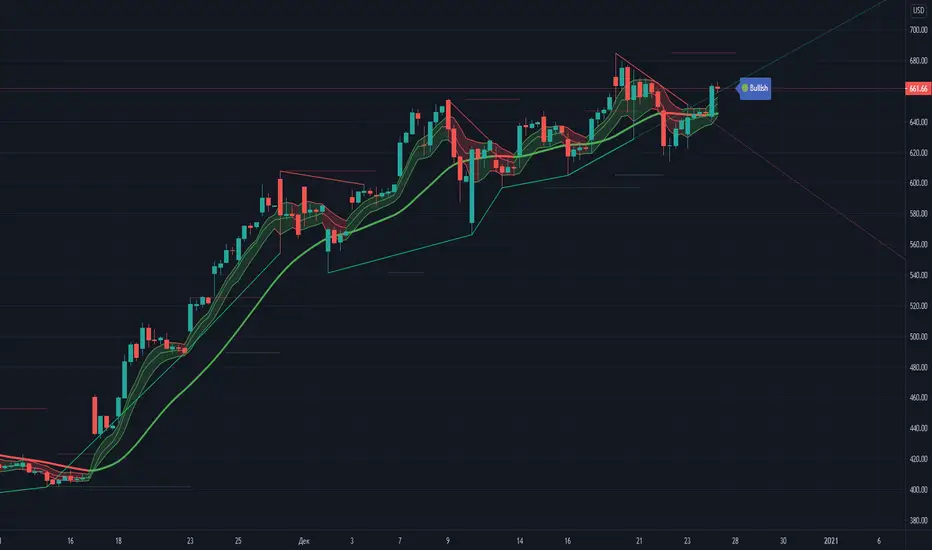
Trend Visualizer with S/RDetection and color visualization of the trend direction by constructing a candle envelope based on exponential moving averages and a double exponential moving line.
Analysis of highs and lows and construction of trend lines.
Showing support/resistance levels and trend forecast.
English version.
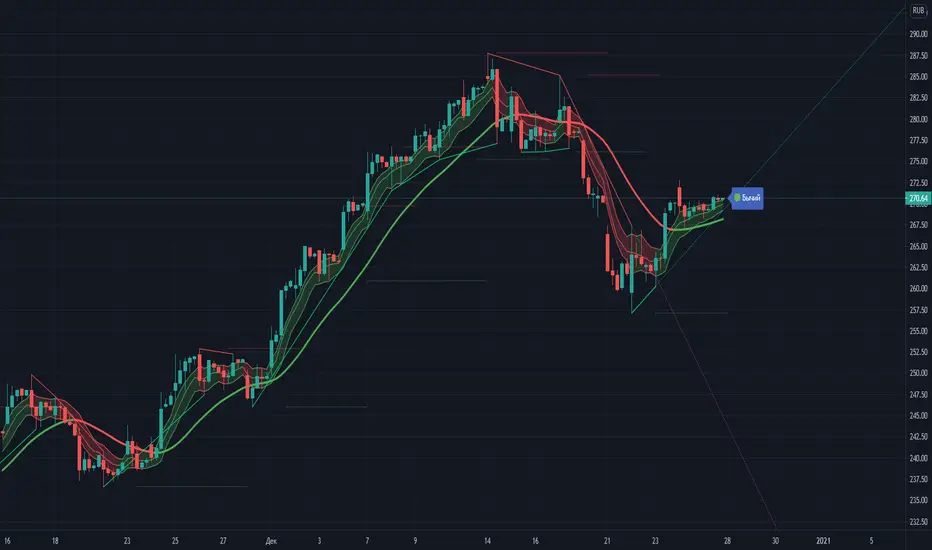
Trend Visualizer with S/R (Russian version)Обнаружение и цветная визуализация трендового направления путем построения свечного конверта по экспоненциальным скользящим средним и линии двойной экспоненциальной скользящей.
Анализ максимумов и минимумов и построение трендовых линий. Показ уровней поддержки/сопротивления и прогноз тренда.
Рускоязычная версия интерфейса. Англоязычная версия позже.
Detection and color visualization of the trend direction by constructing a candle envelope based on exponential moving averages and a double exponential moving line.
Analysis of highs and lows and construction of trend lines. Showing support/resistance levels and trend forecast.
Russian-language version of the interface. English version later.
Trend Trader Buy/Sell SignalsTrend Trader
The code is open source, what it uses to print signals is MACD cross and ADX. Bar colors change in relation to where price is according to the 50 day MA. The MA ribbon is used for visualizing trend and using it for dynamic support/resistance. The ribbon is comprised of the 50 day and 100 day MAs.
Main reason to publish this script is because some like to jumble up scripts together slap some moving averages on it to "follow trend" and then label it an algorithm, market it and sell it to people online. No single system will work 100% of the time, do you due diligence in anything you are interested in buying. Plenty of free scripts in the TV library that can do you justice when trading.

trend Screener List1This is type of custom screener I searched and made to screen bulk stocks any one can modify it, other may get help out of it.
in my code i have made defined
1. uptrend= ema(close,55)> ema(close,144) and ema(close,144)> ema(close,388) and ema(close,388)> ema(close,576) and close>ema(close,388)
2. downtrend = ema(close,55)< ema(close,144) and ema(close,144)< ema(close,388) and ema(close,388)

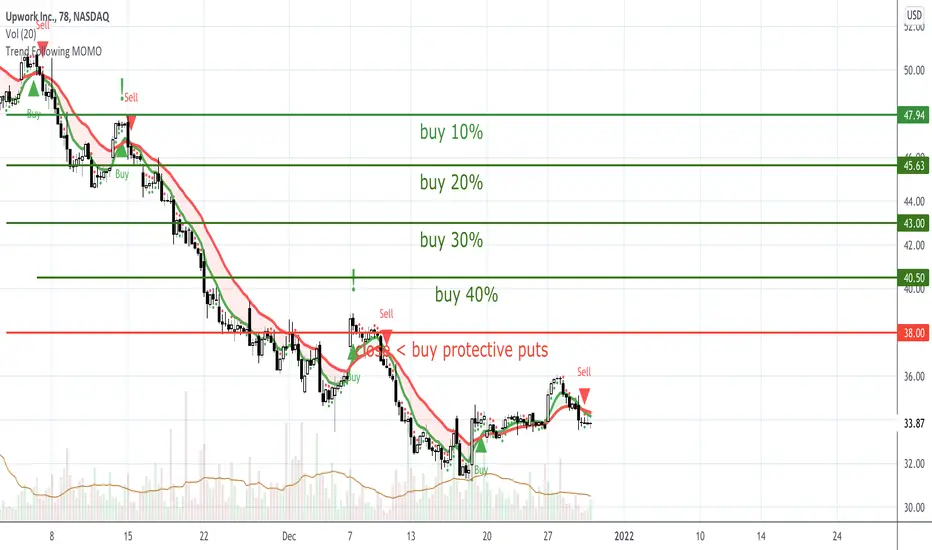
Trend Following MOMOIngredients
Daily chart
8ema & 21ema on a 78-minute chart
Trend Following v1 indicator for TradingView (optional)
Steps
Identify stocks that tend to move the same direction for one or more weeks at a time.
Find and locate stocks where the 8ema is crossing above (bullish) or below (bearish) the 21 ema on a 78-minute chart.
If the 8ema > 21ema, the indicator will show a GREEN shaded area , be bullish OR if the 21ema > 8ema, the indicator will show a RED shaded area, be bearish.
Buy to open with a “Limit buy” order if a green arrowis present at CLOSE of a 78-minute candle or sell to open with a “limit sell” or if a red arrowis present at CLOSE of a 78-minute candle.
Use either stocks or options. allocate the same $$ for each trade, continue in the trend (stay in the trade) until you 1) trend is changing. 2) ready to lock in profits.
Optional
The shift from bearish to bullish is the best scenario, consider Long only / short only / long and short.
Set alerts “Trend Reversal” inside the v1 trend following TradingView indicator and ONLY trade your alerts.
Premium indicator has built-in strategy tester.
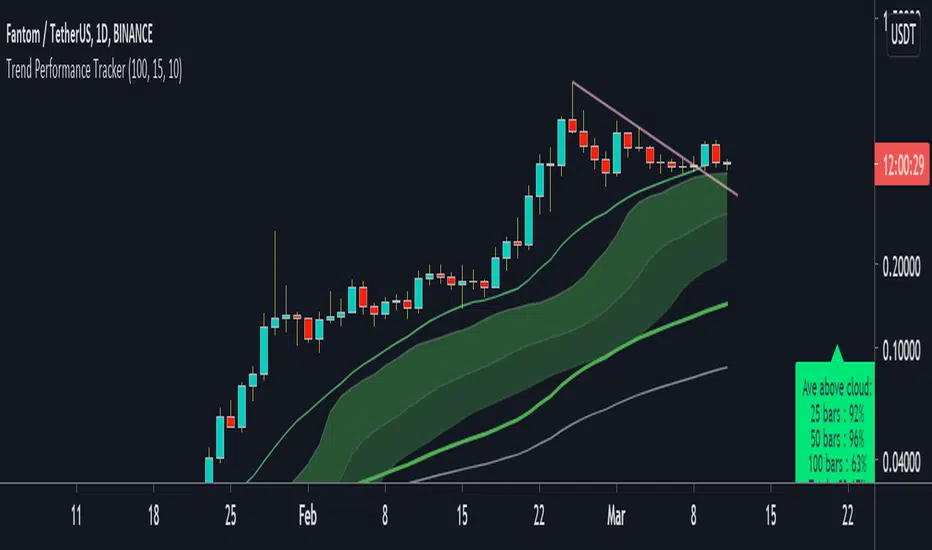
Trend Performance TrackerThis script is designed for trend trading. Currently set up for stocks long. It's main aim is checking the profitability of the trend trading system that it suggests.
How to use:
- When there is a sufficient trend and pullback for an entry yellow dots will appear under the bars. An buy-stop line (green) and a stop-loss line (red) also appear on the chart at this point.
- the script tracks having made a trade and continues to draw the stop-loss placement on the chart (red line)
- at the bottom of the chart you an see the script tracking the trades it would place.
- Yellow squares are a pending setup
- A green arrow and green squares are a open position
- A pink X means a losing trade and a green flag means a winning trade
- At the current bar will be data on how well the strategy would perform on that pair at that timeframe. "RR" is the total RR made over the number of trades (a bad trade is counted as -1). "win %" is the percentage of winning trades.
- If there RR is > 2 and win % is > 50%, the data box will show as green, indicating a good probability for trading success on that pair and time-frame at that moment.
Trend Indicator with BUY SELL signalsThe Script can be used to identify the main trend and take BUY/SELL decisions in the lower time frames.
The tool can be applied as follows
1) Apply the tool your favorite chart
2) Select the main trend.
3) Go to lower time frames to check the BUY/SELL signals. Example: If the selected main trend is 4 hrs then go to time frames below 4 hrs to find the entry and exit positions.
Feel free to reach out to me if you need any further information

Trend TradingThe strategy has two scripts coded in it. It uses $10,000 capital, 1 Share is the default quantity, commission of 0.0018.
As you can notice in the AMD chart,
The coded script can do four actions because there are two scripts together.
First script:
A-Buy on red bars
B-sell on green candles.
Second script:
A-buy on red background
B-sell on green background
(This is just to show you the statistics of both scripts).
The way my strategy works is there are multiple weights to gains from certain highs and lows using Fibonacci ratios.
The reason I combined both is I need to know what the trend is to avoid trading against it.
The background color tells me what the trend it.
The bar colors are for entries.
How I filter the signals:
When the background is red, then a down trend. However, my entry would be on green bars.
When the background is green, an uptrend, However, my entry would be on red bars.
The strategy can be used for multiple time frames, please test profitability rate and trade based on your judgment. The indicator is not perfect, and Your skills are important in the decision making. Do not depend solely on the indicator.
Other signals,
1-After a wide green background(uptrend). You could see one a red that could be an entry instead of a downtrend and vice versa.
2-In a wide red background, you could see green bars eventually that could be an overbought condition for a rally and vice versa.
The indicator can help you but will not trade for you. I suggest that you follow the certain conditions I have mentioned (How filter the signals).
If you are interested, please send me private message.

Trend analysis with noise reductionAs a Tradingview and Pine script beginner, I am trying to do some practice.
This indicator is as simple as it seems, reducing some high frequency noise of trend indicators by red line.
Trend trader StrategyFirst I would like to thank to @JustUncleL since this strategy started from one of his scalper strategies
This strategy can be adapted to all time charts .
First it has the session where we want to trade, for this example I choosed the EURUSD so I only take in consideration london/neywork session.
Its made from 3 EMA :
normal
slow
ultra slow
It has has the capacity to use HA candles into consideration if its needed.
At the same time we have a price channel made from faster MAs, that act like a bollinger band .
Together with all of them, we establish which trend we have if its uptrend or downtrend
Then we check the candles if they are below or above the MA , and based on the condition if they crossed recently we can suggest if its a buy or a long condition
At the same time we have 2 options of stop conditions:
Through a trailing stop made from ATR or % based
And second, a SL/TP made from pip points or % based.
For this example I used % based.
Let me know what you think about it, and if you found some nice settings for it. So far I only adapted to EURUSD 1 min time.

Trend Identifier ! Trend Identifier is basically identifies the trend specially during range bound market / choppy market and false breakout . After long bull trend if pink candle/bar starts appearing there is possibility of trend reversal ( bear trend may start or price may consolidate in range until red candle doesn't appear ) vice versa !
Aqua = Strong Bull Trend
Yellow = Weak Bull Trend
Pink = Weak Bear Trend
Red= Strong Bear Trend !

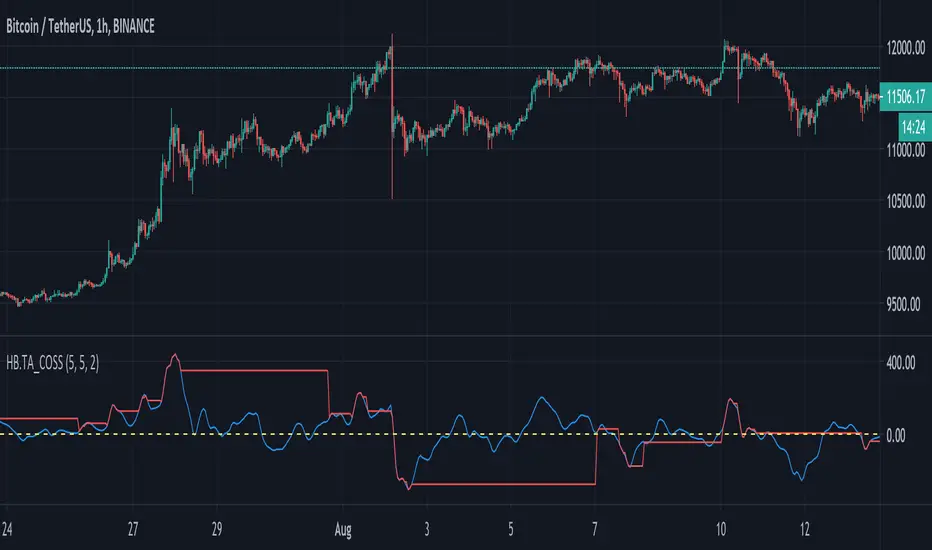
Trend-following Alert E v2.7 4HHi All,
Welcome to my third published Trend-following strategy for bitcoin, designed specifically for BITMEX:XBTUSD on 4H
This is an improvement of my second script (v2.6) to try and reduce 'chop' in consolidating ranges.
This script is the Alert script to use for settings up Alerts on Tradingview.
The accompanying strategy script and explanations/caveats you can find here:
In this script you will find the "active_long" and "active_long" variables (red and blue lines) that show which positions are being taken by the strategy script.
You can set 'Once per bar close' alerts for this to get your alerts on TV.
For instance, I use 'crossing up @ 0.1' on "active_long" to set an 'Open Long" alert and a 'crossing down @ 0.9' to set a 'Close Long' alert.
The same holds for the 'Open Short' and the 'Close Short' alerts but then for the 'active_short' variable.
I've also added start and end dates to test specific time periods.
Please let me know if you have any questions.

Trend AssessmentThis indicator helps to identify the trend direction and wether the trend is still accelerating or not. The calculation is based on two SMAs and uses the difference between those SMAs.
An accelerating bullish trend is indicated by a green background and green triangles over the candles.
An accelerating bearish trend is indicated by a red background and red triangles over the candles.

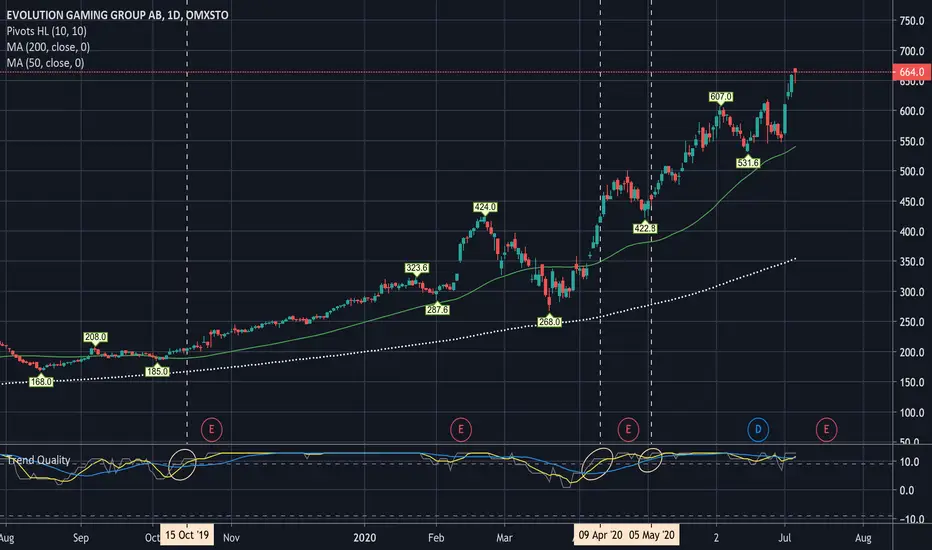
Trend QualityThe quality of the current trend is calculated by adding or subtracting
one point to the total value depending on the following criteras:
1. EMA-8, MA-20, MA-50, MA-100, MA-200 , each get a point if they are increasing.
2. EMA-8 > MA-20 > MA-20 > MA-50 > MA-100 > MA-200 , each condition that is true gets one point.
On top of the Trend Quality value we apply a "weekly" (5 periods) and
a "monthly" (22 periods) moving average.
When above a value of 5, a strong trend is indicated and hence
a trend following strategy should be used.
Use this to Buy when bouncing back from e.g MA-20 or a confirming
consolidation/candlestick/trendline pattern.
When the trend decreases below Zero a trend shift may have occured.
Idea, curtesy: Tobbe Rosèn
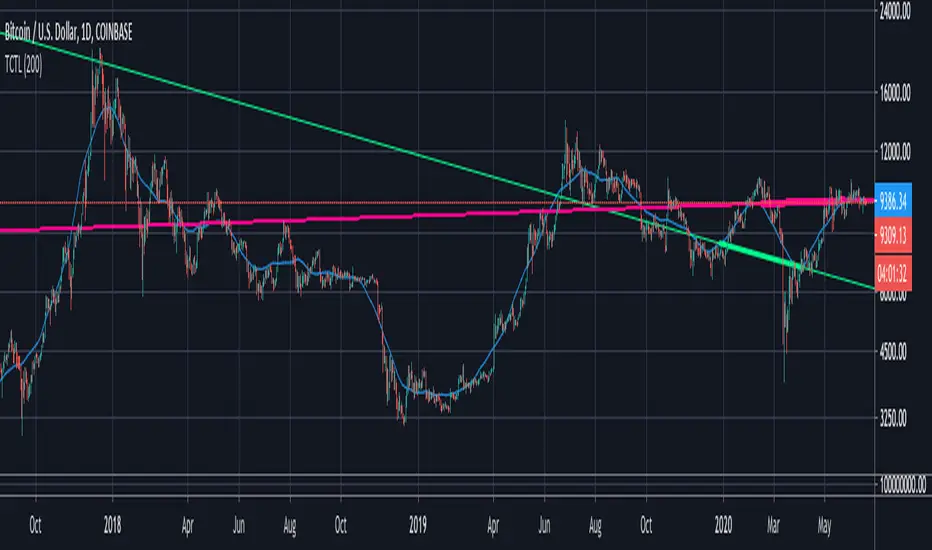
Trend Counter-Trend LinesThis analysis tool takes 4 local samples to product a trend line (green) and a counter-trend line (red). The concept of this is similar to finding wedges where 4 points (usually alternating highs and lows) are used to form the wedge. The purpose of this is to give a general long term direction and pattern.
TREND(KT, MA, BB) SQUEZEE and GO E REVERSAL(BB) - RIVA KELLER TREND
This indicator shows the moment to enter a trend, being 3 different indicators, Bollinger Bands, Keltner channel and moving average.
Use a “Boca de Jacaré” strategy or squeeze and go, which happens when the Bollinger bands open, to identify this using the Keltner channel, to filter the moment to enter the operation, two moving average, one of minimal and another one of maximums and to follow a trend used a slow moving average (50 or 90 reductions).
• BUY POSITION: When the Bollinger bands (BB SQUEEZE trend) are opened, the smallest remaining in the Keltner channel (KC trend) and the closing price for the highest moving average of maxima (MAH) and the fast average (MAT), we have a purchase. Always entering the first green candle.
• SELL POSITION: when the Bollinger bands (BB trend) open, they become smaller than the Keltner channel (KC trend) and the closing price for the lower than the minute moving average (MAL) and the slow moving average (MAT), we have a sale. Always entering the first red candle.
-----------------------------------------------------------------------------------------------------------------------------------------------------------------------------------
REVERSAL
This indicator shows a trend reversal, it consists of 3 steps.
• When the candle is closed to bollinger bands (BB reversal), we don't have a defined direction, we wait.
• When a candle closes again inside the boolinger bands (BB reversal), a candle is colored, blue indicates a possible buy and pink indicates a possible sell.
• To filter as operations, enter 50 pips or points below the closure of the pink candle, or 50 pips or points above the closure of the blue candle.
//-----------------------------------------------------------------------------------------//----------------------------------------------------------------------------------//
TENDÊNCIA
Este indicador nos mostra o momento de entrar em uma tendência, ele consiste de 3 indicadores diferentes, Bollinger Bands, Keltner channel e médias móveis.
Utilizamos a estratégia “Boca de jacaré” ou squeeze and go, que acontece quando as Bollinger bands se apertam, para identificar isso utilizamos o canal de Keltner, para filtrar o momento de entrar na operação, utilizamos duas médias móveis, uma de mínimas, outra de máximas e para entrar seguindo a tendência utilizamos uma média móvel lenta (50 ou 90 períodos).
• POSIÇÃO COMPRADA: Quando as Bandas de Bollinger(BB SQUEEZE trend) se apertam, ficando menores que o canal de Keltner(KC trend) e o preço de fechamento for maior que a média móvel de máximas(MAH) e da média móvel lenta(MAT), temos uma compra. Sempre entrando no primeiro candle verde.
• POSIÇÃO VENDIDA: Quando as Bandas de Bollinger(BB trend) se apertam, ficando menores que o canal de Keltner(KC trend) e o preço de fechamento for menor que a média móvel de minímas(MAL) e da média móvel lenta(MAT), temos uma venda. Sempre entrando no primeiro candle vermelho.
------------------------------------------------------------------------------------------------------------------------------------------------------------------------------------
REVERSÃO
Este indicador nos mostra reversão de uma tendência, ele consiste de 3 etapas.
• Quando o candle fecha fora da bollinger bands(BB reversal), não temos uma direção definida, aguardamos.
• Quando o candle volta a fechar dentro das boolinger bands(BB reversal), a candle fica colorida, azul indica uma possível compra e rosa uma possível venda.
• Para filtrar as operações, entramos 50 pips ou pontos abaixo do fechamento do candle rosa, ou 50 pips ou pontos acima do fechamento do candle azul.

Trend Trading Indicator V3Hello Everyone it is base on super-trend and moving average most power full version
Indicator feature
➤Long signal with Alerts
➤Short signal with Alerts
➤Take profit and stop loss from Long side with Alerts
➤Take profit and stop loss from Short side with Alerts
➤You Can Also change Indicator Input and Enhance Indicator Signal
➤No Repaint
➤You can also add Long and Short side Custom input
In the future, we are adding more features and alerts and time to time. update

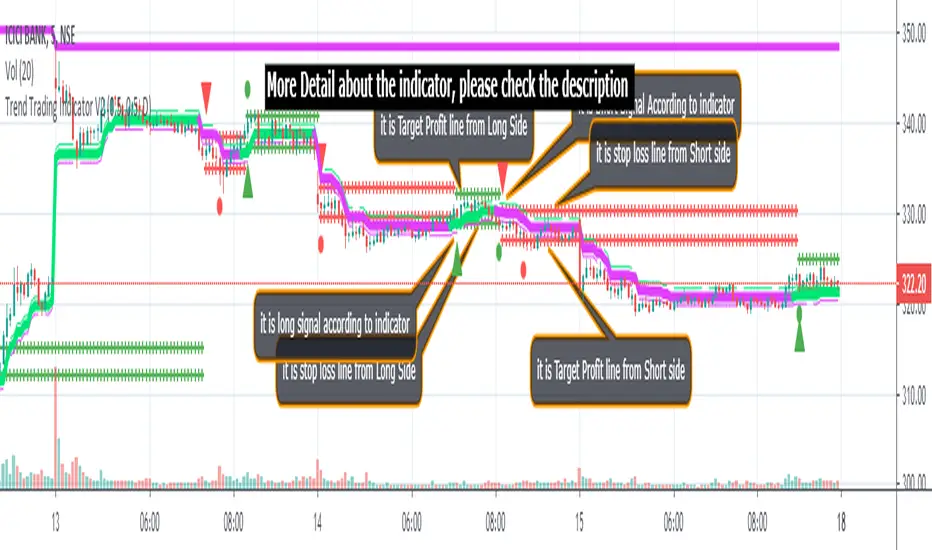
Trend Trading Indicator V2Hello everyone it is indicator base on super trend and Moving average
Indicator feature
➤Long signal with alerts
➤Short signal with alerts
➤Long side take profit and Stop loss with alerts
➤Short side Take profit and stop loss with Alerts
➤trend identify line
➤You can Also change Take profit or stop loss input
In the future, we are adding more features and alerts and time to time. update
TREND CYCLERUse for HTF trend and LTF scalping ranges (between upper and lower boundries). Bar colors added for trend direction. Best used with ADX TREND GOD
