Breakouts & Pullbacks [Trendoscope®]🎲 Breakouts & Pullbacks - All-Time High Breakout Analyzer
Probability-Based Post-Breakout Behavior Statistics | Real-Time Pullback & Runup Tracker
A professional-grade Pine Script v6 indicator designed specifically for analyzing the historical and real-time behavior of price after strong All-Time High (ATH) breakouts. It automatically detects significant ATH breakouts (with configurable minimum gap), measures the depth and duration of pullbacks, the speed of recovery, and the subsequent run-up strength — then turns all this data into easy-to-read statistical probabilities and percentile ranks.
Perfect for swing traders, breakout traders, and anyone who wants objective, data-driven insight into questions like:
“How deep do pullbacks usually get after a strong ATH breakout?”
“How many bars does it typically take to recover the breakout level?”
“What is the median run-up after recovery?”
“Where is the current pullback or run-up relative to historical ones?”
🎲 Core Concept & Methodology
Indicator is more suitable for indices or index ETFs that generally trade in all-time highs however subjected to regular pullbacks, recovery and runups.
For every qualified ATH breakout, the script identifies 4 distinct phases:
Breakout Point – The exact bar where price closes above the previous ATH after at least Minimum Gap bars.
Pullback Phase – From breakout candle high → lowest low before price recovers back above the breakout level.
Recovery Phase – From the pullback low → the bar where price first trades back above the original breakout price.
Post-Recovery Run-up Phase – From the recovery point → current price (or highest high achieved so far).
Each completed cycle is stored permanently and used to build a growing statistical database unique to the loaded chart and timeframe.
🎲 Visual Elements
Yellow polyline triangle connecting Previous ATH / Pullback point(start), New ATH Breakout point (end), Recovery point (lowest pullback price), and extends to recent ATH price.
Small green label at the pullback low showing detailed tooltip on hover with all measured values
Clean, color-coded statistics table in the top-right corner (visible only on the last bar)
Powerful Statistics Table – The Heart of the Indicator
The table constantly compares the current situation against all past qualified breakouts and shows details about pullbacks, and runups that help us calculate the probability of next pullback, recovery or runup.
🎲 Settings & Inputs
Minimum Gap
The minimum number of bars that must pass between breaking a new ATH and the previous one.
Higher values = stricter filter → only the strongest, cleanest breakouts are counted.
Lower values = more data points (useful on lower timeframes or very trending instruments).
Recommendation:
Daily charts: 30–50
4H charts: 40–80
1H charts: 100–200
🎲 How to Use It in Practice
This indicator helps investors to understand when to be bullish, bearish or cautious and anticipate regular pullbacks, recovery of markets using quantitative methods.
The indicator does not generate buy/sell signals. However, helps traders set expectations and anticipate market movements based on past behavior.
Cerca negli script per "trend"

ZynAlgo TrendlinePurpose
ZynAlgo Trendline V2.0 is a trend-following indicator designed to help traders visually identify market direction, momentum alignment, and dynamic risk zones.
It combines multiple moving averages, multi-timeframe analysis, and slope validation to show when a market is trending, ranging, or reversing.
How It Works — Conceptual Breakdown
🔹 1. Trendline Framework (Three-Layer MA System)
The indicator plots three moving-average layers:
Type 1 Line – Fast MA for early trend detection
Type 2 Line – Medium MA as a stability filter
Trendline (200-period) – Long-term structural baseline
When all three are properly stacked and sloped, a directional bias is confirmed:
Bullish → Type 1 > Type 2 > Trendline
Bearish → Type 1 < Type 2 < Trendline
Sideways → Misaligned or flat
Users can select from SMA, EMA, WMA, RMA, SWMA, ALMA, VWAP, fully adjustable to match their style.
🔹 2. Touch-and-Confirm Entry Logic
Entries are visualized only when:
Price touches the selected confirmation line (Trendline, Type 1 or Type 2), and
The direction is re-confirmed within a given number of candles (confirmation window).
You can choose between:
Fixed Mode — confirmation only on the exact N-th candle after touch.
Interval Mode — confirmation allowed anytime within N candles after touch.
This method ensures signals only appear when structure and timing both align — reducing false momentum entries.
🔹 3. Multi-Timeframe Trend Filter (MTF Filter)
The indicator checks trend direction across up to 8 higher timeframes (5 min → Daily).
A signal is valid only if a chosen minimum number of those timeframes confirm the same direction.
This feature creates cross-timeframe confluence, helping users avoid counter-trend setups.
🔹 4. Slope-Based Market Filter
To prevent entries in sideways or choppy markets, the system verifies:
Each MA’s slope is above a user-defined threshold.
MAs are sufficiently spaced apart (using percentage-of-price separation).
When conditions are met, candles are color-coded:
🟩 Uptrend 🟥 Downtrend ⬜ Sideways/No-trade zone.
This gives immediate visual feedback about current market structure.
🔹 5. Dynamic Risk Management System
Choose among three Stop-Loss modes:
Structure-Based – Swing high/low referencing market structure.
MA-Based – Uses the selected moving-average line as a dynamic stop.
ATR-Based – Volatility-adaptive stop (default).
Each entry automatically projects up to three Take-Profit (TP1-TP3) levels using user-defined Risk-to-Reward ratios.
Lines and labels are plotted for Entry, SL, and each TP with optional persistence control (“keep old lines” setting).
🔹 6. Anti-Martingale / Cooldown Logic
A built-in cooldown timer ensures only one trade setup per cycle — new signals pause until the prior trade has reached either TP or SL.
This mechanism prevents overlapping trades and unwanted martingale-style stacking.
🔹 7. Compact On-Chart Dashboard
A small table (top-right corner) summarizes:
Current position (LONG / SHORT / FLAT)
SL mode in use
Confirmation source
Touch/confirmation mode
Cooldown state and remaining bars
This helps monitor settings without opening the menu.
🔹 8. Smart Alerts (Telegram / Discord / Both)
When a new BUY ↗ or SELL ↘ confirmation occurs, the script can send structured alerts containing:
Symbol
Entry price
TP1 – TP3 values
Stop Loss
Timestamp
You can select the preferred platform (Telegram / Discord / Both).
These alerts are optional and serve as notifications, not trade instructions.
Usage Guide
Trendline Length: Period of the main long-term moving average (default = 200). Higher = smoother, slower trendline.
Trendline Type / Type 1 / Type 2 Type: Choose from SMA, EMA, WMA, RMA, SWMA, ALMA, VWAP depending on your preference for responsiveness or smoothness.
Confirmation Source: Which MA must be touched by price to start a confirmation window (Trendline = conservative, Type 1 = frequent, Type 2 = balanced).
Confirmation Window: Number of bars allowed for price to confirm direction after touch.
Stop Loss Mode: Select ATR-based, structure-based, or MA-based stop visualization.
R:R Ratios (TP1-TP3) Adjust distances for visual target levels based on risk-to-reward multiples.
Enable MTF Filter: Require trend alignment across higher timeframes before showing a signal.
Enable Slope Filter: Prevents signals when MAs are flat or overlapping (sideways market).
Enable Candle Coloring: Colors candles by trend state for quick visual confirmation.
How to Use
Apply the indicator to a clean chart with no other overlays for clarity.
Check candle color:
Green → Uptrend; Red → Downtrend; Gray → Sideways.
Wait for a “BUY ↗” or “SELL ↘” label to appear after a valid touch + confirmation sequence.
Observe drawn lines: Entry = blue, SL = red, TP = green.
Use displayed levels as visual references only. You may combine them with your own entry rules or strategy.
Optional: enable the dashboard (top-right) to monitor trend filter states and settings in real time.
⛔ False-Signal Reduction
Combining slope validation with multi-timeframe agreement filters out low-probability entries — useful for traders who prefer quality over quantity.
🧩 Professional Execution Layer
Integrated Stop Loss / Take Profit projection, cooldown logic, and anti-martingale control give it a disciplined, rule-based behavior — a hallmark of algorithmic consistency.
📡 Automation-Ready Alerts
The built-in Telegram / Discord alert module (JSON-formatted payloads) allows direct bot integration for remote monitoring — no additional coding required.
Unlike public MA crossover scripts, ZynAlgo Trendline includes proprietary logic for slope-weighted alignment, MTF aggregation, and confirmation-window entry detection.
🔶 RISK DISCLAIMER
Trading is risky & most day traders lose money. All content, tools, scripts, articles, & education provided by ZynAlgo are purely for informational & educational purposes only. Past performance does not guarantee future results.

reversalchartpatternsLibrary "reversalchartpatterns"
User Defined Types and Methods for reversal chart patterns - Double Top, Double Bottom, Triple Top, Triple Bottom, Cup and Handle, Inverted Cup and Handle, Head and Shoulders, Inverse Head and Shoulders
method delete(this)
Deletes the drawing components of ReversalChartPatternDrawing object
Namespace types: ReversalChartPatternDrawing
Parameters:
this (ReversalChartPatternDrawing) : ReversalChartPatternDrawing object
Returns: current ReversalChartPatternDrawing object
method delete(this)
Deletes the drawing components of ReversalChartPattern object. In turn calls the delete of ReversalChartPatternDrawing
Namespace types: ReversalChartPattern
Parameters:
this (ReversalChartPattern) : ReversalChartPattern object
Returns: current ReversalChartPattern object
method lpush(this, obj, limit, deleteOld)
Array push with limited number of items in the array. Old items are deleted when new one comes and exceeds the limit
Namespace types: array
Parameters:
this (array) : array object
obj (ReversalChartPattern) : ReversalChartPattern object which need to be pushed to the array
limit (int) : max items on the array. Default is 10
deleteOld (bool) : If set to true, also deletes the drawing objects. If not, the drawing objects are kept but the pattern object is removed from array. Default is false.
Returns: current ReversalChartPattern object
method draw(this)
Draws the components of ReversalChartPatternDrawing
Namespace types: ReversalChartPatternDrawing
Parameters:
this (ReversalChartPatternDrawing) : ReversalChartPatternDrawing object
Returns: current ReversalChartPatternDrawing object
method draw(this)
Draws the components of ReversalChartPatternDrawing within the ReversalChartPattern object.
Namespace types: ReversalChartPattern
Parameters:
this (ReversalChartPattern) : ReversalChartPattern object
Returns: current ReversalChartPattern object
method scan(zigzag, patterns, errorPercent, shoulderStart, shoulderEnd, allowedPatterns, offset)
Scans zigzag for ReversalChartPattern occurences
Namespace types: zg.Zigzag
Parameters:
zigzag (Zigzag type from Trendoscope/Zigzag/11) : ZigzagTypes.Zigzag object having array of zigzag pivots and other information on each pivots
patterns (array) : Existing patterns array. Used for validating duplicates
errorPercent (float) : Error threshold for considering ratios. Default is 13
shoulderStart (float) : Starting range of shoulder ratio. Used for identifying shoulders, handles and necklines
shoulderEnd (float) : Ending range of shoulder ratio. Used for identifying shoulders, handles and necklines
allowedPatterns (array) : array of int containing allowed pattern types
offset (int) : Offset of zigzag to consider only confirmed pivots
Returns: int pattern type
method createPattern(zigzag, patternType, patternColor, properties, offset)
Create Pattern from ZigzagTypes.Zigzag object
Namespace types: zg.Zigzag
Parameters:
zigzag (Zigzag type from Trendoscope/Zigzag/11) : ZigzagTypes.Zigzag object having array of zigzag pivots and other information on each pivots
patternType (int) : Type of pattern being created. 1 - Double Tap, 2 - Triple Tap, 3 - Cup and Handle, 4 - Head and Shoulders
patternColor (color) : Color in which the patterns are drawn
properties (ReversalChartTradeProperties)
offset (int)
Returns: ReversalChartPattern object created
method getName(this)
get pattern name of ReversalChartPattern object
Namespace types: ReversalChartPattern
Parameters:
this (ReversalChartPattern) : ReversalChartPattern object
Returns: string name of the pattern
method getDescription(this)
get consolidated description of ReversalChartPattern object
Namespace types: ReversalChartPattern
Parameters:
this (ReversalChartPattern) : ReversalChartPattern object
Returns: string consolidated description
method init(this)
initializes the ReversalChartPattern object and creates sub object types
Namespace types: ReversalChartPattern
Parameters:
this (ReversalChartPattern) : ReversalChartPattern object
Returns: ReversalChartPattern current object
ReversalChartPatternDrawing
Type which holds the drawing objects for Reversal Chart Pattern Types
Fields:
patternLines (array type from Trendoscope/Drawing/2) : array of Line objects representing pattern
entry (Line type from Trendoscope/Drawing/2) : Entry price Line
targets (array type from Trendoscope/Drawing/2)
stop (Line type from Trendoscope/Drawing/2) : Stop price Line
patternLabel (Label type from Trendoscope/Drawing/2)
ReversalChartTradeProperties
Trade properties of ReversalChartPattern
Fields:
riskAdjustment (series float) : Risk Adjustment for calculation of stop
useFixedTarget (series bool) : Boolean flag saying use fixed target type wherever possible. If fixed target type is not possible, then risk reward/fib ratios are used for calculation of targets
variableTargetType (series int) : Integer value which defines whether to use fib based targets or risk reward based targets. 1 - Risk Reward, 2 - Fib Ratios
variableTargetRatios (array) : Risk reward or Fib Ratios to be used for calculation of targets when fixed target is not possible or not enabled
entryPivotForWm (series int) : which Pivot should be considered as entry point for WM patterns. 0 refers to the latest breakout pivot where as 5 refers to initial pivot of the pattern
ReversalChartPattern
Reversal Chart Pattern master type which holds the pattern components, drawings and trade details
Fields:
pivots (array type from Trendoscope/Zigzag/11) : Array of Zigzag Pivots forming the pattern
patternType (series int) : Defines the main type of pattern 1 - Double Tap, 1 - Triple Tap, 3 - Cup and Handle, 4 - Head and Shoulders, 5- W/M Patterns, 6 - Full Trend, 7 - Half Trend
patternColor (series color) : Color in which the pattern will be drawn on chart
properties (ReversalChartTradeProperties)
drawing (ReversalChartPatternDrawing) : ReversalChartPatternDrawing object which holds the drawing components
trade (Trade type from Trendoscope/TradeTracker/1) : TradeTracker.Trade object holding trade components

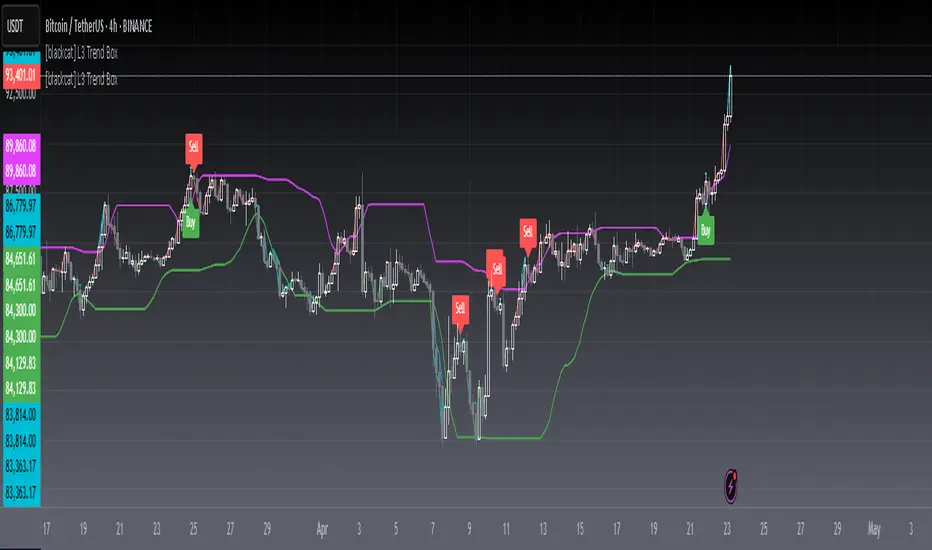
[blackcat] L3 Trend BoxOVERVIEW
The L3 Trend Box indicator is a sophisticated technical analysis tool designed to assist traders in identifying trends and pinpointing potential entry and exit points within the market. By leveraging multiple moving averages and price level analyses, this indicator provides a detailed view of market dynamics. It plots several key lines and labels directly onto the chart, offering clear visual signals for both bullish and bearish scenarios. Its adaptability through customizable parameters makes it suitable for various trading strategies and market conditions 📊✅.
FEATURES
Comprehensive Parameter Customization: Tailor the indicator to match specific trading preferences:
High Length: Defines the period over which the highest prices are considered.
Low Length: Specifies the period for evaluating the lowest prices.
Upper Box Length: Smoothes out the upper boundary of the trend box using a specified period.
Lower Box Length: Smoothes out the lower boundary of the trend box similarly.
Trend Line Length: Determines the period for calculating the overall trend line.
Fast EMA Length: Sets the period for the fast-moving exponential moving average (EMA), crucial for capturing short-term movements.
MA15 EMA Length: Configures the period for the medium-term moving average (MA15 EMA) to provide a balanced perspective.
Short Spirit Length: Influences how quickly the indicator responds to recent price changes.
Golden EMA Length: Fine-tunes the long-term EMA for stability and reliability.
Buy Price Length: Establishes the lookback period for determining optimal buy prices.
Var1 Length & Var2 Length: Adjusts periods for variance calculations, enhancing the accuracy of trend detection.
Detailed Chart Plots:
Upper Box Top: A fuchsia-colored line representing the smoothed highest prices, marking resistance levels.
Lower Box Bottom: A green-colored line showing the smoothed lowest prices, highlighting support zones.
MA15 Up/Down: Dynamic red and green lines illustrating the directionality of the 15-period EMA, helping gauge momentum shifts.
Conditional Plots: Multiple lines based on intricate price actions and computed values, such as closing below the lower box while also closing at or above/below the opening price, ensuring nuanced insights into market behavior.
Buy/Sell Labels: Clearly marked 'Buy' and 'Sell' labels positioned strategically on the chart, facilitating quick decision-making without missing critical signals 🎯.
Alert System: Automatically generates alerts based on predefined buy and sell conditions, enabling timely responses to market changes 🛎️.
HOW TO USE
Adding the Indicator: Start by adding the L3 Trend Box to your TradingView chart via the indicators menu.
Parameter Configuration: Adjust each parameter according to your trading style and market volatility. For instance, increasing the High Length can make the indicator less sensitive to minor fluctuations but more responsive to significant trends.
Monitoring Signals: Keep an eye on the plotted lines and labels. Pay special attention to the crossover events between the fast EMA and the lower box bottom, as these often signify strong buy signals.
Setting Alerts: Configure alerts based on the buy/sell conditions provided by the indicator. This ensures you never miss an opportunity due to inattention.
Combining Strategies: While powerful on its own, combining this indicator with others like RSI or Bollinger Bands can enhance its predictive power and reduce false positives.
LIMITATIONS
Market Volatility: In extremely volatile or sideways-trending markets, the indicator might produce false signals. Always verify with additional confirmations.
Asset-Specific Performance: Different assets and timeframes will yield varying results; thorough backtesting across diverse instruments is recommended.
Over-Reliance Risk: Avoid relying solely on this indicator. Integrate it into a broader analytical framework that includes fundamental analysis and other technical indicators.
NOTES
Data Sufficiency: Ensure ample historical data is available for precise computations. Lack of data can skew results and lead to inaccurate signals.
Demo Testing: Before deploying the indicator in real trades, rigorously test it on demo accounts under varied market conditions to understand its strengths and weaknesses.
Customization Flexibility: Feel free to tweak the parameters continuously until they align perfectly with your unique trading approach and risk tolerance.
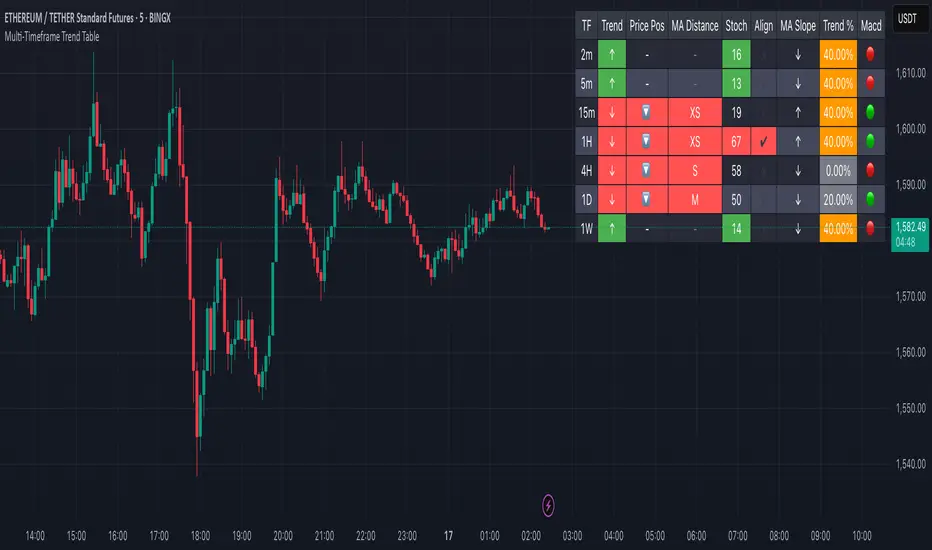
Multi-Timeframe Trend Table📊 Multi-Timeframe Trend Table
Overview
This powerful trend-tracking tool gives you a real-time snapshot of market trends across multiple timeframes — all in one compact and color-coded table. Designed for traders who want fast, clean, and multi-timeframe awareness at a glance.
⸻
✅ Features
• 7 Key Timeframes Monitored:
2min · 5min · 15min · 1h · 4h · 1d · 1w
• Trend Detection Based on EMAs
Uses a fast (default 20) and slow (default 200) EMA to determine if a timeframe is trending:
• 🟢 Uptrend: Fast EMA is above slow EMA
• 🔴 Downtrend: Slow EMA is above fast EMA
• 🟠 Sideways: EMAs are close (configurable threshold)
• Raw EMA Distance
See the actual difference between fast and slow EMAs for each timeframe — great for gauging trend strength.
• EMA Slope Analysis
A unique “Slope” column tells you the current behavior of EMAs:
• 📈 Pointing Up
• 📉 Pointing Down
• 🔄 Crossing Up/Down
• ➡️ Lateral
• Instant Alerts
Alerts fire the moment a trend flips on any timeframe, keeping you ahead of market shifts.
• Optional Chart EMAs
Toggle on/off the fast and slow EMAs on your active chart for extra clarity.
⸻
🧠 Use Case Examples
• Confirm trades with alignment across multiple timeframes
• Spot early trend reversals with crossing behavior
• Add a higher-timeframe filter to your scalping system
• Monitor key EMAs without changing your chart timeframe
⸻
⚙️ Configuration
• EMA lengths and sideways threshold are fully adjustable
• Enable/disable chart overlays for EMAs
• Table dynamically updates in real time
⸻
💡 Pro Tip: Use this indicator alongside your entry strategy to only trade in the direction of the dominant trends.
⸻
projectiontrackingLibrary "projectiontracking"
Library contains few data structures and methods for tracking harmonic patterns and projections via pinescript.
method erase(this)
erase Harmonic Projection Drawing
Namespace types: HarmonicProjectionDrawing
Parameters:
this (HarmonicProjectionDrawing) : HarmonicProjectionDrawing object
Returns: void
method erase(this)
erase HarmonicProjection
Namespace types: HarmonicProjection
Parameters:
this (HarmonicProjection) : HarmonicProjection object
Returns: void
method draw(this)
draw HarmonicProjection
Namespace types: HarmonicProjection
Parameters:
this (HarmonicProjection) : HarmonicProjection object
Returns: HarmonicProjection object
method getRanges(projectionPrzRanges, dir)
Convert PRZRange to Projection ranges
Namespace types: array
Parameters:
projectionPrzRanges (array type from Trendoscope/HarmonicMapLib/1) : array of PrzRange objects
dir (int) : Projection direction
Returns: array
ProjectionRange
Harmonic Projection Range
Fields:
patterns (array) : array of pattern names
start (series float) : Start Range
end (series float) : End Range
status (series int) : Projection Status
ProjectionProperties
Harmonic Projection Properties
Fields:
fillMajorTriangles (series bool) : Use linefill for major triangles
fillMinorTriangles (series bool) : Use linefill for minor triangles
majorFillTransparency (series int) : transparency of major triangles
minorFillTransparency (series int) : transparency of minor triangles
showXABC (series bool) : Show XABC labels
lblSizePivots (series string) : Pivot labels size
showRatios (series bool) : Show ratio labels
useLogScaleForScan (series bool) : Log scale is used for scanning projections
activateOnB (series bool) : Activate projections on reaching B
activationRatio (series float) : Use activation ratio for activation
confirmationRatio (series float) : Confirmation ratio of projection before removal
HarmonicProjectionDrawing
Harmonic Projection Projection drawing objects
Fields:
xa (series line) : line xa
ab (series line) : line ab
bc (series line) : line bc
xb (series line) : line xb
ac (series line) : line ac
x (series label) : Pivot label x
a (series label) : Pivot label a
b (series label) : Pivot label b
c (series label) : Pivot label c
xabRatio (series label) : Label XAB Ratio
abcRatio (series label) : Label ABC Ratio
HarmonicProjection
Harmonic Projection Projection object
Fields:
patternId (series int) : id of the pattern
dir (series int) : projection direction
x (chart.point) : Pivot X
a (chart.point) : Pivot A
b (chart.point) : Pivot B
c (chart.point) : Pivot C
patternColor (series color) : Color in which pattern is displayed
przRange (PrzRange type from Trendoscope/HarmonicMapLib/1) : PRZ Range
activationPrice (series float) : Projection activation price
reversalPrice (series float) : Projection reversal price
status (series int) : Projection status
properties (ProjectionProperties) : Projection properties
projectionRanges (array) : array of Projection Ranges
initialD (series float) : Initial D pivot
d (chart.point) : Pivot D
drawing (HarmonicProjectionDrawing) : HarmonicProjectionDrawing Object

ACCURATE TREND LEVELS - TABLE PSv6.1Accurate Trend Level Indicator
Description:
The "Accurate Trend Level" indicator is a powerful tool designed to identify market trends and potential reversals with precision. Built on the concept (foundation) of Swing Highs and Swing Lows, this indicator easily detects uptrends and downtrends, providing traders with clear signals for trend continuation or reversal. Whether you are a swing trader or a trend follower, this indicator offers customization options to suit your trading style.
Key Features:
Trend Identification: Accurately identifies uptrends and downtrends based on Swing High and Swing Low points. This indicator provides signals for Up after Down and Down after Up.
Percentage Adjustment: Includes a customizable percentage factor that reduces false signals and helps identify accurate and strong trends.
Trend Table: Displays essential data in a table, such as:
Last and running Trend Position (Uptrend/Downtrend)
Date and Time of the last and running trend change
Reversal Level (price level for the next potential trend change)
Max. Run-up feature is also provided, which shows how much the market has moved according to the trend.
How It Works:
The indicator analyzes price action using Swing Highs and Lows to determine the current trend direction. A user-defined percentage threshold filters out minor fluctuations, ensuring only significant trends are highlighted. The table provides a quick snapshot of the latest trend data, while reversal levels help traders anticipate the next move.

Dual Zigzag [Trendoscope®]🎲 Dual Zigzag indicator is built on recursive zigzag algorithm. It is very similar to other zigzag indicators published by us and other authors. However, the key point here is, the indicator draws zigzag on both price and any other plot based indicator on separate layouts.
Before we get into the indicator, here are some brief descriptions of the underlying concepts and key terminologies
🎯 Zigzag
Zigzag indicator breaks down price or any input series into a series of Pivot Highs and Pivot Lows alternating between each other. Zigzags though shows pivot high and lows, should not be used for buying at low and selling at high. The main application of zigzag indicator is for the visualisation of market structure and this can be used as basic building block for any pattern recognition algorithms.
🎯 Recursive Zigzag Algorithm
Recursive zigzag algorithm builds zigzag on multiple levels and each level of zigzag is based on the previous level pivots. The level zero zigzag is built on price. However, for level 1, instead of price level 0 zigzag pivots are used. Similarly for level 2, level 1 zigzag pivots are used as base.
🎲 Components Dual Zigzag Indicator
Here are the components of Dual zigzag indicator
Built in Oscillator - Indicator has built in oscillator options for plotting RSI (Relative Strength Index), MFI (Money Flow Index), cci (Commodity Channel Index) , CMO (Chande Momentum Oscillator), COG (Center of Gravity), and ROC (Rate of Change). Apart from the given built in oscillators, users can also use a custom external output as base. The oscillators are not printed on the price pane. But, printed on a separate indicator overlay.
Zigzag On Oscillator - Recursive zigzag is calculated and printed on the oscillator series. Each pivot high and pivot low also prints a label having the retracement ratios, and price levels at those points. Zigzag on the oscillator is also printed on the indicator overlay pane.
Zigzag on Price - Recursive zigzag calculated based on price and printed on the price pane. This is made possible by using force_overlay option present in the drawing objects. At each zigzag pivot levels, the label having price retracement ratios, and oscillator values are printed.
It is called dual zigzag because, the indicator calculates the zigzag on both price and oscillator series of values and prints them separately on different panes on the chart.
🎲 Indicator Settings
Settings include
Theme display settings to get the right colour combination to match the background.
Zigzag settings to be used for zigzag calculation and display
Oscillator settings to chose the oscillator to be used as base for 2nd zigzag
🎲 Applications
Useful in spotting divergences with both indicator and price having their own zigzag to highlight pivots
Spotting patterns in indicators/oscillators and correlate them with the patterns on price
🎲 Using External Input
If users want to use an external indicator such as OBV instead of the built in oscillators, then can do so by using the custom option.
Here is how this can be done.
Step1. Add both Dual Zigzag and the intended indicator (in this case OBV) on the chart. Notice that both OBV and Dual zigzag appear on different panes.
Step2. Edit the indicator settings of Dual zigzag and set custom indicator by selecting "custom" as oscillator name and then by setting the custom external indicator name and input.
Step 3. You would notice that the zigzag in Dual Zigzag indictor pane is already showing the zigzag pivots based on the OBV indicator and the price pivots display obv values at the pivot points. We can leave this as is.
Step 4. As an additional step, you can also merge the OBV pane and the Dual zigzag indicator pane into one by going into OBV settings and moving the indicator to above pane. Merge the scales so that there is no two scales on the same pane and the entire scale appear on the right.
At the end, you should see two panes - one with price and other with OBV and both having their zigzag plotted.

HTF Candles Overlay [Trendoscope®]🎲 HTF Candles Overlay is a simple indicator where you can overlay higher timeframe candles on current timeframe chart.
Most of the code is encapsulated in the library HTFCandlesLib . After publishing the library as open source, many people requested to convert that into an indicator. Based on this, we decided to publish this small code for the use of community.
🎯 Usage
The indicator is simple, it helps users visualise higher timeframe candles. We majorly use this for debugging or validating our implementations based on higher timeframe. Instead of switching back and forth to different timeframes, it helps us visualise higher timeframe candles on the same chart when we are validating the implementation that involves higher timeframe calculations.
🎯 Components
The indicator provides two types of displays
Candles - overlay candles built through lines and labels
Plot - close price of higher timeframe plotted on chart
🎯 Candles
The behaviour of the candles are similar to that of hollow candles. The color of the body and the border+wick demonstrates the movement of the candle.
Body color is lime if the HTF close is higher than HTF open. Body color is orange if the HTF close is lower than the HTF open.
Wick and border color is lime if HTF close price is higher than previous HTF close price. And they are orange if HTF close price is lower than the previous HTF close price
In most cases body color will be same as the wick color. In case of stocks and indices, it may happen that the open price is too far away from previous close price due to gaps. This can lead to close price being relatively in different direction when compared to open and previous close.
Wicks are not at the centre of the candle. Instead wicks are drawn on the current chart timeframe position where the current timeframe has reached the highest or lowest point within the given HTF candle
Candles also list OHLC price of HTF candle along with HTF bar index and the range of LTF bar index that the candle spawns
Here are some pictorial representations that can help understand better.
Here are the examples of candles with gaps where body and wick/border are in different directions (colours)
🎯 Indicator Settings
Simple settings allow users to select the timeframe, whether to display candles and plots and their specific colors.
🎯 Possible inconsistencies
The overlay can show inconsistent data in certain situations. Here are some of the scenarios where the indicator may not show consistent display of the data.
When the HTF data from request.security does not match that of combined LTF data . In such cases, HTF candles may not form inline with the current timeframe candles. This happens when there is a data issue of different OHLC data available in tradingview.
When using weekly candle as either chart timeframe or higher timeframe - end of week may not coincide with end of month or other timeframes. This can cause some inconsistencies in the visuals of the indicator.
When open and close time of either LTF or HTF falls under different day due to time zone used. - time is always the time on which the candle close. So, when we use time zone that causes the exchange day to open and close on different days, that can cause some inconsistencies in the candles being drawn.

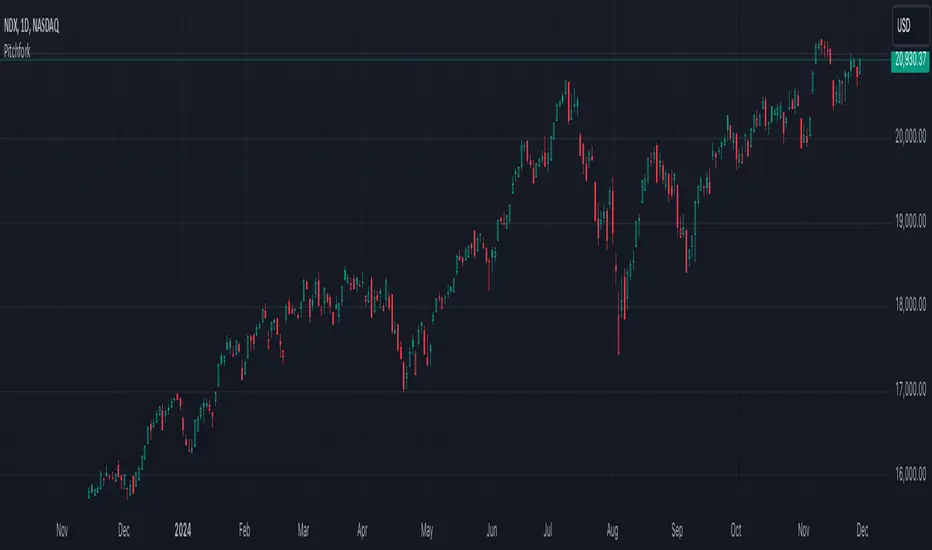
PitchforkLibrary "Pitchfork"
Pitchfork class
method tostring(this)
Converts PitchforkTypes/Fork object to string representation
Namespace types: Fork
Parameters:
this (Fork) : PitchforkTypes/Fork object
Returns: string representation of PitchforkTypes/Fork
method tostring(this)
Converts Array of PitchforkTypes/Fork object to string representation
Namespace types: array
Parameters:
this (array) : Array of PitchforkTypes/Fork object
Returns: string representation of PitchforkTypes/Fork array
method tostring(this, sortKeys, sortOrder)
Converts PitchforkTypes/PitchforkProperties object to string representation
Namespace types: PitchforkProperties
Parameters:
this (PitchforkProperties) : PitchforkTypes/PitchforkProperties object
sortKeys (bool) : If set to true, string output is sorted by keys.
sortOrder (int) : Applicable only if sortKeys is set to true. Positive number will sort them in ascending order whreas negative numer will sort them in descending order. Passing 0 will not sort the keys
Returns: string representation of PitchforkTypes/PitchforkProperties
method tostring(this, sortKeys, sortOrder)
Converts PitchforkTypes/PitchforkDrawingProperties object to string representation
Namespace types: PitchforkDrawingProperties
Parameters:
this (PitchforkDrawingProperties) : PitchforkTypes/PitchforkDrawingProperties object
sortKeys (bool) : If set to true, string output is sorted by keys.
sortOrder (int) : Applicable only if sortKeys is set to true. Positive number will sort them in ascending order whreas negative numer will sort them in descending order. Passing 0 will not sort the keys
Returns: string representation of PitchforkTypes/PitchforkDrawingProperties
method tostring(this, sortKeys, sortOrder)
Converts PitchforkTypes/Pitchfork object to string representation
Namespace types: Pitchfork
Parameters:
this (Pitchfork) : PitchforkTypes/Pitchfork object
sortKeys (bool) : If set to true, string output is sorted by keys.
sortOrder (int) : Applicable only if sortKeys is set to true. Positive number will sort them in ascending order whreas negative numer will sort them in descending order. Passing 0 will not sort the keys
Returns: string representation of PitchforkTypes/Pitchfork
method createDrawing(this)
Creates PitchforkTypes/PitchforkDrawing from PitchforkTypes/Pitchfork object
Namespace types: Pitchfork
Parameters:
this (Pitchfork) : PitchforkTypes/Pitchfork object
Returns: PitchforkTypes/PitchforkDrawing object created
method createDrawing(this)
Creates PitchforkTypes/PitchforkDrawing array from PitchforkTypes/Pitchfork array of objects
Namespace types: array
Parameters:
this (array) : array of PitchforkTypes/Pitchfork object
Returns: array of PitchforkTypes/PitchforkDrawing object created
method draw(this)
draws from PitchforkTypes/PitchforkDrawing object
Namespace types: PitchforkDrawing
Parameters:
this (PitchforkDrawing) : PitchforkTypes/PitchforkDrawing object
Returns: PitchforkTypes/PitchforkDrawing object drawn
method delete(this)
deletes PitchforkTypes/PitchforkDrawing object
Namespace types: PitchforkDrawing
Parameters:
this (PitchforkDrawing) : PitchforkTypes/PitchforkDrawing object
Returns: PitchforkTypes/PitchforkDrawing object deleted
method delete(this)
deletes underlying drawing of PitchforkTypes/Pitchfork object
Namespace types: Pitchfork
Parameters:
this (Pitchfork) : PitchforkTypes/Pitchfork object
Returns: PitchforkTypes/Pitchfork object deleted
method delete(this)
deletes array of PitchforkTypes/PitchforkDrawing objects
Namespace types: array
Parameters:
this (array) : Array of PitchforkTypes/PitchforkDrawing object
Returns: Array of PitchforkTypes/PitchforkDrawing object deleted
method delete(this)
deletes underlying drawing in array of PitchforkTypes/Pitchfork objects
Namespace types: array
Parameters:
this (array) : Array of PitchforkTypes/Pitchfork object
Returns: Array of PitchforkTypes/Pitchfork object deleted
method clear(this)
deletes array of PitchforkTypes/PitchforkDrawing objects and clears the array
Namespace types: array
Parameters:
this (array) : Array of PitchforkTypes/PitchforkDrawing object
Returns: void
method clear(this)
deletes array of PitchforkTypes/Pitchfork objects and clears the array
Namespace types: array
Parameters:
this (array) : Array of Pitchfork/Pitchfork object
Returns: void
PitchforkDrawingProperties
Pitchfork Drawing Properties object
Fields:
extend (series bool) : If set to true, forks are extended towards right. Default is true
fill (series bool) : Fill forklines with transparent color. Default is true
fillTransparency (series int) : Transparency at which fills are made. Only considered when fill is set. Default is 80
forceCommonColor (series bool) : Force use of common color for forks and fills. Default is false
commonColor (series color) : common fill color. Used only if ratio specific fill colors are not available or if forceCommonColor is set to true.
PitchforkDrawing
Pitchfork drawing components
Fields:
medianLine (Line type from Trendoscope/Drawing/2) : Median line of the pitchfork
baseLine (Line type from Trendoscope/Drawing/2) : Base line of the pitchfork
forkLines (array type from Trendoscope/Drawing/2) : fork lines of the pitchfork
linefills (array type from Trendoscope/Drawing/2) : Linefills between forks
Fork
Fork object property
Fields:
ratio (series float) : Fork ratio
forkColor (series color) : color of fork. Default is blue
include (series bool) : flag to include the fork in drawing. Default is true
PitchforkProperties
Pitchfork Properties
Fields:
forks (array) : Array of Fork objects
type (series string) : Pitchfork type. Supported values are "regular", "schiff", "mschiff", Default is regular
inside (series bool) : Flag to identify if to draw inside fork. If set to true, inside fork will be drawn
Pitchfork
Pitchfork object
Fields:
a (chart.point) : Pivot Point A of pitchfork
b (chart.point) : Pivot Point B of pitchfork
c (chart.point) : Pivot Point C of pitchfork
properties (PitchforkProperties) : PitchforkProperties object which determines type and composition of pitchfork
dProperties (PitchforkDrawingProperties) : Drawing properties for pitchfork
lProperties (LineProperties type from Trendoscope/Drawing/2) : Common line properties for Pitchfork lines
drawing (PitchforkDrawing) : PitchforkDrawing object
utilsLibrary "utils"
Few essentials captured together (subset of arrayutils)
timer(timeStart, timeEnd)
finds difference between two timestamps
Parameters:
timeStart (int) : start timestamp
timeEnd (int)
Returns:
method check_overflow(pivots, barArray, dir)
finds difference between two timestamps
Namespace types: array
Parameters:
pivots (array) : pivots array
barArray (array) : pivot bar array
dir (int) : direction for which overflow need to be checked
Returns: bool overflow
method get_trend_series(pivots, length, highLow, trend)
finds series of pivots in particular trend
Namespace types: array
Parameters:
pivots (array) : pivots array
length (int) : length for which trend series need to be checked
highLow (int) : filter pivot high or low
trend (int) : Uptrend or Downtrend
Returns: int trendIndexes
method get_trend_series(pivots, firstIndex, lastIndex)
finds series of pivots in particular trend
Namespace types: array
Parameters:
pivots (array) : pivots array
firstIndex (int) : First index of the series
lastIndex (int) : Last index of the series
Returns: int trendIndexes
getConsolidatedLabel(include, labels, separator)
Consolidates labels into single string by concatenating it with given separator
Parameters:
include (array) : array of conditions to include label or not
labels (array) : string array of labels
separator (string) : Separator for concatenating labels
Returns: string labelText
method getColors(theme)
gets array of colors based on theme
Namespace types: series Theme
Parameters:
theme (series Theme) : dark or light theme
Returns: color themeColors

UDC - Local TrendsUDC - Local Trends Indicator
Overview:
The UDC - Local Trends Indicator combines multiple moving averages to provide a clear visualization of both local and high timeframe (HTF) trends. This indicator helps traders make informed decisions by highlighting key moving averages and trend zones, making it easier to determine whether the current trend is likely to continue or reverse.
Features:
Local Trend Zone: Displays the range between the 13 and 34 EMAs, with an average line in the middle. This zone is plotted close to the price candles, offering a clear visual guide for the immediate trend on the timeframe you’re viewing.
Usage: Observe the strength of the local trend within this zone. Breaks from this zone may indicate potential moves toward the 200 moving averages, providing early signals for trend continuation or potential reversals.
Current Trend Indicators:
Tracks the broader trend using the 200 EMA and 200 SMA on the active timeframe. Choose a timeframe where these trend lines hold significance and use them alongside support and resistance for precise entries and exits.
Cross-Timeframe Trend Reference:
On all sub-daily timeframes, the daily 200 moving average is overlaid, ensuring this essential trend line is visible even on shorter timeframes, like 4H, where reclaims or rejections of the daily 200 can signal strong trading setups.
The weekly 50 moving average, a critical HTF trend line, is also displayed consistently, guiding higher timeframe swing trade setups.
Trading Strategy:
Local Timeframe Trading:
Monitor the 200 moving averages in your active timeframe to identify bounces or breakdowns. If the local trend zone (13-34 EMA range) is lost, expect a possible pullback to the 200 moving averages, offering a chance for re-entry or confirmation of trend reversal.
High Timeframe Trading (HTF):
For swing trades, observe the daily 200 and weekly 50 moving averages. Reclaiming these lines often triggers long setups, while losing them may signal further downside until they’re regained.
This indicator offers a powerful combination of localized trend tracking and high timeframe support, enabling traders to align their entries with both immediate and overarching market

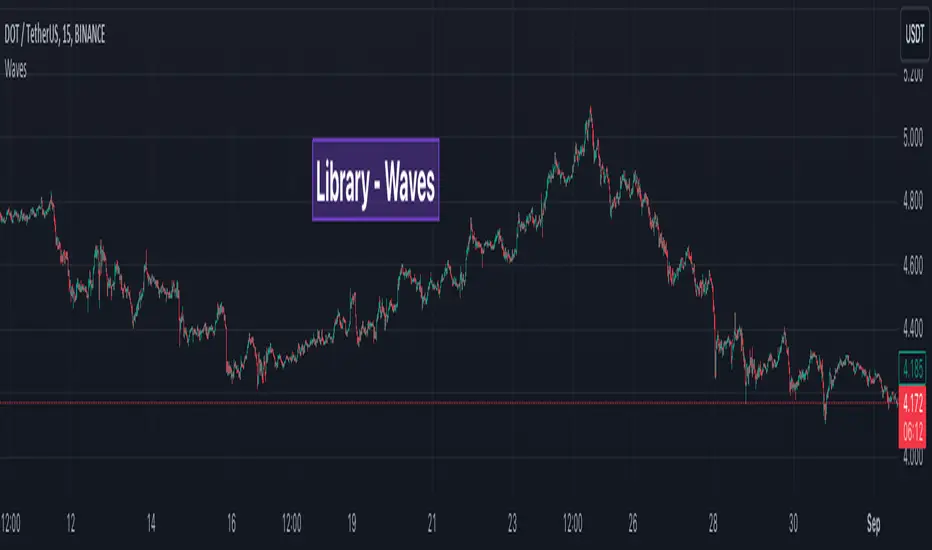
WavesLibrary "Waves"
Methods for elliot wave detection
method delete(this)
deletes the subwave drawing
Namespace types: Subwave
Parameters:
this (Subwave) : Subwave object to be deleted
Returns: deleted subwave object
method delete(this)
deletes the wave drawing and the corresponding subwaves
Namespace types: Wave
Parameters:
this (Wave) : Wave object to be deleted
Returns: deleted wave object
method createWave(pivot, lineColor, waves, limit)
Create wave object
Namespace types: zg.Pivot
Parameters:
pivot (Pivot type from Trendoscope/Zigzag/7) : pivot object where the wave needs to be created
lineColor (color) : color of the wave to be drawn
waves (array) : array of existing waves
limit (int) : max number of waves to be shown in the chart
Returns: wave object created
method createSubWaves(wave, subwavePivots)
Create sub waves for the wave
Namespace types: Wave
Parameters:
wave (Wave)
subwavePivots (array) : array of sub wave pivots
Returns: wave object created
method draw(subWave)
Draw subwave
Namespace types: Subwave
Parameters:
subWave (Subwave)
Returns: subwsubWave object
method draw(wave, limitSubwaves)
Draw Wave
Namespace types: Wave
Parameters:
wave (Wave) : Wave object to be drawn
limitSubwaves (bool) : limit the number of subwave combinations within the wave
Returns: wave object
method checkMotiveWave(prices)
based on the price array, check if there is motive wave and identify the type
Namespace types: array
Parameters:
prices (array) : float array of prices
Returns: WaveType representing the identified wave type. na otherwise
method scanMotiveWave(pivot, lastPivot, existingWaves, allowedTypes)
Scan for motive wave
Namespace types: zg.Pivot
Parameters:
pivot (Pivot type from Trendoscope/Zigzag/7) : Zigzag pivot that will be checked for motive wave
lastPivot (Pivot type from Trendoscope/Zigzag/7) : previous Zigzag pivot
existingWaves (array) : array of existing waves
allowedTypes (array) : allowed Wave types to filter them
Returns: array of subwave pivots
SubwavePivots
SubwavePivots represents the sub pivots of the main wave
Fields:
waveType (series WaveType) : Type of the Wave
indices (array) : Bar index values of sub waves
subPivots (array type from Trendoscope/Zigzag/7) : sub pivot objects of the wave
Subwave
Subwave represents the drawing of sub waves
Fields:
waves (array type from Trendoscope/Drawing/1) : array of sub wave lines
points (array type from Trendoscope/Drawing/1) : Array of subwave pivot labels
subwavePivots (SubwavePivots) : array of subwave pivots being drawn
Wave
Wave object type
Fields:
pivot (Pivot type from Trendoscope/Zigzag/7) : starting point of the wave
wave (Line type from Trendoscope/Drawing/1) : Line representing the wave
waveLabel (Label type from Trendoscope/Drawing/1) : label containing wave details
subWaves (array) : array of sub waves
Oscillator Scatterplot Analysis [Trendoscope®]In this indicator, we demonstrate how to plot oscillator behavior of oversold-overbought against price movements in the form of scatterplots and perform analysis. Scatterplots are drawn on a graph containing x and y-axis, where x represent one measure whereas y represents another. We use the library Graph to collect the data and plot it as scatterplot.
Pictorial explanation of components is defined in the chart below.
🎲 This indicator performs following tasks
Calculate and plot oscillator
Identify oversold and overbought areas based on various methods
Measure the price and bar movement from overbought to oversold and vice versa and plot them on the chart.
In our example,
The x-axis represents price movement. The plots found on the right side of the graph has positive price movements, whereas the plots found on the left side of the graph has negative price movements.
The y-axis represents the number of bars it took for reaching overbought to oversold and/or oversold to overbought. Positive bars mean we are measuring oversold to overbought, whereas negative bars are a measure of overbought to oversold.
🎲 Graph is divided into 4 equal quadrants
Quadrant 1 is the top right portion of the graph. Plots in this quadrant represent the instances where positive price movement is observed when the oscillator moved from oversold to overbought
Quadrant 2 is the top left portion of the graph. Plots in this quadrant represent the instances where negative price movement is observed when the oscillator moved from oversold to overbought.
Quadrant 3 is the bottom left portion of the chart. Plots in this quadrant represent the instances where negative price movement is observed when the oscillator moved from overbought to oversold.
Quadrant 4 is the bottom right portion of the chart. Plots in this quadrant represent the instances where positive price movement is observed when the oscillator moved from overbought to oversold.
🎲 Indicator components in Detail
Let's dive deep into the indicator.
🎯 Oscillator Selection
Select the Oscillator and define the overbought oversold conditions through input settings
Indicator - Oscillator base used for performing analysis
Length - Loopback length on which the oscillator is calculated
OB/OS Method - We use Bollinger Bands, Keltener Channel and Donchian channel to calculate dynamic overbought and oversold levels instead of static 80-10. This is also useful as other type of indicators may not be within 0-100 range.
Length and Multiplier are used for the bands for calculating Overbought/Oversold boundaries.
🎯 Define Graph Properties
Select different graph properties from the input settings that will instruct how to display the scatterplot.
Type - this can be either scatterplot or heatmap. Scatterplot will display plots with specific transparency to indicate the data, whereas heatmap will display background with different transparencies.
Plot Color - this is the color in which the scatterplot or heatmap is drawn
Plot Size - applicable mainly for scatterplot. Since the character we use for scatterplot is very tiny, the large at present looks optimal. But, based on the user's screen size, we may need to select different sizes so that it will render properly.
Rows and Columns - Number of rows and columns allocated per quadrant. This means, the total size of the chart is 2X rows and 2X columns. Data sets are divided into buckets based on the number of available rows and columns. Hence, changing this can change the appearance of the overall chart, even though they are representing the same data. Also, please note that tables can have max 10000 cells. If we increase the rows and columns by too much, we may get runtime errors.
Outliers - this is used to exclude the extreme data. 20% outlier means, the chart will ignore bottom 20% and top 20% when defining the chart boundaries. However, the extreme data is still added to the boundaries.

EMA Trend Arrows Indicator### EMA Trend Arrows Indicator
**Description:**
The "EMA Trend Arrows Indicator" is designed to help traders identify bullish and bearish trends based on the Exponential Moving Average (EMA). This indicator plots arrows and lines on the chart, signaling potential trend changes, making it easier for users to spot entry and exit points in their trades.
**Indicator Features:**
1. **EMA Calculation:**
- The indicator calculates the Exponential Moving Average (EMA) over a user-defined period (`Length`).
- The default length is set to 50 periods but can be adjusted to suit different trading strategies.
2. **Trend Detection:**
- The indicator detects bullish trends when the EMA is falling for a specified duration (`Trend Duration`) and then starts rising.
- Conversely, it detects bearish trends when the EMA is rising for a specified duration and then starts falling.
- The default trend duration is set to 20 periods.
3. **Visual Signals:**
- **Bullish Signal:** When a bullish trend is detected, the indicator plots a blue upward arrow (▲) above the bar where the trend change is identified.
- **Bearish Signal:** When a bearish trend is detected, the indicator plots a red downward arrow (▼) below the bar where the trend change is identified.
- Additionally, lines are drawn to indicate the strength and duration of the trends. Blue lines represent bullish trends, while red lines represent bearish trends.
4. **Average True Range (ATR):**
- The indicator utilizes the Average True Range (ATR) to determine the placement of the lines and arrows, ensuring they are appropriately scaled to the price movements.
5. **EMA Plotting:**
- The EMA line is plotted on the chart in a grey color, allowing users to visualize the moving average alongside the trend signals.
6. **Chart Clarity:**
- To maintain a clear and uncluttered chart, the indicator automatically deletes past trend direction signals once a new trend is detected. This ensures that only the most relevant and current trend signals are displayed.
**User Inputs:**
- `Length`: Defines the period for EMA calculation. Default is 50.
- `Trend Duration`: Sets the duration to consider for trend changes. Default is 20.
- `Bullish`: Sets the color for bullish signals. Default is blue (#2962ff).
- `Bearish`: Sets the color for bearish signals. Default is red (#f23645).
- `MA`: Sets the color for the EMA line. Default is grey (#787b86).
**How to Use:**
- Add the "EMA Trend Arrows Indicator" to your chart.
- Configure the `Length` and `Trend Duration` based on your trading strategy.
- Observe the chart for blue upward arrows indicating potential buy signals and red downward arrows indicating potential sell signals.
- Use the plotted EMA line to gauge the overall market trend and make more informed trading decisions.
**Benefits:**
- Simplifies trend detection by providing clear visual signals.
- Helps traders identify potential entry and exit points.
- Customizable settings to fit various trading strategies.
- Maintains a clean chart by automatically removing outdated trend direction signals.
**Example:**
When applied to a daily chart, the indicator can help identify major trend reversals, providing traders with timely buy and sell signals. For instance, a blue arrow appearing after a period of EMA decline signals a potential buying opportunity as the trend shifts to bullish.
Add this indicator to your TradingView chart today to enhance your trend analysis and improve your trading performance.
Best regards Chervolino

Super Trend and RSI Strategy### Super Trend and RSI Strategy: A Brief Overview
The Super Trend and RSI (Relative Strength Index) strategy is a popular trading approach that combines the trend-following capabilities of the Super Trend indicator with the momentum analysis of the RSI. This hybrid strategy aims to provide traders with reliable entry and exit signals by confirming trends and identifying potential reversals.
#### Super Trend Indicator
The Super Trend indicator is a trend-following tool that signals the current market direction. It is calculated using the Average True Range (ATR) to identify volatility and price movement. The indicator plots lines above or below the price, signaling bullish (green) or bearish (red) trends:
- **Buy Signal**: When the price crosses above the Super Trend line and the line turns green.
- **Sell Signal**: When the price crosses below the Super Trend line and the line turns red.
#### Relative Strength Index (RSI)
The RSI is a momentum oscillator that measures the speed and change of price movements on a scale from 0 to 100. It helps identify overbought or oversold conditions:
- **Overbought Condition**: RSI value above 70, suggesting the asset may be overvalued and a correction could be imminent.
- **Oversold Condition**: RSI value below 30, suggesting the asset may be undervalued and a rebound could be imminent.
#### Strategy Implementation
1. **Trend Confirmation with Super Trend**:
- Enter a long position (buy) when the Super Trend turns green and the price closes above it.
- Enter a short position (sell) when the Super Trend turns red and the price closes below it.
2. **Momentum Confirmation with RSI**:
- For long positions, ensure the RSI is not in the overbought zone (preferably below 70).
- For short positions, ensure the RSI is not in the oversold zone (preferably above 30).
3. **Entry Signals**:
- **Buy Signal**: Super Trend turns green, price closes above the Super Trend line, and RSI is below 70.
- **Sell Signal**: Super Trend turns red, price closes below the Super Trend line, and RSI is above 30.
4. **Exit Signals**:
- Close long positions when the Super Trend turns red or the RSI enters the overbought zone.
- Close short positions when the Super Trend turns green or the RSI enters the oversold zone.
#### Advantages and Considerations
- **Advantages**:
- Combines trend-following and momentum analysis for more robust signals.
- Helps filter out false signals by requiring confirmation from both indicators.
- **Considerations**:
- Like all trading strategies, it is not foolproof and can generate false signals.
- Best used in conjunction with other analysis techniques and proper risk management.
- Performance can vary across different market conditions and timeframes.
The Super Trend and RSI strategy is a versatile tool that can enhance trading decisions by providing clearer entry and exit points, helping traders capture significant market moves while avoiding potential pitfalls of relying on a single indicator.

divergingchartpatternLibrary "divergingchartpattern"
Library having implementation of converging chart patterns
getPatternNameByType(patternType)
Returns pattern name based on type
Parameters:
patternType (int) : integer value representing pattern type
Returns: string name of the pattern
method find(this, sProperties, dProperties, patterns, ohlcArray)
find converging patterns for given zigzag
Namespace types: zg.Zigzag
Parameters:
this (Zigzag type from Trendoscope/ZigzagLite/2) : Current zigzag Object
sProperties (ScanProperties) : ScanProperties Object
dProperties (DrawingProperties type from Trendoscope/abstractchartpatterns/5) : DrawingProperties Object
patterns (array type from Trendoscope/abstractchartpatterns/5) : array of existing patterns to check for duplicates
ohlcArray (array type from Trendoscope/ohlc/1) : array of OHLC values for historical reference
Returns: string name of the pattern
ScanProperties
Object containing properties for pattern scanning
Fields:
baseProperties (ScanProperties type from Trendoscope/abstractchartpatterns/5) : Object of Base Scan Properties
convergingDistanceMultiplier (series float)
convergingpatternsLibrary "convergingpatterns"
Library having implementation of converging chart patterns
getPatternNameByType(patternType)
Returns pattern name based on type
Parameters:
patternType (int) : integer value representing pattern type
Returns: string name of the pattern
method find(this, sProperties, dProperties, patterns, ohlcArray)
find converging patterns for given zigzag
Namespace types: zg.Zigzag
Parameters:
this (Zigzag type from Trendoscope/ZigzagLite/2) : Current zigzag Object
sProperties (ScanProperties) : ScanProperties Object
dProperties (DrawingProperties type from Trendoscope/abstractchartpatterns/5) : DrawingProperties Object
patterns (array type from Trendoscope/abstractchartpatterns/5) : array of existing patterns to check for duplicates
ohlcArray (array type from Trendoscope/ohlc/1) : array of OHLC values for historical reference
Returns: string name of the pattern
ScanProperties
Object containing properties for pattern scanning
Fields:
baseProperties (ScanProperties type from Trendoscope/abstractchartpatterns/5) : Object of Base Scan Properties
convergingDistanceMultiplier (series float) : when multiplied with pattern size gets the max number of bars within which the pattern should converge
basechartpatternsLibrary "basechartpatterns"
Library having complete chart pattern implementation
getPatternNameById(id)
Returns pattern name by id
Parameters:
id (int) : pattern id
Returns: Pattern name
method find(points, properties, dProperties, ohlcArray)
Find patterns based on array of points
Namespace types: chart.point
Parameters:
points (chart.point ) : array of chart.point objects
properties (ScanProperties type from Trendoscope/abstractchartpatterns/1) : ScanProperties object
dProperties (DrawingProperties type from Trendoscope/abstractchartpatterns/1) : DrawingProperties object
ohlcArray (OHLC type from Trendoscope/ohlc/1)
Returns: Flag indicating if the pattern is valid, Current Pattern object
method find(this, properties, dProperties, patterns, ohlcArray)
Find patterns based on the currect zigzag object but will not store them in the pattern array.
Namespace types: zg.Zigzag
Parameters:
this (Zigzag type from Trendoscope/ZigzagLite/2) : Zigzag object containing pivots
properties (ScanProperties type from Trendoscope/abstractchartpatterns/1) : ScanProperties object
dProperties (DrawingProperties type from Trendoscope/abstractchartpatterns/1) : DrawingProperties object
patterns (Pattern type from Trendoscope/abstractchartpatterns/1) : Array of Pattern objects
ohlcArray (OHLC type from Trendoscope/ohlc/1)
Returns: Flag indicating if the pattern is valid, Current Pattern object
RMB - Trend AnalysisRMB - Trend Analysis Indicator
Overview:
The "RMB - Trend Analysis" indicator is a powerful tool designed for traders who need a quick and clear visual representation of the trend direction across multiple timeframes. This indicator simplifies the process of trend analysis by displaying trend direction symbols on the chart, allowing traders to make informed decisions. This indicator is usable for all instruments.
Key Features:
Multi-Timeframe Analysis: Provides trend direction for weekly, daily, 4-hour, 2-hour, 1-hour, 30-minute, and 15-minute timeframes.
Trend Direction Symbols: Utilizes intuitive arrow symbols to indicate the trend direction. An upward arrow (↑) signifies an uptrend, while a downward arrow (↓) indicates a downtrend.
Color-Coded Trends: Arrows are color-coded for enhanced visibility and quick interpretation. Green arrows represent uptrends, and red arrows denote downtrends.
Dynamic Updates: The indicator updates the trend symbols in real-time as new price data becomes available, ensuring traders are always informed of the latest trend changes.
Customizable and User-Friendly: Designed with user experience in mind, the indicator is easy to add to any chart and integrates seamlessly with TradingView's interface.
Usage:
This indicator is particularly useful for traders who employ multi-timeframe analysis in their trading strategy. By providing a snapshot of trend directions across different timeframes, it helps in identifying potential entry and exit points, confirming trend continuations, or spotting trend reversals. Whether you are a day trader, swing trader, or long-term investor, the "RMB - Trend Analysis" indicator can be a valuable addition to your trading toolkit.
How it Works:
The indicator calculates the trend direction based on a Simple Moving Average (SMA) over 14 periods. It then displays this information as arrow symbols on the chart, with each symbol corresponding to a specific timeframe. The position and color of these arrows provide an at-a-glance view of the current trend status across various timeframes, aiding in comprehensive market analysis.

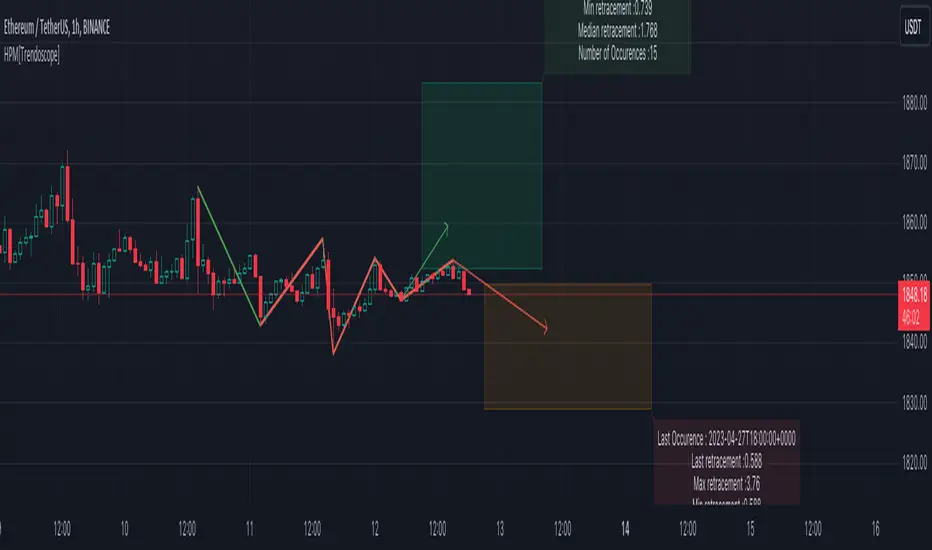
Historical Pattern Matcher [Trendoscope]Do you believe in patterns and think price movements are more likely to follow historical patterns? If yes, this is an indicator for you.
🎲 Concept
The patterns in this script are not a named or known pattern. But, it can be any pattern that happen to repeat again and again over a period of time.
The indicator collects the following information over a period of time.
Collects all possible patterns for specified number of pivots based on relation between each pivot prices. (Default 6)
Keeps track of all the possible patterns for the given pivots and number of occurrences of such patterns over a period of time.
Collects the movement of next pivot (in terms of retracement ratio) after the pattern has formed for each occurrence.
Keeps track of the last occurrence of each pattern collected
And the indicator presents on chart following information
Current Pattern drawing based on last confirmed pivot.
Current Pattern drawing based on current unconfirmed pivot in the opposite direction.
Projection range based on historical retracement ratio for both patterns
Detailed info on last occurrence and overall occurrences.
Last occurrence of both confirmed and unconfirmed pivot patterns.
Please note that, if the patterns have not been repeated over a period, then it will not be shown on the screen. Hence, it is perfectly normal to not see any projection. This can happen when the current pattern has not been repeated any time before.
🎲 Details
When you load the indicator on the chart, you may see the following patterns and projections.
You may also notice, in the pattern details, information about the last occurrence of the pattern. If you scroll on your chart to the left to the given data and time, you can observe how the past occurrence of the pattern has formed and the price movement past that point.
For example, last occurrence of pattern based on confirmed pivot happened on 02-Jun-2023 00:00 UTC time
And last occurrence of pattern based on unconfirmed pivot happened on 27-Apr-2023 22:00 UTC time
🎲 Settings
Settings are minimal, and here is the meaning of them.
Most important setting here is the number of pivots forming the pattern.
🎲 Caution
The indicator is designed to present the projection based on historical occurrences of similar price pattern. This does not necessarily mean the patterns are supposed to be bullish or bearish. But, it will certainly give users an idea of what happened when similar price action presented historically.
Note to developers This script makes use of new pine script feature - maps
Recursive Micro Zigzag🎲 Overview
Zigzag is basic building block for any pattern recognition algorithm. This indicator is a research-oriented tool that combines the concepts of Micro Zigzag and Recursive Zigzag to facilitate a comprehensive analysis of price patterns. This indicator focuses on deriving zigzag on multiple levels in more efficient and enhanced manner in order to support enhanced pattern recognition.
The Recursive Micro Zigzag Indicator utilises the Micro Zigzag as the foundation and applies the Recursive Zigzag technique to derive higher-level zigzags. By integrating these techniques, this indicator enables researchers to analyse price patterns at multiple levels and gain a deeper understanding of market behaviour.
🎲 Concept:
Micro Zigzag Base : The indicator utilises the Micro Zigzag concept to capture detailed price movements within each candle. It allows for the visualisation of the sequential price action within the candle, aiding in pattern recognition at a micro level.
Basic implementation of micro zigzag can be found in this link - Micro-Zigzag
Recursive Zigzag Expansion : Building upon the Micro Zigzag base, the indicator applies the Recursive Zigzag concept to derive higher-level zigzags. Through recursive analysis of the Micro Zigzag's pivots, the indicator uncovers intricate patterns and trends that may not be evident in single-level zigzags.
Earlier implementations of recursive zigzag can be found here:
Recursive Zigzag
Recursive Zigzag - Trendoscope
And the libraries
rZigzag
ZigzagMethods
The major differences in this implementation are
Micro Zigzag Base - Earlier implementation made use of standard zigzag as base whereas this implementation uses Micro Zigzag as base
Not cap on Pivot depth - Earlier implementation was limited by the depth of level 0 zigzag. In this implementation, we are trying to build the recursive algorithm progressively so that there is no cap on the depth of level 0 zigzag. But, if we go for higher levels, there is chance of program timing out due to pine limitations.
These algorithms are useful in automatically spotting patterns on the chart including Harmonic Patterns, Chart Patterns, Elliot Waves and many more.

Auto Motive Wave [Trendoscope]Earlier we created an interactive script to study Motive Waves by manually selecting the wave patterns on the chart.
You can find the open source script here:
In this indicator, we will try to do it automatically. Hence, you don't need to draw the waves manually to check anymore. The indicator will do it for you.
🎲 Conditions for Motive Wave
Rules for Motive Waves remain same as before. Motive wave can be either Impulse or Diagonal Wave. Diagonal wave can be either expanding or contracting diagonals. To learn more about diagonal waves, please go through this idea.
🎲 Rules for generic motive waves are as below
Pivots in order - Checks wether the pivots selected are in progressive order.
Directions in order - Checks if the pivot directions are correct - either PH, PL, PH, PL, PH, PL or PL, PH, PL, PH, PL, PH
Wave 2 never moves beyond the start of wave 1 - Wave 2 retracement is less than 100% of wave1
Wave 3 always moves beyond the end of wave 1 - Wave 3 retracement is more than 100% of wave2
Wave 3 is never the shortest one - Checks if Wave 3 is bigger than either Wave 1 or wave 5 or both.
🎲 Now, these are the specific rules for Impulse Waves on top of Motive Wave conditions
Wave 4 never moves beyond the end of Wave 1 - meaning wave 1 and wave 4 never overlap on price scale.
Wave 1, 3, 5 are all not extended. We check for retracement ratios of more than 200% to be considered as extended wave.
🎲 Below are the conditions for Diagonal Waves on top of Motive Wave conditions
Wave4 never moves beyond the start of Wave 3 - Wave 4 retracement is less than 100%
Wave 4 always ends within the price territory of Wave 1 - Unlike impulse wave, wave 4 intersects with wave 1 in case of diagonal waves. This is the major difference between impulse and diagonal wave.
Waves are progressively expanding or contracting - Wave1 > Wave3 > Wave5 and Wave2 > Wave4 to be contracting diagonal. Wave1 < Wave3 < Wave5 and Wave2 < Wave4 to be expanding diagonal wave.
Settings are for the indicator include option to select zigzag length, theme color, and few constraints about the waves to be scanned. You can use the tooltips to find more about them
