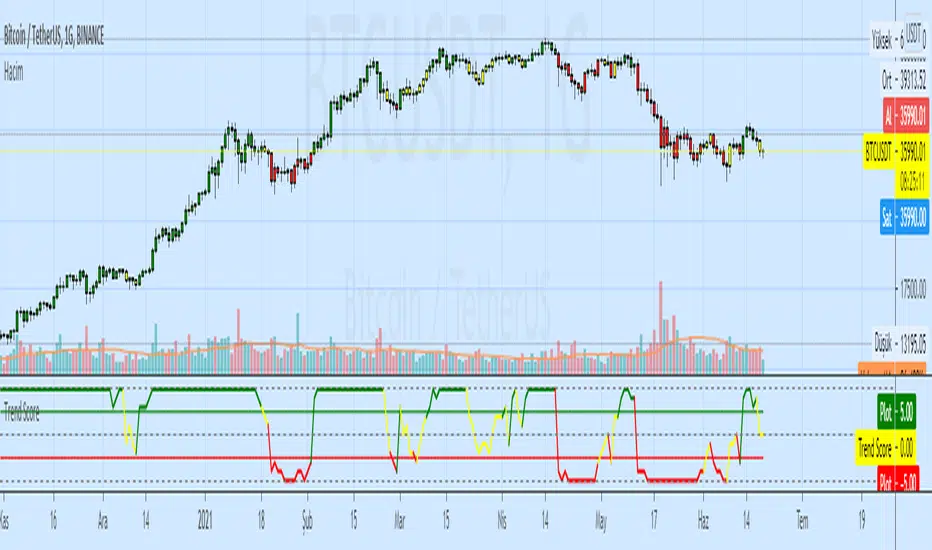
Trend Trader Strategy with MACDThis is plots the indicator developed by Andrew Abraham in the Trading the Trend article of TASC September 1998
The strategy I use has already been published explicitly by HPotter, you can review the core code from there.
I have converted the existing strategy codes that have been published into the strategy and the result looks great but I noticed that the indicator performed too much in short periods like 1 minute and I thought it would be healthier to get MACD approval. MACD approval will come selected by default. When the indicator reaches the buy status, if the macd histogram is positive, it enters the long process. By removing this confirmation from the settings window, you can see the normal signal frequency of the indicator.
This strategy is mainly based on trend signals. In fact, I am publishing this strategy to use in alternating trading for Bear-Bull crypto coins.
What does the bear-bull comparison mean?
You can open the same chart in the ETHBEAR / USDT symbol as opposed to the ETHBULL / USDT symbol that appears on the chart. When BUY signal comes in bull symbol, SELL will come in bear symbol. When BUY signal comes in bear symbol, SELL will come in bull symbol. In this way, very fast and very high profit can be obtained by alternating operation.
Cerca negli script per "trend"

Trend StrategyThis is plots the indicator developed by Andrew Abraham in the Trading the Trend article of TASC September 1998
The strategy I use has already been published explicitly by HPotter, you can review the core code from there.
I have converted the existing strategy codes that have been published into the strategy and the result looks great.
This strategy is mainly based on trend signals. In fact, I am publishing this strategy to use in alternating trading for Bear-Bull crypto coins.
What does the bear-bull comparison mean?
You can open the same chart in the ETHBEAR / USDT symbol as opposed to the ETHBULL / USDT symbol that appears on the chart. When BUY signal comes in bull symbol, SELL will come in bear symbol. When BUY signal comes in bear symbol, SELL will come in bull symbol. In this way, very fast and very high profit can be obtained by alternating operation.

Trend strenght by GrumlopThis indicator helps u to determine the strength and possible reversal of a trend. I prefer to use this indicator together with a mwvap indicator and standalone for possible divergence.

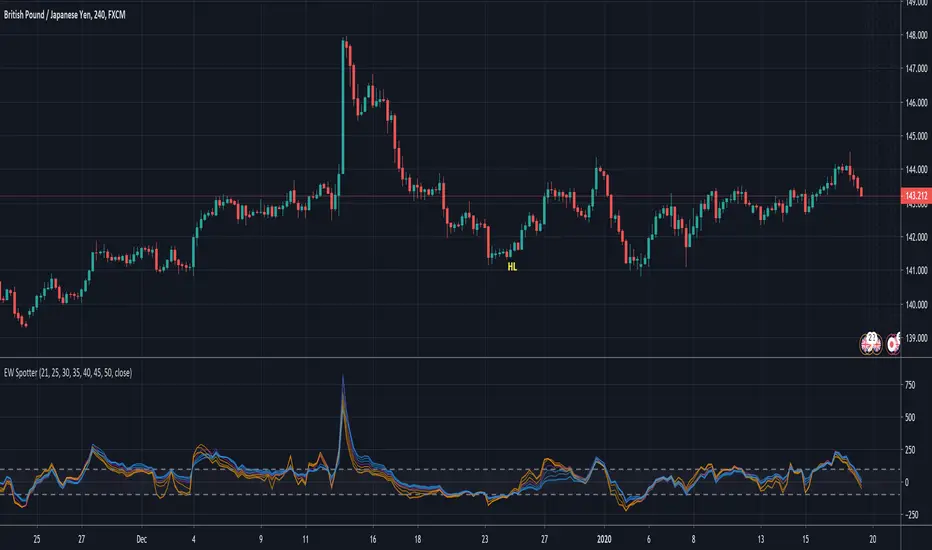
Trend EW SpotterThe Trend EW Spotter is a momentum based indicator that is used in a Guppy style analysis to identify the repeating patters seen in the indicator to help identify specific waves of Elliot Wave analysis.
The indicator is used with over bought and oversold areas as well.
Patterns repeat and can be used to identify waves 1, 2, 3, 4, & 5 of impulsive price action.
It is also noteworthy to identify period of low volatility indicating the potential of new price action that may begin soon.
I hope you enjoy it!
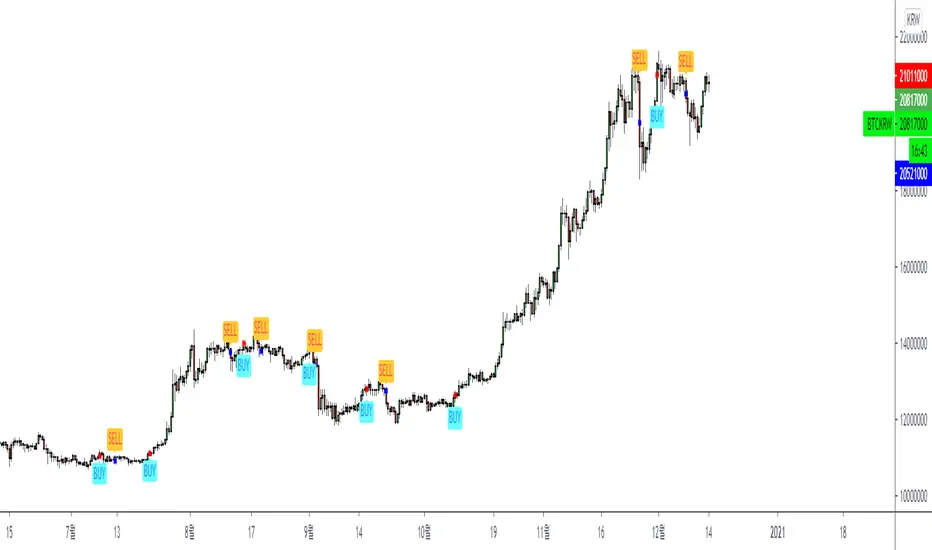
Trend former ver 1.0New trend following indicator.
Like basel major swing, signal output is possible in the middle of the rod without repainting.
Therefore, you can set the buy and sell ratio to 1: 1 to measure the seed change graph of the relevant trade.
This indicator is based on trend tracking optimized for the coin market.
The signal is neatly generated overall and helps a lot to sell on the shoulder.
새로운 추세추종 지표 Trend former 입니다.
Basel major swing과 같이 리페인팅 없이 봉 중간에 시그널 출력이 가능합니다.
때문에 매수와 매도를 1:1로 설정하여 해당 매매시의 시드변화 그래프를 측정 할 수 있습니다.
코인 시장에 최적화한 추세추종을 기반으로 한 지표입니다.
시그널이 전체적으로 깔끔하게 발생하고 어깨시의 매도에 많은 도움을 줍니다.
Blue line is Basel total balance, Red line is Hodl total balance
result based on Commission 0.1% Slippage 0.1%
파란선이 바셀시드 빨간선이 존버 ( 슬리피지0.1%, 수수료 0.1% 적용 )
Blue line is Basel total balance, Red line is Hodl total balance
result based on Commission 0.1% Slippage 0.1%
파란선이 바셀시드 빨간선이 존버 ( 슬리피지0.1%, 수수료 0.1% 적용 )
Blue line is Basel total balance, Red line is Hodl total balance
result based on Commission 0.1% Slippage 0.1%
파란선이 바셀시드 빨간선이 존버 ( 슬리피지0.1%, 수수료 0.1% 적용 )
Blue line is Basel total balance, Red line is Hodl total balance
result based on Commission 0.1% Slippage 0.1%
파란선이 바셀시드 빨간선이 존버 ( 슬리피지0.1%, 수수료 0.1% 적용 )

Trend Detector ScreenerTrend detector checks trend direction on low, current and high timeframes
Used together with Entry Point Indicator

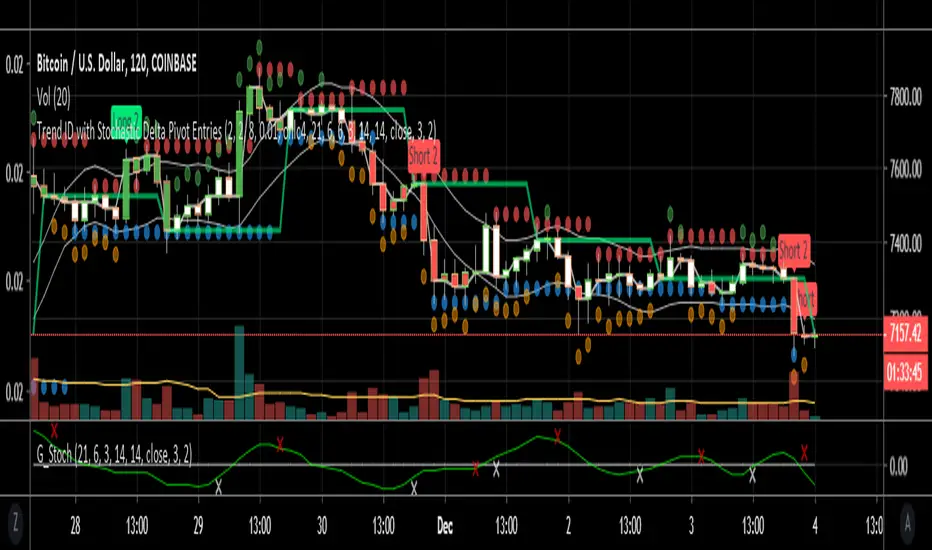
Trend ID with early entry signalsThis script is a combination of two. Firstly a trend is identified as up down or sideways. Higher highs and higher lows makes for an uptrend, lower highs and lower lows similarly allows for a downtrend to be registered. Users can adjust the number of bars to include for detection of the pivot points to increase the accuracy of trend changes but this significantly reduces signals. Sideways movement is determined if the average candle price is within a variance of a short SMA. The SMA follows the close of each candle going back 6 candles by default. The variance is 1% by default so if the price is within 1% of the SMA it's considered sideways and no entries can be issued in this condition.
The indicator is designed to identify the trend for longing or shorting, and then provides the entries based on stochastics converging or diverging (not crosses). The convergence and divergence of stochastics is amalgamated into a short EMA which also has length 6 and can be tuned by the user.
The default values of this script best work on 1h and 2h timeframes for specific pairs like BTCUSD. For other time frames and pairs the settings will need to be tweaked but is possible to identify specific parameters for many different pairs and time frames.
I've written several scripts for personal use however this is my first published script so please use at your own risk! It's not perfect!
Trend MeterUse as a supplementary Indicator to confirm your entries, but it is as good on it's own.
When you first apply the indicator to your chart make sure you shrink it down It looks a lot better that way
The indicator consists of 3 different Trend Meters and a Trend Bar which are used to confirm trend
As a bonus Possible Momentum Setup entries based on Stochastics are marked as well, these are very Powerful however please use with caution
How to Use
The more Trend meters are lit up the better
Look for Support or Resistance Levels for price to be attracted to
Find confluence with other indicators
Enter Long above the Setup Bar
Enter Short Below the Setup Bar

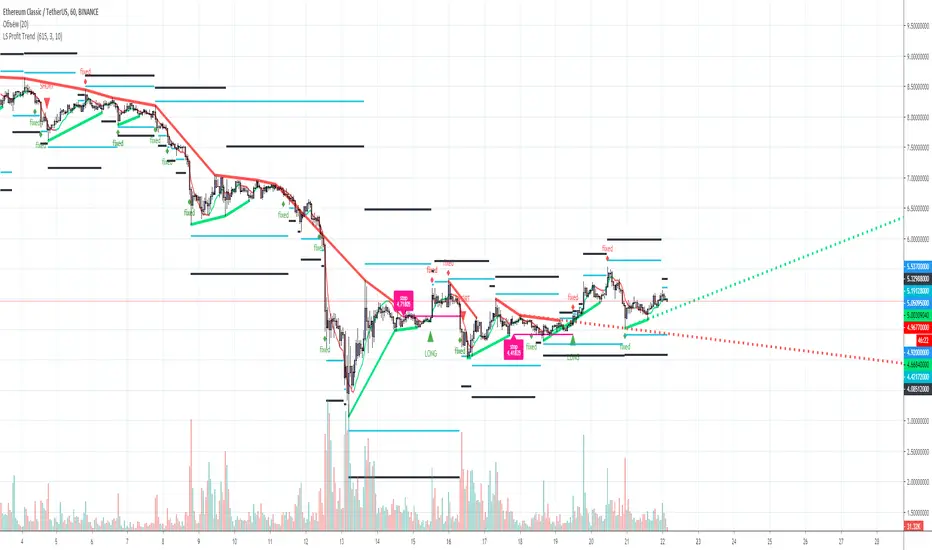
L&S PROFIT TREND Trend indicator for TF from 1 hour and above, for any trading pair, any exchange, binary options. Signals+ Take profit levels. 90% good signal and take profit 1.
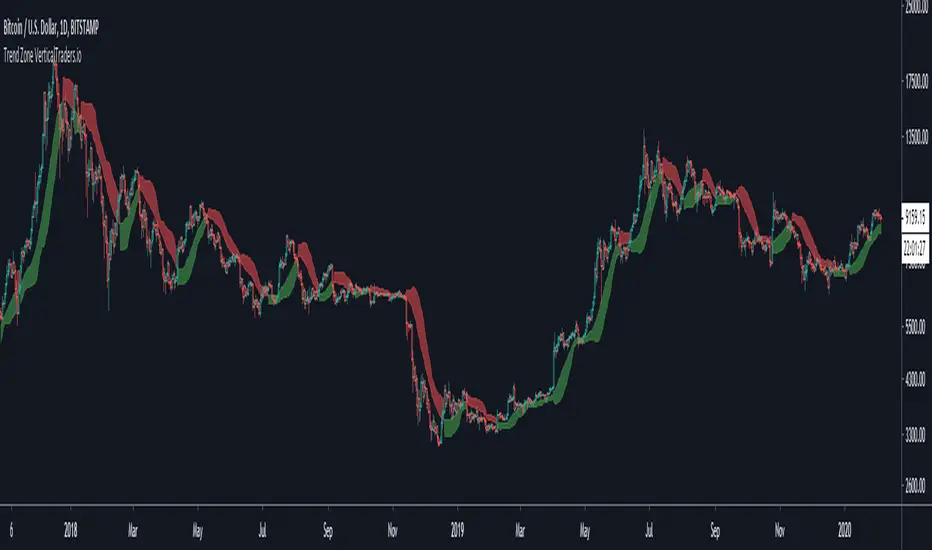
Trend ZoneTrend Zone
- Shows the risk areas to continue in a trend
- Trend Indicator for Long and Short entries
- It can be used as a trend indicator or as a trailing stop loss
- Long and Short Labels and Alerts
- Configurable in Periods and the type of MA for the calculation
Trend ProTrend Pro
- Trend Indicator for Long and Short entries
- It can be used as a trend indicator or as a trailing stop loss
- Long and Short Labels and Alerts
- Configurable in volatility values and periods

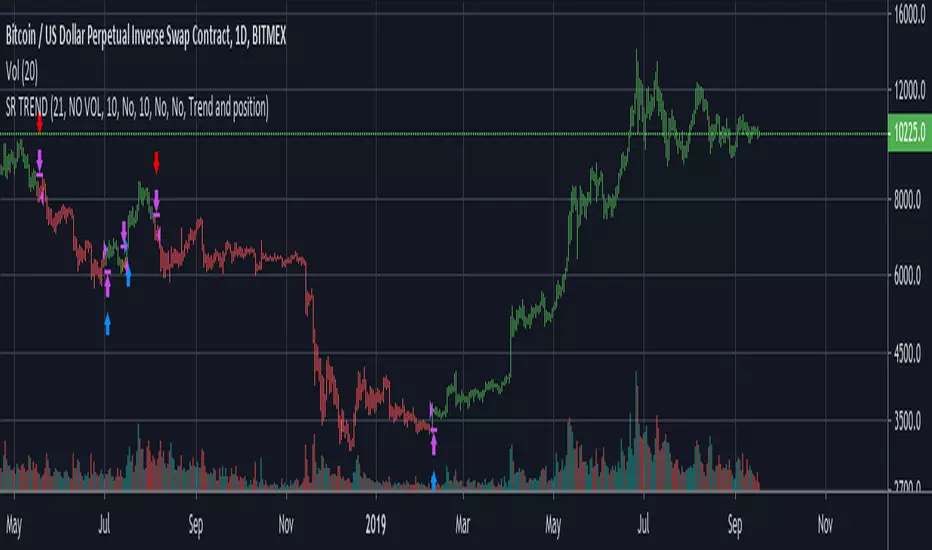
Trend SR based strategyIt is a logical continuation of my Trend SR based indicator
Algo of strategy is next
1)Detect SR levels
2)Calculate separate channels for SR made by highs and lows
3)it takes position if the current SR is breaking and close price is not in opposite channel zone
4)It closes position if prise leave current channel zone or as an option (stoploss) if SR is breaking in an opposite direction
-uses //@version=4
-no volume needed for detecting SR breaking and entering a long position
-volume confirmation of SR breaking may be used in the option section
-volume has an option to use smoothing with MA: SMA, AHMA, VIDYA
-volume has option to use volume pump as confirmation of SR breaking (simple dev function)
-stoploss as option
-uses barstate.isconfirmed (returns true if the script is calculating the last (closing) update of the current bar) for entering position on current bar close
-as an option, all or only current SR levels detected by algo can be plotted
-option to plot SR as a channel - as FILTERED whole SR history, in a long or short position it plots only stoploss level and entering opposite position level, in no position it plots long and short entering levels
It works well on 1D
For using on 4h or lower timeframes - Volume confirmation with VIDYA or AHMA may give better results
For better work especially on LTF algo needs better detection of highs and lows, now it uses fractal filter of last bars

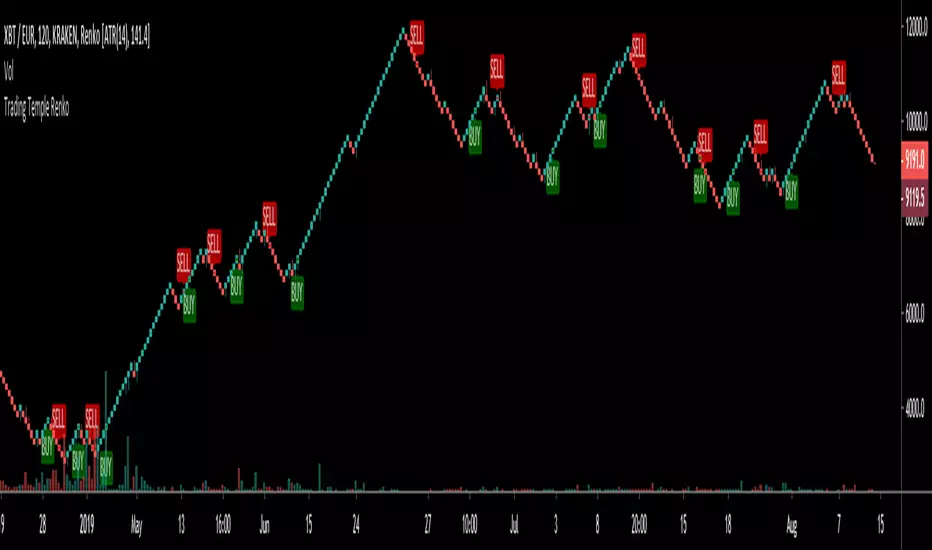
Trading Temple Trend Tracker Renko v1Trend Tracker to be used for trades following the current trend.
To be used with Renko bricks based on ATR and intraday charts (below 1D)
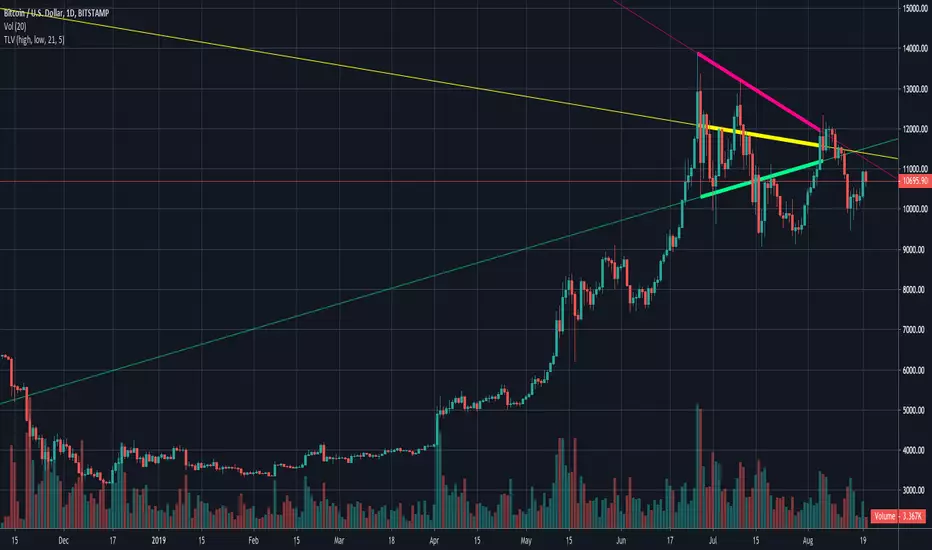
Trend Lines by VolumeA variant of the Trend Lines indicator; this one relies on volume highs and lows to dictate the trend.

trend analysisdaily trade call on the basis of trend analysis
this is a beta version hence use at ur own risk

MultiTF Trend BiasTrend Bias based on 12 time frames.
Should be used on the lowest time frame (1 minute)