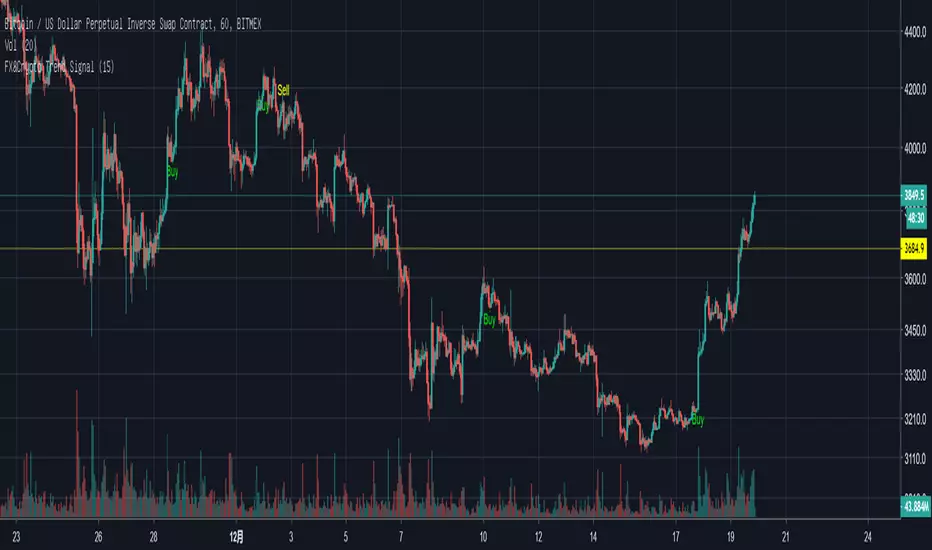
FX&Crypto Trend SignalThis script plot potential entry signals and dynamic stoploss on your chart.
No repainting.
Based on trend analysis.
Cerca negli script per "trend"
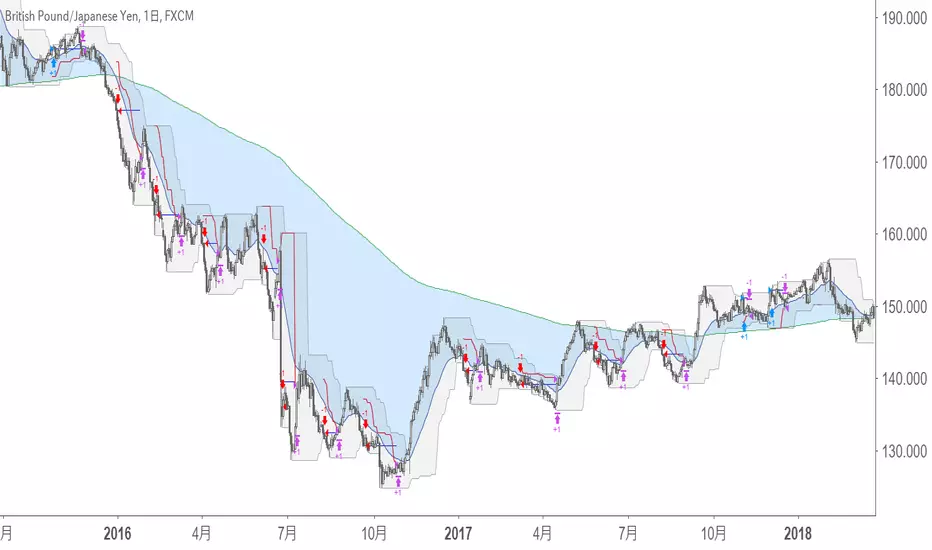
Strategy Turtle Time Exit Donchian TrendStrategy "Time Exit Donchian Trend"
Default Settings
Long Entry - EMA25 > EMA350 & Breakout highest20
Short Entry - EMA25 < EMA350 & Breakout lowest20
Exit - 80 days
Performance
* 25 symbols - fx(5) ,stock index(5) ,stock jp(5) ,stock usa(5) ,comodity(5)
* 12 years - 2005 - 2017
win -52.71%
risk reward ratio - 1.24
total trades - 848
ruin risk - 0%
edge / risk - 0.179
edge * trades - 152.12
Functions
Strategy
Pyramiding On/Off
Set Start and End

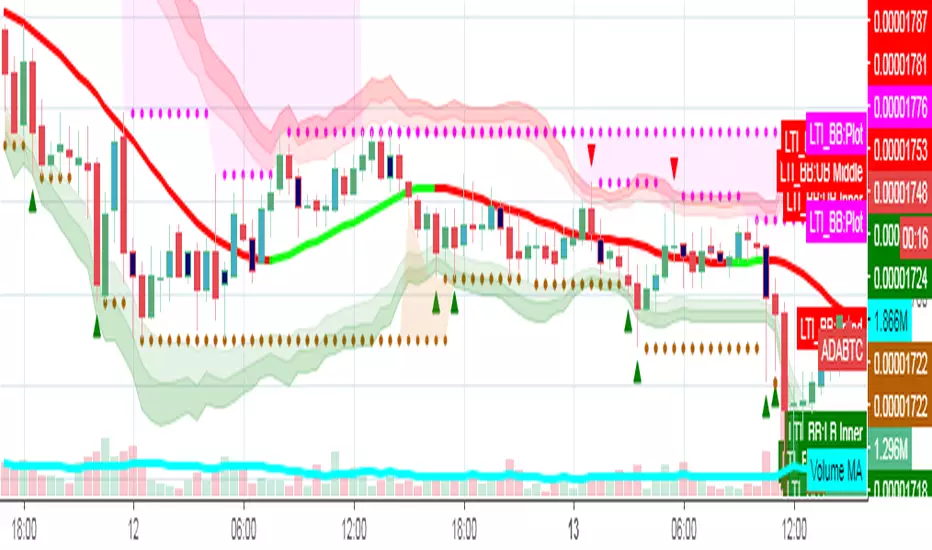
M-RSI Entry Signal + Trend Signalthis function is the mixture of Multi RSI which is produced by Mr.sixamon with MA used for some conditions.
based on three different types of RSI, entry signal(diamond shape plot) and trend signal(background color) are created. in addition to RSI, i apply MA and open/close price to decide visible/invisible above signal. this one is much better than previous signals, but still needed to upgrade for higher accuracy.
THANKS!

Multi RSI Trend Signal product by sixamon v1.1due to language problem which is prohibited by house-rule, I upload this script again.
Mainly this idea is produced by Mr. Sixamo who is one of the most famous technical trader in japan.
I just applied his idea to trading view by "guessing" , so it is not completely the same with his idea rather than worse.
Anyway i hope this will be helpful for some of the uses which seek to find out some trend by using RSI based on three different legs!

Strategy Turtle Donchian Trend SystemStrategy "Donchian Trend System"
Default Settings
Long Entry - EMA25 > EMA350 & Breakout highest20
Long Exit - Breakout lowest10 or 2-ATR
Short Entry - EMA25 < EMA350 & Breakout lowest20
Short Exit - Breakout highest10 or 2-ATR
Performance
* 25 symbols - fx(5) ,stock index(5) ,stock jp(5) ,stock usa(5) ,comodity(5)
* 12 years - 2005 - 2017
win -37.84%
risk reward ratio - 2.2
total trades - 2043
ruin risk - 0.01%
edge / risk - 0.21
edge * trades - 429.88
Functions
Strategy
Loss cut On/Off
Pyramiding On/Off
Timed Exit On/Off
Set Start and End
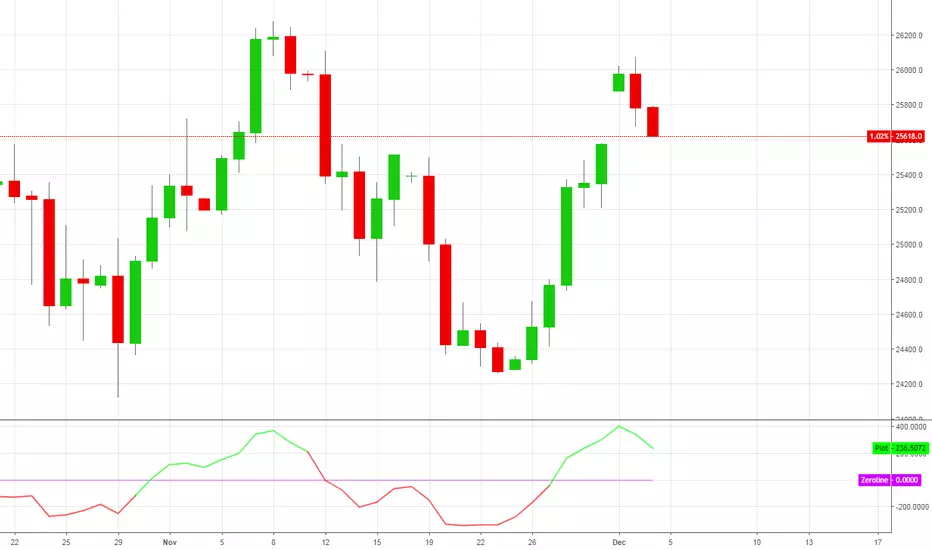
C07 Market TrendThis indicator can help you to identify if the market are in a up or down trend.
When the color changes, the trend is confirmed.
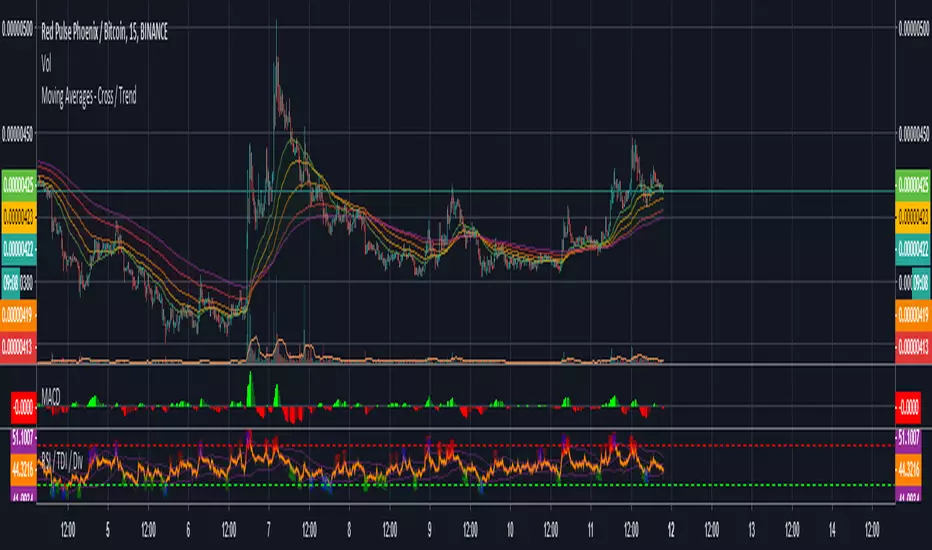
Moving Averages - Cross / Trend 5 x Moving Averages that will show you trend bias for a coin ( green bull / yellow undecides / red bearish )
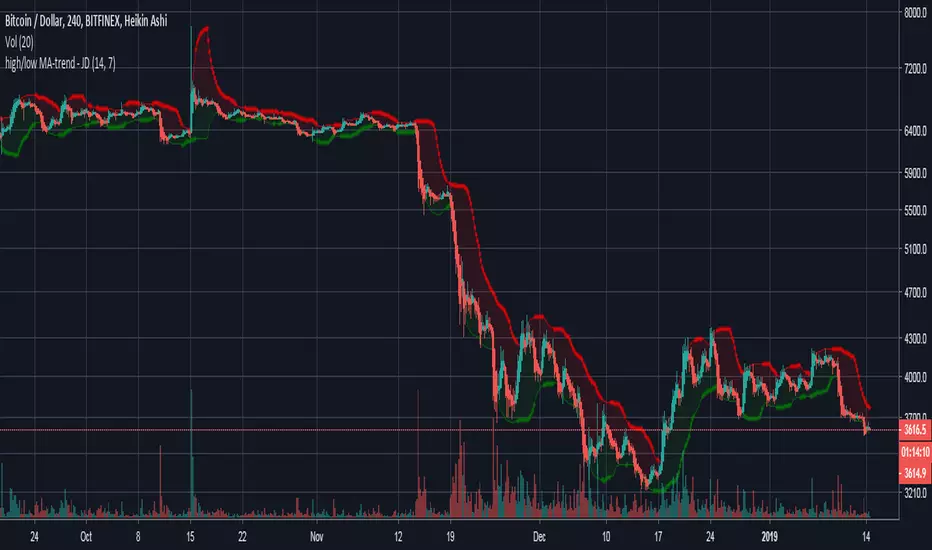
high/low MA-trend - JDShort script for trend indication taking a moving average of the highs and the lows seperately.
Lookback period for the highs/lows can be altered.
Ema length can be altered.
JD.


Automatic trend line integrated signal
Make a signal combining the evaluation value of the trend line automatically obtained and the moving average cross indicator.
Rising trend when the background is green, falling trend when in the red.

Ultimate 2Hr Trend DetectorJust apply it on your chat. Options to turn background trend colors on/off as well as the arrows

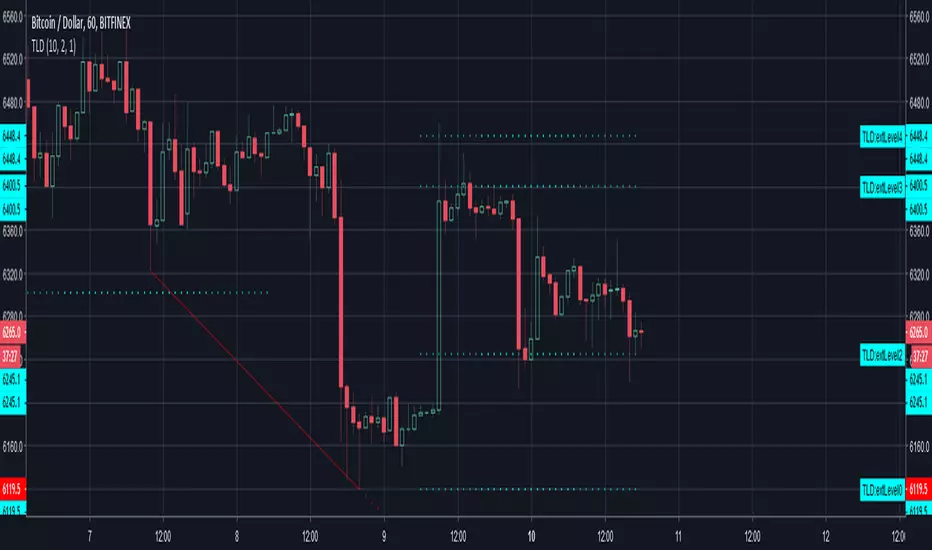
Auto Trendline, Downtrend Descending Trend line indicatorThis is a customized Tradingview indicator will automatically plots descending trend lines which formed by two adjacent swing lows. It will also draw 5 extended resistance and support levels after the trend line detected.
The concept is simple: the trend line is formed by two adjacent troughs when the price is in a downtrend . It will save a lot of time for people (like me) who uses trendline very often.
By deploying this indicator, should the condition meet, you don't need to draw the trend lines by hand anymore. It's also very easy to use, just load it on chart and set your desired inputs.
Features:
Strength, this parameter is used to define the minimum number of bars to the left and right side of the troughs (swing low point).
Set price difference between two troughs in two variables: amount or percentage.
Enable/disable the extended level lines.
By using different inputs, you can easily filter out some unwanted trend lines.
It's recommended to use small value for price difference input on intraday chart, and use relatively large value on Daily chart.
The choice of price difference value input also depends on the market you work on, you may want to use small value on Forex market and use large value on Stock market.
Market trend strength judgementThis technical indicator shows the real trend and average trend respectively.
Display real-time and hysteresis.
Currently in an internal beta

Letest Trend Indicator with Bollinger Band]New Trend line, Bollinger Band, Support & Resistance, Pivot Blue Breakout EMA


Heikin Ashi Trend CountsThis is a simple indicator that overlays HA candles over the regular Japanese candles and plots the number of bars each red/green trend lasted before being interrupted by a color flip, capped at 9, above the bar at the end of each trend.


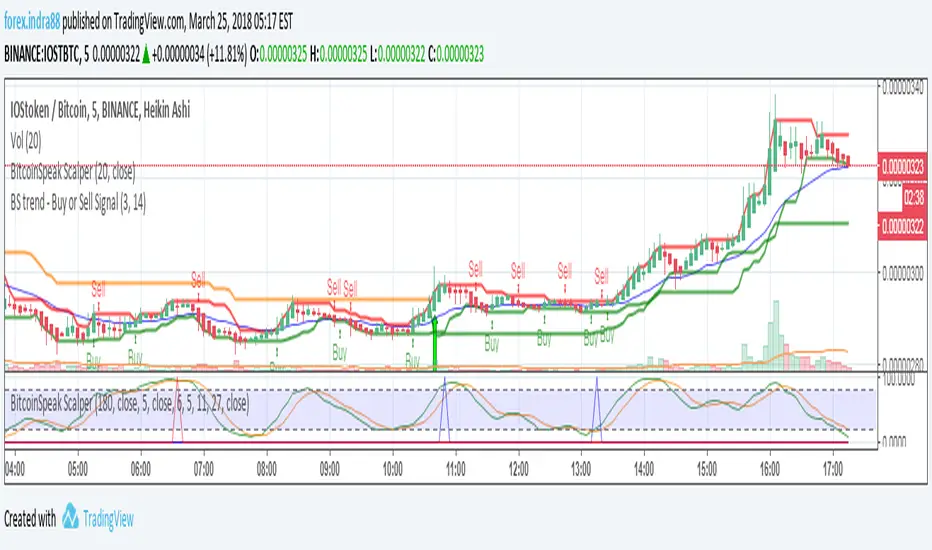
BitcoinSpeak trend v1.0 - Buy/SellIndikator Trend untuk signal jual/beli, Indikator ini untuk TF berapapun, karna ini adalah indikator Trend, recomended gunakan TF 5m - 30m, cocok untuk trade harian.
Noro's Trend SMA Strategy v1.3Trade strategy which uses only 2 SMA .
The slow SMA (blue) is used for definition of a trend
The fast SMA (red) is used for an entrance to the transaction
Recomended:
For H1
For crypto/fiat
Fast SMA Period = 5
Slow SMA Period = 20
In the new version 1.3
- priceChannel
In the new version 1.2
- profit became more
- the risk became less
- strategy waits for 2 candles of lonely color
