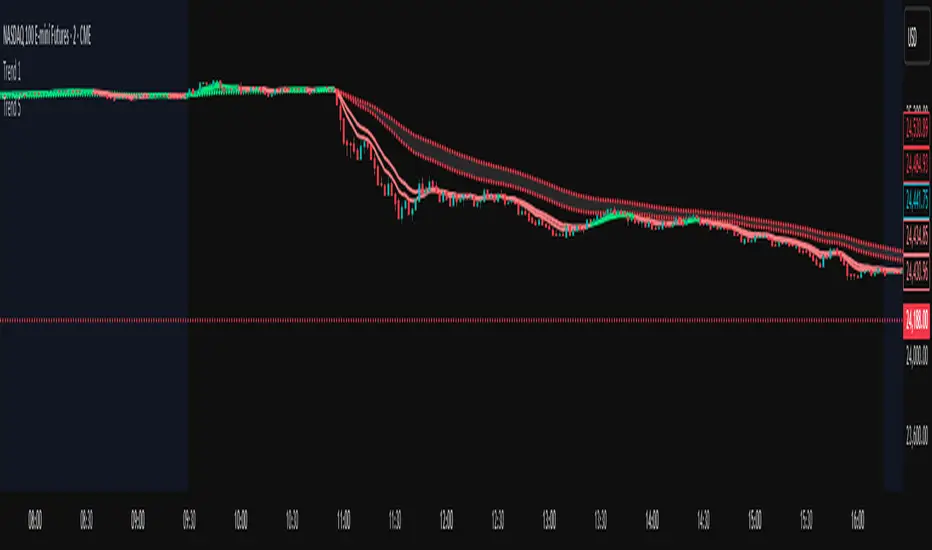
Trend 1EMA Trend tracker.
This script plots two EMAs: a short-term EMA (line) and a long-term EMA (dots). The line color turns green when the short EMA is above the long EMA, and red when it’s below. Users can select a custom timeframe for the EMA calculation using the input settings. A shaded area is drawn between the two EMAs to visually represent the trend zone.
Cerca negli script per "trend"
Trend 5EMA trend tracker.
This script plots two EMAs: a short-term EMA (line) and a long-term EMA (dots). The line color turns green when the short EMA is above the long EMA, and red when it’s below. Users can select a custom timeframe for the EMA calculation using the input settings. A shaded area is drawn between the two EMAs to visually represent the trend zone.

Trend Compass (Manual)## Trend Compass (Manual) - A Discretionary Trader's Dashboard
### Summary
Trend Compass is a simple yet powerful dashboard designed for discretionary traders who want a constant, visual reminder of their market analysis directly on their chart. Instead of relying on automated indicators, this tool gives you **full manual control** to define the market state across different timeframes or conditions.
It helps you stay aligned with your higher-level analysis (e.g., HTF bias, current market structure) and avoid making impulsive decisions that go against your plan.
### Key Features
- **Fully Manual Control:** You decide the trend. No lagging indicators, no confusing signals. Just your own analysis, displayed clearly.
- **Multiple Market States:** Define each row as an `Uptrend`, `Downtrend`, `Pullback`, or `Neutral` market.
- **Customizable Rows:** Display up to 8 rows. You can label each one however you like (e.g., "D1", "H4", "Market Structure", "Liquidity Bias").
- **Flexible Panel:** Change all colors, text sizes, and place the panel in any of the 9 positions on your chart.
- **Clean & Minimalist:** Designed to provide essential information at a glance without cluttering your chart.
### How to Use
1. **Add to Chart:** Add the indicator to your chart.
2. **Open Settings:** Go into the indicator settings.
3. **Configure Rows:**
- In the "Rows (Manual Control)" section, set the "Number of rows" you want to display.
- For each row, give it a custom **Label** (e.g., "m15").
- Select its current state from the dropdown menu (`Uptrend`, `Downtrend`, etc.).
- To remove a row, simply set its state to `Hidden`.
4. **Customize Style:**
- In the "Panel & Visual Style" section, adjust colors, text sizes, and the panel's position to match your chart's theme.
This tool is perfect for price action traders, ICT/SMC traders, or anyone who values a clean chart and a disciplined approach to their analysis.

Trend Following S/R Fibonacci StrategyTrend Following S/R Fibonacci Strategy
Trend Following S/R Fibonacci Strategy

Trend Following S/R Fibonacci StrategyTrend Following S/R Fibonacci Strategy
Trend Following S/R Fibonacci Strategy

Trend MagicTrend Magic is an indicator identity Multi time frame Trend. Ideal time frame 5 Min
Long Entry :
Long term Line is Green and price goes above blue line taka a long position
Short Entry :
Long term Line is Red and price goes below both red line take a short position

Trend Catcher BotTrend analysis strategy with entry filters such as MACD and Tilson T3. It will look at possible entry points and it can use MACD or TilsonT3 filters to decide whether or not enter in a new trade.
Notes:
- Results include a 0.075% Fee.
- Simulated leverage of 5x.
- Initial Capital of $1000.
- Uses a max order size of $200k per trade (Leverage included).
- Stop loss of 1.15%.
- The stop loss is moved to 0.4% Profit once the Trade reaches 1.15% profit.
- All settings adjustable.
- Non Repainting.

Trend MVery simple script where all you need is to put the time frame you are, just put min number
for example 5 min = 5 at Min
1 hour =60
4 hour =240 etc
green are bullish trend
red is bearish
the trend is based on weekly combination of High and Low with no security MTF ,at this way I attempt to put the possible weekly support and resistance to a much lower TF
so it just idea . let me know what you think:)

Trend StepTrend Follow Indicator
HTF "Auto" setting is:
< 4Hour : "240"
>= 4Hour and Intraday : "D"
D: Weekly
W: Monthly
M: Yearly
Trend former ver stockTrend Former's stock version service indicator.
It is designed to be printed on daily and three-day bars.
Market characteristics require longer breathing than coin in position.
For further details, we will gradually increase the upload.
트랜드 포머의 주식버전 서비스 지표입니다.
일봉과 3일봉에서 출력되도록 설계 되어 있습니다.
마켓 특성상 포지션에서 코인보다는 더 긴 호흡을 요구합니다.
추가적인 자세한 설명은 점차 업로드를 늘려가도록 하겠습니다.


Trend Strength Indicator, Wyckoff Trend Tracking Trading SystemTrend Strength Indicator by Wyckoff Trend Tracking Trading System

Trend Score by KIVANÇ fr3762Trend Score compares close prices between last close with previous closes by a certain period of time.
It's like momentum but gives a score +1 when close price is equal to or above (defaultly) 10 bars ago and gives a score of -1 when below.
calculation continues from default length to the 2 times of length.
Defaultly (for 10 bars length)
If Trend Score converges to 10; that means there's a strong uptrend
conversely if Trend Score converges to -10; that means a strong downtrend market is on.


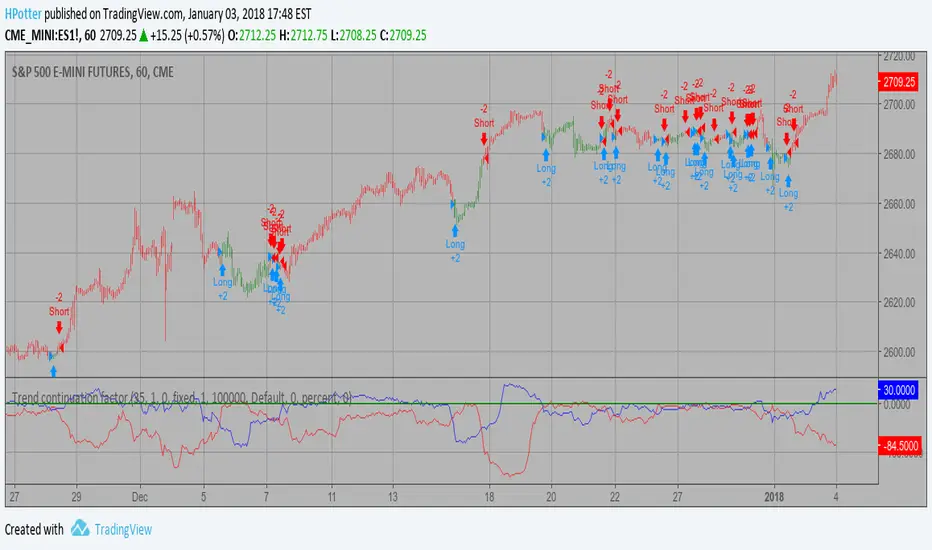
Trend continuation factor Backtest Trend continuation factor, by M.H. Pee
The related article is copyrighted material from Stocks & Commodities.
You can change long to short in the Input Settings
WARNING:
- For purpose educate only
- This script to change bars colors.
Trend continuation factor Strategy Trend continuation factor, by M.H. Pee
The related article is copyrighted material from Stocks & Commodities.
WARNING:
- This script to change bars colors.


Trend continuation factor, by M.H. PeeTrend continuation factor, by M.H. Pee
The related article is copyrighted material from Stocks & Commodities.

TrendlinesDowntrend lines are one of the most important tools in technical analysis. A downtrend line is created by connecting a series of lower highs which forms a clear visual line where price repeatedly finds resistance. Traders use these lines to understand trend direction, time entries, plan exits, and quickly recognize when momentum is shifting.
This indicator automatically finds and maintains the strongest downtrend lines on any timeframe. It removes the guesswork and inconsistency that comes with manually drawing trendlines.
Unlike most other trendline indicators that just draw lines from swing highs to the current high, this indicator actively scans for new pivot highs, tests each potential line against live price action and only promotes a line to valid status once it has proven itself as a true trendline by price touching or respecting the line a user defined number of times, with the default set to three. This filters out noise and leaves only the most meaningful and reliable trendlines on your chart.
When price eventually breaks a respected downtrend line the indicator highlights the breakout immediately. Traders often use these moments for entries confirmation signals or to prepare for a potential shift in market behavior. The breakout alert is built directly into the indicator so you never miss an important move.
This indicator also works with the Pine Screener to find tickers with current valid trendlines.
How are trendlines determined?
The indicator begins by anchoring to the most recent pivot high. From there it draws a temporary line to the current bar and evaluates every bar between the two points.
Each time a high comes within a user selected buffer zone around that line it is counted as a touch. Once the required number of touches is confirmed and price has never exceeded the buffer to the upside the trendline becomes valid and is displayed on the chart as an active downtrend line.

Trend Quality IndicatorDescription
This indicator is my interpretation in Pinescript of the "Trend-Quality Indicator" by David Sepiashvili.
The Trend Quality indicator (Q-indicator) is an attempt to estimate trend in relation to noise. It answers the long-standing question of whether a trend change qualifies as significant and promising, or insignificant and better ignored. In terms of noise, trend estimation not only determines whether the trend is reliable, but also allows you to measure its strength gradually. Thus, regardless of their prices, trends of various securities can easily be compared to each other or against any index.
The Trend Quality indicator (or Q-indicator) is a trend detection and estimation tool that is based on a two-step filtering technique. It measures cumulative price changes over term-oriented semi-cycles and relates them to “noise.” The approach reveals congestion and trending periods of the price movement and focuses on the most important trends, evaluating their strength in the process. The indicator is presented in a centered oscillator and banded oscillator format.
Calculation and Logic
To estimate the price dynamics, the cumulative price change (CPC) indicator is used, which measures the amount that the price has changed from a fixed starting point within a given semi-cycle. The CPC indicator is calculated as a cumulative sum of differences between the current and previous prices over the period from the fixed starting point t0. The trend within the given semi cycle can be found by calculating the moving average of the cumulative price change:
Trend = MA (CPC, m, t => t0)
Segmenting the price time series and constructing trends within the extracted semi-cycles offers the smallest average gap between actual and averaged data points. This results in a better fit of the real price dynamics.
Estimating Trend Performance
A basic criterion for estimating trend performance is the amount the trend changes over up or down semi-cycles. If there is little or no visible progress in the trend, it may be considered as nonefficient. Further, significant changes in trend may be considered as promising trading opportunities, but the term “significant” is relative and subject to interpretation.
The Q-indicator is calculated by dividing trend by noise with an appropriate correction factor.
The denominator of the Q-indicator — noise — can be defined as the average deviation of the cumulative price change from the trend. To determine linear noise, first we calculate
the absolute value of the difference between CPC and trend, and then smooth it over the n-point period:
Noise1 = MA(I CPC Trend I,n)
High positive values suggest strong uptrend, low negative values signify strong downtrend, and values fluctuating around the zero level indicate that trend and noise are in equilibrium, i.e., non-trending conditions might be present.
The root mean square noise, similar to the conventional standard deviation, can be derived by summing the squares of the difference between CPC and trend over each of the preceding n-point periods, dividing the sum by n, and calculating the square root of the result.
The Q-indicator is intended to measure trend activity. Some benchmarks can be used to determine the strength of a trend. In the range of Q-indicator values from -1 to +1, the trend is buried beneath noise. It is preferable to stay out of this zone. The greater the Q, the less the risk of trading exceeds this level (absolute value of Q>2), it can be qualified as promising.
Readings in the range from +2 to +5, or from -2 to -5, can indicate moderate trending, and readings above Q=+5 or below Q=-5 indicate strong trending. Strong upward trending often leads to the security’s overvaluing, and strong downward trending often results in the security’s undervaluing. Readings exceeding strong trending benchmarks can indicate overbought or oversold conditions and signal that price action should be monitored closely.
Input Parameters’ Description
Fast Length - the number of bars used in calculation of fast SMA of Trending Periods.
Slow Length - the number of bars used in calculation of slow SMA of Trending Periods.
Trend Length - the number of bars upon which the trend is defined.
Noise Type - defines mechanism of defining noise: linear or root mean square.
Noise Length - the number of bars upon which noise is determined.
Correction Factor - multiplier used in noise calculation.
Threshold Value - In the range of Q-indicator values from -1 to +1, the trend is buried beneath noise. It is preferable to stay out of this zone. The greater the threshold Value of Q-Indicator, the less the risk of trading exceeds this level, it can be qualified as promising. Readings in the range from +2 to +5, or from -2 to -5, can indicate moderate trending, and readings above Q=+5 or below Q=-5 indicate strong trending.
Plots
• Green = buying pressure
• Red = selling pressure
• Yellow = sideways
• ZeroLine = the zero level
In the provided script, multi-timeframe analysis is achieved using the request.security function, which retrieves data from a different timeframe than the one on which the script is running.
Explanation of Multi-Timeframe Logic in Multi-Timeframe selection
• This option retrieves the Trend Quality (TQ) from a higher timeframe if the current chart is intraday.
• The higher timeframe is specified in minutes by the user and converted to a Pine Script timeframe string.
• If the current chart is not intraday or no higher timeframe is specified, the TQ is taken from the current timeframe
Summary:
• Trend Quality Indicator measures established TREND,
• can be used on different timeframes,
• works well on different timeframes,
• the threshold of 2 to 5 should be appropriate for most instruments. It can be modified in chart settings to adapt to your strategy.
The Trend Quality Indicator doesn't predict the future. It is intended to help traders assess the strength of the current trend, giving them a better understanding of the market conditions to make more informed trading choices.
Further Reading
1. "Trend-Quality Indicator" by David Sepiashvili. Technical Analysis of Stocks & Commodities, April 2004.
