Trend GridTrend Grid is a responsive method to identify price movement and momentum. Mainly used to follow the trends.
This is for Level 3 members only.
Cerca negli script per "trend"

Trend BG v2Trend BG v2 colors the chart background based on Directional Movement (DM) and DI strength. It provides an easy visual way to identify trending and non-trending conditions on any timeframe.
How It Works
The script calculates:
Upward Directional Movement (DM+)
Downward Directional Movement (DM–)
True Range smoothed with RMA (14-period)
Positive DI and Negative DI values from classic ADX logic
The trend state is determined by comparing +DI vs –DI:
+DI > –DI → Uptrend
–DI > +DI → Downtrend
Otherwise → Neutral / Sideways
The script then applies a background color based on the detected trend.
Color transparency and theme can be adjusted using the input options.
Why This Script Is Useful
Instead of plotting DI lines or ADX curves, this version presents the trend directly on the background, making it ideal for:
Quick trend recognition
Visual filtering of choppy vs trending markets
Enhancing manual or automated setups
Intraday scalping, positional trend following, and multi-timeframe analysis
The background display is subtle, customizable, and does not interfere with other indicators on the chart.
Key Features
Trend-colored chart background (Up / Down / Neutral)
Adjustable color palette and transparency
Built using classic Directional Movement logic
Works on all markets and all timeframes
Lightweight and efficient (no repainting)
How to Use It
Apply the indicator on your chart and use the background colors to:
Align trades with the market trend
Avoid trading during neutral or low-momentum periods
Confirm trend direction before entries
Improve clarity when using your existing indicators
This indicator does not generate buy/sell signals by itself; instead, it helps visualize the underlying trend environment so traders can make more informed decisions.

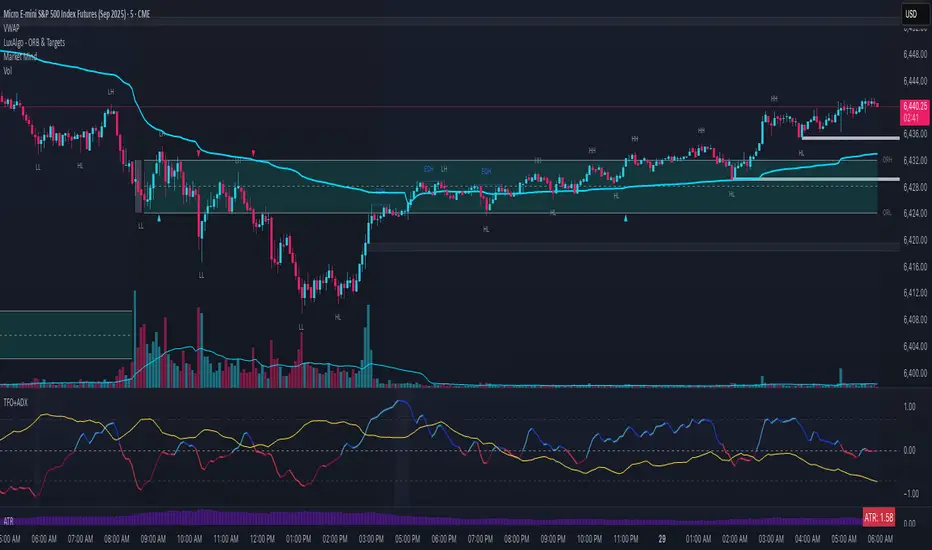
Trend Flow Oscillator (CMF + MFI) + ADX## Trend Flow Oscillator (TFO + ADX) Indicator Description
The Trend Flow Oscillator (TFO+ADX) combines two volume-based indicators, Money Flow Index (MFI) and Chaikin Money Flow (CMF), along with the Average Directional Index (ADX) into one comprehensive oscillator. This indicator provides traders with insights into momentum, volume flow, and trend strength, clearly indicating bullish or bearish market conditions.
### How the Indicator Works:
1. **Money Flow Index (MFI)**:
* Measures buying and selling pressure based on price and volume.
* Scaled from -1 to +1 (where positive values indicate buying pressure, negative values indicate selling pressure).
2. **Chaikin Money Flow (CMF)**:
* Evaluates money flow volume over a set period, reflecting institutional buying or selling.
* Also scaled from -1 to +1 (positive values suggest bullish accumulation, negative values bearish distribution).
3. **Average Directional Index (ADX)**:
* Measures trend strength, indicating whether a market is trending or ranging.
* Scaled from -1 to +1, with values above 0 suggesting strong trends, and values near or below 0 indicating weak trends or sideways markets.
* Specifically, an ADX value of 0 means neutral trend strength; positive values indicate a strong trend.
### Indicator Levels and Interpretation:
* **Zero Line (0)**: Indicates neutral conditions. When the oscillator crosses above zero, it signals increasing bullish momentum; crossing below zero indicates bearish momentum.
* **Extreme Zones (+/- 0.75)**:
* Oscillator values above +0.75 are considered overbought or highly bullish.
* Oscillator values below -0.75 are considered oversold or highly bearish.
* The indicator features subtle background shading to visually highlight these extreme momentum areas for quick identification.
* Shading when values above or below the +/-1.0 level.
* **Color Coding**:
* Bright blue indicates strengthening bullish momentum.
* Dark blue signals weakening bullish momentum.
* Bright red indicates strengthening bearish momentum.
* Dark maroon signals weakening bearish momentum.
Trend Following IndicatorTrend Following Indicator is for following trend and being in trend till trend is not changed.
Each Bullish and Bearish signal you can add one more future or option lot and be in trade till bearish signal is not coming.
You can close Long trade i.e. Bullish pyramiding trade when you see there is small red arrows are there
and similarly when you are in Short trade you can pyramid with each Bearish signal and you can close the trade when small green arrow start coming.
Pros: This signal system is working in stocks and Index and Commodity and Currency.
Cons: Choppy market results are not good on that time you have to believe on small arrows for signals.
This signal is available on subscription. contact me or ping me for more details.

Decred TrendSignals 1.0For advanced traders :
We have 3 fractals trends.
This Indicator filter trend for Decred.
With this indicator it is possible to read the trend of the graphical time and your fractal trend,
Best results = 15 min charts
I use Decred trendSignals for Scalping Trading ( at least 2% profit), Stop Loss under 6% (prefer 2% or = profit).
I prefer buy after Yellow candle print.

TrendMaster Gold, v. 6.2xTrendMaster Gold
The ultimate refinement of last year’s TrendMaster system, TrendMaster Gold takes deep pattern recognition to a new level tracking over 20 indicators triggering seven decision gates to trade in a Renko-smoothed charting environment. Optimized for higher returns over a wider range of instruments (see returns below), you are invited to trial this market-mirroring engine. Subscribers receive full breakdown for fine-tuning results to their market favorites while avoiding bot traps. Reach out by message to get your free trial. We are always available for questions, comments, and suggestions. There’s always room for improvement.
Results Chart
The backtests below show 1-year returns against a Buy and Hold (B+H) approach for 40 of the world’s top traded instruments (as measured by price volume or similar indicator). The TrendMaster system was run on the top 10 instruments in each of four major markets: Equities, ETFs, Cryptocurrencies, and Forex. All tests were on a 30min chart, set to Renko “Traditional” blocks (because TradingView does not support realtime alerts from ATR-based charts). Block size was set proportionately to price to give the instrument positive results, but there was no “cherry-picking”. (In fact, changing time frames would have produced even better returns in some cases, but it seemed best to use a consistent measure.) Subscribers to the system receive a full, step-by-step breakdown on how to customize the parameters to get the best from their favorite markets.
(For each instrument, you see listed its Symbol (name), Profit % (annual return using TrendMaster Gold), Winning Trade % (being “right”), ProfitFactor (Ratio of money won to money lost), Max Draw Down % (point of worst % loss during the year), and B+H (how much the asset would have returned with no trades, via "buy-and-hold" )...)
TrendMaster Gold
Settings: 30 min, Traditional Renko box, over 1 year (June 1, 2018 - June 1, 2019)
EQUITIES
Symbol Profit % Trade % PF Max DrDn B + H
AMZN 2,212 62 6.6 3 7
AAPL 158 49 3.7 5 5
TSLA 8,263 57 5 6 -38
FB 179 47 3 8 -7
BABA 247 56 3.4 9 -23
BYND 348 67 17.9 6 140
MSFT 224 58 6.8 3 28
AMD 171 50 2.6 13 0
NFLX 2,132 55 5.2 11 -5
BA 560 54 4.9 3 97
ETFs
Symbol Profit % Trade % PF Max DrDn B + H
SPY 275 64 5.5 3 4
QQQ 865 62 6.1 3 5
EEM 278 60 5.3 2 0
IWM 783 61 6.1 2 -3
HYG 21 51 2.7 1 0.5
EWZ 798 58 5.6 5 26
LQD 12 54 2 1 6
EFA 121 61 4.5 2 -7
FXI 391 63 5.4 3 -15
XLF 200 58 3.4 5 -3
CRYPTOCURRENCIES
Symbol Profit % Trade % PF Max DrDn B + H
BTC/USD 3 million 55 4.7 8 -8
ETH/USD 2 million 52 4.9 21 -54
XRP/USD 6 million 52 4 13 -16.6
LTC/USD 222,000 54 3 13 13
BCH/USD 380,000 54 4.6 28 -5
EOS/USD 147,000 55 2.7 20 13
BNB/USDT 2 million 54 4.4 14 143
BSV/USD 334,000 65 18 5 -8
XLM/USD 34 million 51 2.8 12 34
ADA/USD 48,000 64 7 6 3
FOREX PAIRS
Symbol Profit % Trade % PF Max DrDn B + H
EUR/USD 13 41 1.3 5 -4
USD/JPY 3 37 1.1 4 -1
AUD/USD 24 43 1.4 4 10
USD/CAD 20 43 1.7 4 3
GBP/USD 36 46 1.8 2 -5
NZD/USD 21 47 1.6 2 -6
GBP/JPY 40 42 1.6 2 -6
EUR/JPY 18 54 3.2 2 -5
AUD/JPY 47 44 1.8 5 -10
EUR/GBP 17 46 1.7 4 0.1

Trend Volatility Index (TVI)Trend Volatility Index (TVI)
A robust nonparametric oscillator for structural trend volatility detection
⸻
What is this?
TVI is a volatility oscillator designed to measure the strength and emergence of price trends using nonparametric statistics.
It calculates a U-statistic based on the Gini mean difference across multiple simple moving averages.
This allows for objective, robust, and unbiased quantification of trend volatility in tick-scale values.
⸻
What can it do?
• Quantify trend strength as a continuous value aligned with tick price scale
• Detect trend breakouts and volatility expansions
• Identify range-bound market states
• Detect early signs of new trends with minimal lag
⸻
What can’t it do?
• Predict future price levels
• Predict trend direction before confirmation
⸻
How it works
TVI computes a nonparametric dispersion metric (Gini mean difference) from multiple SMAs of different lengths.
As this metric shares the same dimension as price ticks, it can be directly interpreted on the chart as a volatility gauge.
The output is plotted using candlestick-style charts to enhance visibility of change rate and trend behavior.
⸻
Disclaimer
TVI does not predict price. It is a structural indicator designed to support discretionary judgment.
Trading carries inherent risk, and this tool does not guarantee profitability. Use at your own discretion.
⸻
Innovation
This indicator introduces a novel approach to trend volatility by applying U-statistics over time series
to produce a nonparametric, unbiased, and robust estimate of structural volatility.
日本語要約
Trend Volatility Index (TVI) は、ノンパラメトリックなU統計量(Gini平均差)を使ってトレンドの強度を客観的に測定することを目的に開発されたボラティリティ・オシレーターです。
ティック単位で連続的に変化し、トレンドのブレイク・レンジ・初動の予兆を定量的に検出します。
未来の価格や方向は予測せず、現在の構造的ばらつきだけをロバストに評価します。

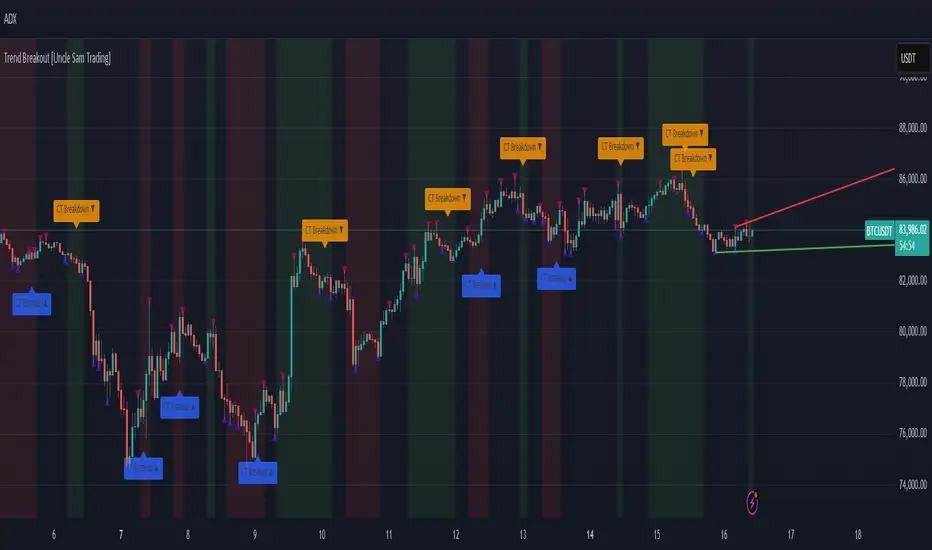
Trend Breakout [Uncle Sam Trading]Trend Breakout Indicator
Overview
The Trend Breakout Indicator is a powerful, non-repainting tool designed to help traders identify high-probability breakout and trend reversal setups on any market and timeframe. By leveraging pivot points, this indicator draws dynamic support and resistance channels, highlights counter-trend breakouts, and provides visual cues for market direction. It’s ideal for traders looking to simplify their analysis while targeting key price levels for entries and exits.
Key Features
Pivot-Based Channels: Draws a red upper channel (resistance) and a green lower channel (support) by connecting recent pivot highs and lows.
Counter-Trend Breakout Signals:
Blue “CT Breakup” signal (▲) when the price breaks above the upper channel during a downtrend, indicating a potential reversal or pullback.
Orange “CT Breakdown” signal (▼) when the price breaks below the lower channel during an uptrend, signaling a potential downmove.
Trend Visualization: Background color shifts to green for uptrends and red for downtrends, making it easy to gauge market direction.
Customizable Settings: Adjust pivot detection sensitivity with “Pivot Left Bars” (default: 5) and “Pivot Right Bars” (default: 1), and control channel extension with “Channel Extension Bars” (default: 50).
Optional Trend Signals: Enable “Show Trend Change Signals” to display trend shifts with green (uptrend) or red (downtrend) arrows.
Alert Conditions: Set alerts for counter-trend breakouts and trend changes directly on TradingView.
Example Performance (BTCUSDT, 1-Hour Chart)
On the BTCUSDT 1-hour chart:
A “CT Breakdown” signal appeared on April 6 at 8:00 AM at $82,700, followed by a drop to $74,400 within hours—a 10% move.
A “CT Breakup” signal occurred on April 9 at 1:00 AM at $76,600, leading to a rally to $86,600 in a few hours—a 9% gain.
These examples highlight the indicator’s ability to spot significant price movements, though results depend on market conditions, your trading style, and risk management.
Settings
Pivot Left Bars (default: 5): Number of bars to the left for pivot detection.
Pivot Right Bars (default: 1): Number of bars to the right for pivot confirmation (ensures non-repainting signals).
Channel Extension Bars (default: 50): How far the channels extend to the right.
Show Pivot Points (default: true): Displays small triangles at pivot highs (maroon) and lows (navy).
Show Counter-Trend Breakout Signals (default: true): Shows CT Breakup and CT Breakdown signals.
Show Trend Change Signals (default: false): Displays trend shift arrows when enabled.
How to Use
Add the indicator to your chart via TradingView’s indicator library.
Adjust the settings to match your trading style and timeframe.
Watch for “CT Breakup” and “CT Breakdown” signals to identify potential trade setups.
Use the background color (green/red) to confirm the current trend.
Set alerts for breakouts or trend changes to stay updated on key signals.
Always combine with proper risk management and your own analysis—past performance is not a guarantee of future results.
Notes
The indicator is non-repainting, meaning signals are confirmed and won’t disappear after they form.
Works on any market (crypto, forex, stocks) and timeframe, such as the BTCUSDT 1-hour chart shown.
Performance varies based on market volatility and your trading strategy.
This is a free tool created to support the TradingView community—feedback is welcome in the comments!
Disclaimer
Trading involves risk, and this indicator is not a guaranteed predictor of future price movements. Always conduct your own analysis and manage risk appropriately. The examples provided (e.g., BTCUSDT signals) are for educational purposes only and reflect past performance, which may not repeat.
Trend Heuristics (+Signals)Trend Heuristics - Enhanced Rolling VWAP with Smart Signals
This indicator is an enhanced version of the Rolling VWAP (RVWAP) concept, originally based on PineCoders' ConditionalAverages library. It combines volume-weighted average price analysis with advanced signal detection for both sweeps and breakouts.
Core Features
1. Rolling VWAP System
- Implements a dynamic rolling VWAP that adapts to different timeframes
- Includes standard deviation bands for volatility measurement
- Offers flexible time period settings (fixed or auto-adjusting)
- Provides customizable visual elements including bands and fills
2. Dual Signal System
Sweep Signals
Detects high-probability reversal points with these conditions:
- Bullish Sweep:
- Opens above upper band
- Tests below upper band (low)
- Closes above upper band
- Shows stronger lower wick
- Closes above previous high
- Has favorable close position (upper 50% of candle)
- Bearish Sweep:
- Opens below lower band
- Tests above lower band (high)
- Closes below lower band
- Shows stronger upper wick
- Closes below previous low
- Has favorable close position (lower 50% of candle)
Breakout Signals
Identifies potential trend changes with these conditions:
- Bullish Breakout:
- Opens below VWAP
- Closes above upper band
- Indicates strong momentum shift upward
- Bearish Breakout:
- Opens above VWAP
- Closes below lower band
- Indicates strong momentum shift downward
Technical Details
Base Components
- Built upon PineCoders' ConditionalAverages library
- Incorporates custom alert system via CustomAlertLib
- Uses standard deviation for band calculations
Customization Options
- Adjustable standard deviation multiplier
- Flexible time period settings
- Independent controls for sweep and breakout signals
- Customizable visual elements (colors, sizes, positions)
- Custom alert message formatting
Use Cases
1. Trend Following:
- Use VWAP as dynamic support/resistance
- Monitor breakout signals for trend changes
2. Mean Reversion:
- Use sweep signals for counter-trend opportunities
- Standard deviation bands for range identification
3. Volume Analysis:
- VWAP provides volume-weighted price levels
- Helps identify significant price levels
Notes
- Best performed on liquid instruments with consistent volume
- Most effective on timeframes from 1hours to 4 hours and 1D, anything greater isn't very good
- Recommended to use in conjunction with other technical analysis tools
- Signals can be filtered based on higher timeframe trends
Credits
- Original Rolling VWAP concept by PineCoders
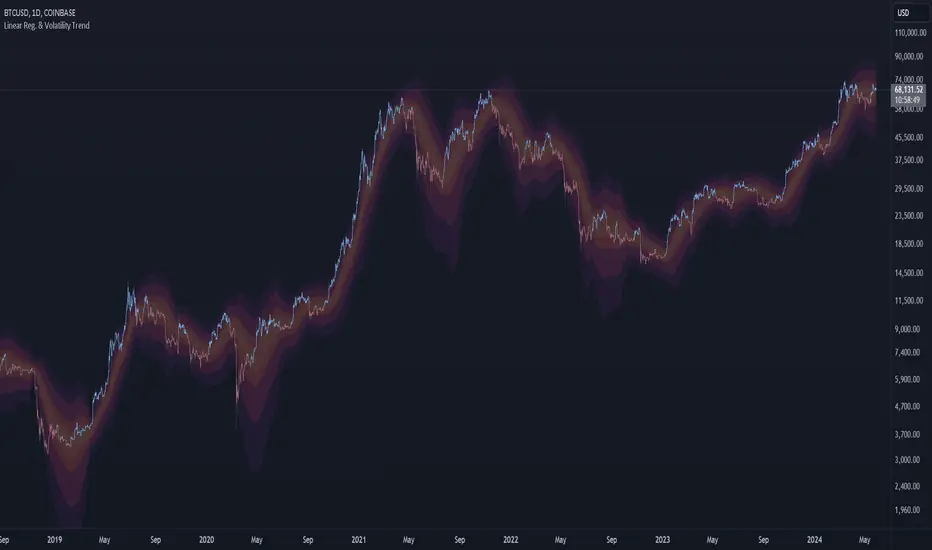
Trend Maestro - Linear Regression & Volatility BandsTrend Maestro - Linear Regression & Volatility Bands
Description:
The "Trend Maestro - Linear Regression & Volatility Bands" indicator is meticulously designed to provide traders with a clear understanding of market trends through the application of linear regression techniques and enhanced market data visualization. This tool is essential for traders looking to interpret long-term trends and market stability. Here's how the indicator functions and what makes it a unique addition to your trading toolkit:
1. Linear Regression Calculation:
At the heart of this indicator lies the linear regression calculation, which identifies the primary trend direction over a specified period. It does this by computing a line of best fit through the closing prices, helping to smooth out price fluctuations and highlight the prevailing trend direction. Users have the flexibility to adjust both the length of the regression and the offset period, enabling them to tailor the indicator's responsiveness to different market conditions.
2. Visualization Through Volatility Bands:
The volatility bands, plotted at half, one, two, and three standard deviations around the linear regression line, serve primarily as a visualization tool rather than a basis for investment decisions.
These bands:
Measure the dispersion of price from the trend line, providing a graphical representation of volatility.
Help traders visually assess the market's stability and the reliability of the current trend, with broader bands indicating higher volatility and narrower bands suggesting more stability.
3. Customization Features:
The indicator offers customization options including toggle switches for bar color and the display of SD bands, enhancing visual clarity. These settings allow traders to personalize the display according to their visual preferences and analysis requirements.
By incorporating these elements, the "Trend Maestro - Linear Regression & Volatility Bands" indicator offers a framework for understanding market trends through both quantitative calculations and qualitative visual aids. This makes it a valuable tool for those looking to make informed decisions based on longer-term market observations.
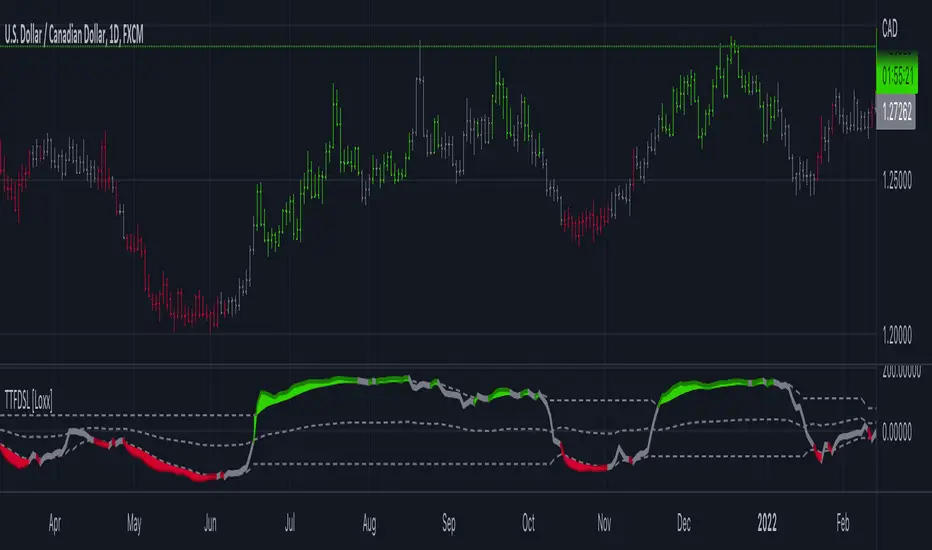
Trend Trigger Factor w/ Discontinued Signal Lines [Loxx]Trend Trigger Factor w/ Discontinued Signal Lines is a Trend Trigger Factor indicator with floating boundary lines to identify trends earlier
What is the Trend Trigger Factor?
Designed by M.H. Pee, the Trend Trigger Factors role is to help traders detect uptrends and downtrends and thus allow them to better position themselves in a with-trend manner. Its creator argues that the markets are mostly random but have a small trend component, which is the most crucial part of trading success. Being able to determine whether the market is in a bull or bear trend and how strong that trend is will allow you to be on the right side of the market for longer, capitalizing as much as possible on its trending behavior.
In his article, M.H. Pee used a 15-period trackback span to explain the calculations. The TTF formula is based on the so-called Buy Power and Sell Power. In his example, Pee labeled today as day 1, yesterday as day 2, the preceding day as day 3 and so on
What's new in this indicator?
Averages filter out prices prior to being used in calculation. That way the lag added is smaller than when the smoothing is used on the calculated result.
Unlike the original which uses levels +100 and -100 as significant levels for signal triggering, this version is using discontinued signal lines for trend filtering. That way it makes it a bit more responsive to market conditions
How do I use this?
The Trend Trigger Factor is similar in interpretation to the Relative Strength Index. It is plotted on a scale with most prominent levels at +100 and -100, crosses of which logically signal possible trade entries. The difference here, however, is that the upper and lower boundary flex with price movements so the upper and lower boundary shift dynamically. Crosses above the top line signify bullish sentiment, crossed below the the bottom line signify bearish sentiment.
Trend Pro ReversalTrend Pro Reversal Indicator ( TPR ) is a trend following indicator that I created to analyze market trends.
It is a perfect tool for investors/swing traders to ride the waves.
The algorithm combines several settings.
Multiple moving averages and indicators to follow the trend : their confluence associates a color at each daily candle:
-Red ( bearish ++ )
-Green ( bullish ++ )
-Orange (trend reversal - pre bearish )
-Light blue (trend reversal - pre bullish )
Color precision can be managed in the settings pannel. More precision = more reactivity but also can imply more false signals. The optimal settings is between 32 to 34.
-"Bottom detector" (green dots) : volume based algo, generally corresponds to Spikes in selling volume , and interesting low prices zones.
>>>This setting need to be adjust to each asset and exchanges because it's volume based. Some exchange are more relevant than other (coinbase, ftx, binance..)
For exemple for bitcoin , coinbase with a 150-160 bottom setting is good for mid-long term bottoms.
The lower bottom precision is, the more it shows short term dips.
- "Weakness detector" (white dots) : weakness in the trend - avoid fake outs
>>>This is not necesseraly a sell signal.
When buying momentum and price action is weak, this parameter is actived. It can often lead to short/mid term dump
- Confirmation cloud :
>>>Break it to the upside and there are more chances that the trend is confirmed. It often acts like support cloud in bitcoin bullmarkets. Waiting for the break of the confirmation cloud imply lower risk but also lower performance for swing traders.
Accumulate and averaging down when an asset shows green dots + red candles (bottom zone) and start to close position when weakness come in (green/orange/early-red /white dots) can permit to maximize gains in bullmarket and protect wallet when corrections happen.
-> Ideal use in daily timeframe . Some false signal can happen only when the trend is not clear. (tight range and f*ckmoves)
Designed for bitcoin initially. (works with most altcoins / stocks )

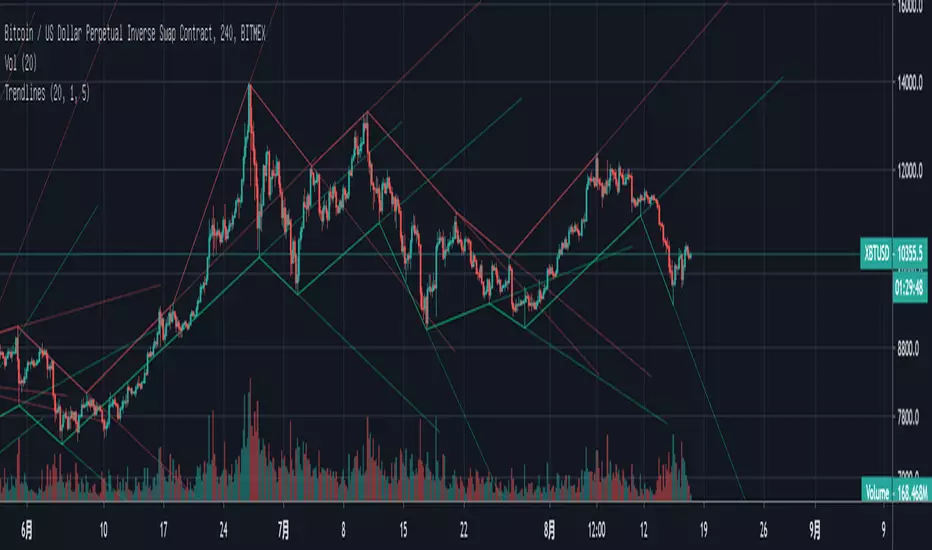
Trends & Pivots [SignalCave]Trends & Pivots Indicator helps you to identify primary and secondary trends and potential support/resistance zones.
Trend detection have three modes which are “Aggressive, Moderate and Conservative” . You can customize the mode on settings screen.
Alerts are available for various conditions such as "Uptrend Shift, Downtrend Shift, Primary Uptrend Begin, Primary Downtrend Begin, Secondary Uptrend Begin, Secondary Downtrend Begin"
Type asset name on symbol search area.
Adjust your timeframe that you wish to track.
Click "Create Alert"
Select one of the condition that you wish to get inform from create alert panel.
Select "Once Per Bar Close" option.
Click "Create" .

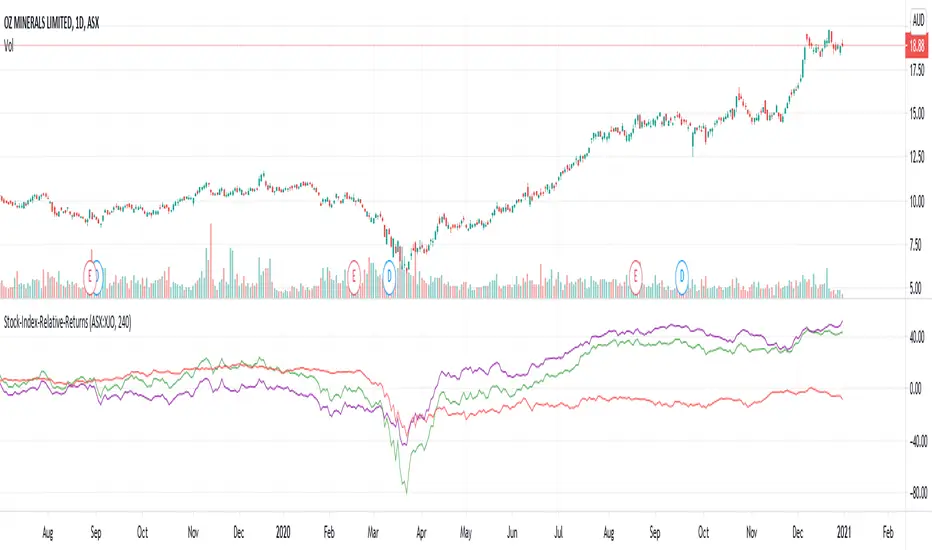
Stock-Index-Relative-ReturnsThis is one of the entry conditions of Mark Minervini's trend template for entry conditions.
This indicator plots returns in comparison with index. (Change the index ticker in the input as per the stock in use)
Loopback period is the distance from which we are calculating returns.
Green line indicates returns of the stock
Red line indicates returns of the index
Purple line is the difference between both.
Mark Minervini's trend template expects stock_returns/index_returns to be at least 7 - which means at least 70% higher than index returns.
TrendmasterThere are many strategies, algorithms, and scripts used for multiple markets, but one thing has remained constant - Trend trading has remained the simplest, most effective way for retail traders to profit in the complex financial systems operating today. This was proven in the Turtle trading experiments of Richard Dennis whereby 23 novice traders were taught a trend following strategy, subsequently becoming millionaires within the span of a few years.
In this post, I would like to introduce the Trendmaster. A trend-following strategy that takes the guesswork out of price changes with clear, actionable signals. Developed through extensive quantitative testing, i release this indicator to the tradingview community for free. For maximum results, this strategy should be combined with a solid risk management system such as an ATR based position sizing system.

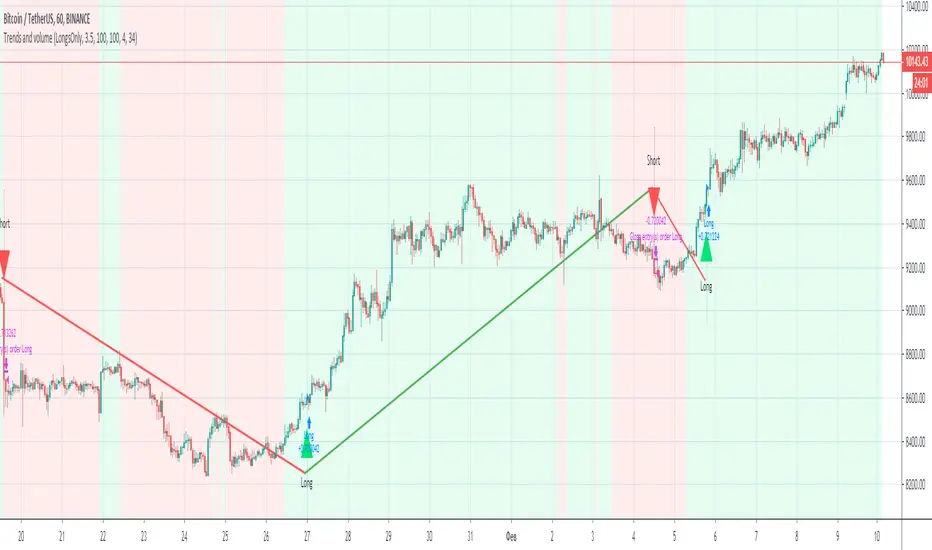
Trends and volume“Trends and volume” is a pair of ZigZag and Volume indicators. If in the ZigZag indicator a trend has changed from descending to ascending, and in the Volume indicator the volume of purchases (accumulation) exceeds the volume of sales (distribution), a signal to open a long position occurs.
Accordingly, the opening of a short position occurs with opposite indicators of trend and volume. The strategy has Volume smoothing settings and a ZigZag filter for selecting optimal settings on other instruments.
With default settings, the strategy allows you to make 2-4 successful trades per month, ideally shows the direction of the trades on the BINANCE:BTCUSDT , timeframe 1 hour.
Together with the “Trends and volume” backtest, you get the “Trends and volume alerts” indicator in which the alert function is built-in, you can set an alert for events: long entry and short entry.
Pay attention when you set alerts in the tradingview in the indicator, the true signal comes at the close of the hourly candle.
I can open demo access to the Trends and volume strategy for 15 days, for this write me.
Trendy Bar Trend ColorTrendy Bar Trend Color
Inspired by trend candlestick charts on other trading platforms. Changes bar colors to stay in trend much like Heikin Ashi candles without the ATR price distortion. This is done by comparing the HL2 and/or Open-Close values of current candlestick to the prior candlestick.


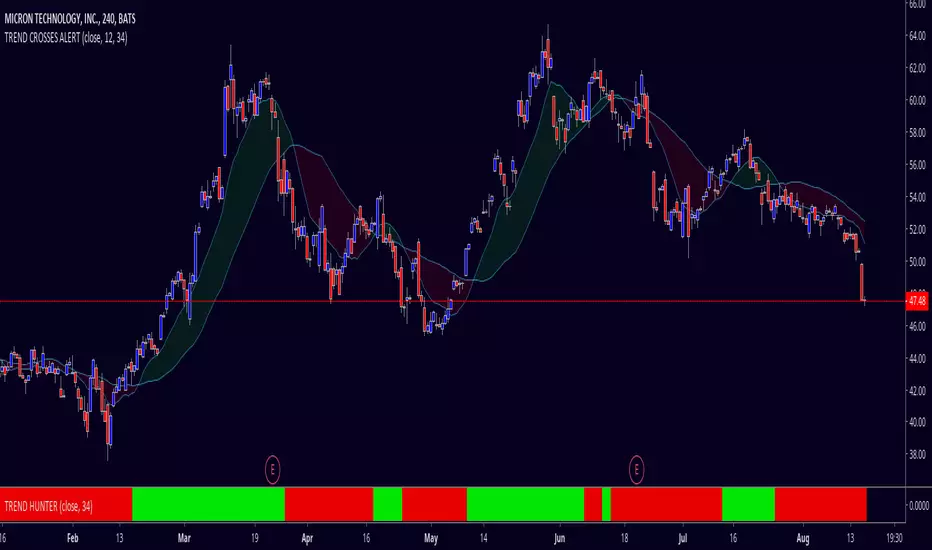
TREND HUNTERTrend trading is a trading strategy that attempts to capture gains through the analysis of a security's momentum in a particular direction. Trend traders enter into a long position when a security is trending upward (LIME COLOR) and/or enter a short position when a security is trending lowerRED COLOR).
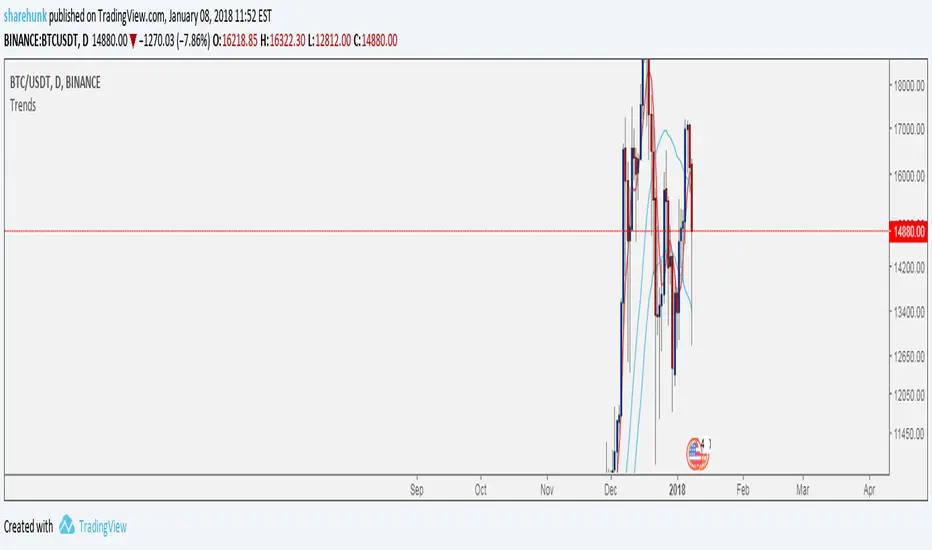
TrendsThis chart will allow users to have a guide line for trading any markets by utilizing the below strategy.
a) For an up trending market
A good BUY is when price reaches/drops near the RED line.
b) For a down trending market
A good SELL is when the price rises to the RED line.
Keeping it Simple !
Disclaimer : Trading involves risk, this script/strategy is not trading advise, rather it can act as a tool among others to gain confidence to enter a trade.
Trend Change ScannerTrend Change Scanner
Focused on detecting trend reversals:
Shows reversal status: BULL REV, BEAR REV, BULL SETUP, BEAR SETUP, or Neutral
Displays: Trend direction, RSI, ADX, EMA Gap %, Bull/Bear scores
Yellow highlight when EMA gap < 0.5% (EMAs converging - potential cross)
Overall signal with action recommendation
