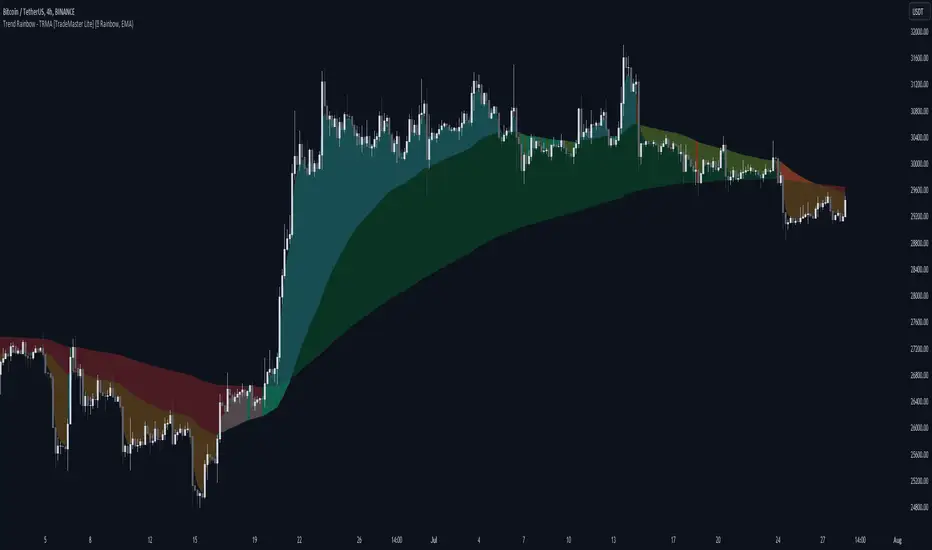
Trend Rainbow Moving Averages [TradeMaster Lite]The Trend Rainbow indicator is a simple technical analysis tool that uses moving averages to identify trends and potential buy and sell signals. It utilizes simple visualization techniques to present trend information in an intuitive, easily interpretable manner. This 21st-century tool is tailored for the modern trader who values both precision and simplicity.
The indicator uses our unique TRMA method to define short-term, intermediate, and long-term market trends. The TRMA (Trend Rainbow Moving Averages) is our own invention: a complex but flexible moving average matrix calculation that is designed to measure market trend direction, strength and shifting. Traders have the flexibility to choose from four types of moving average calculation bases to create a "rainbow".
👉 Example of usage:
General trend direction of the asset can be identified by looking at the slope of the rainbow. If the rainbow is generally pointing up, the asset is in an uptrend, if it is pointing down, the asset is in a downtrend. The indicator can also be used to assess the strength of a trend, identify potential resistance and support levels, and manage risk.
The Lite version of the indicator has 2 main trends to help you assess information about the direction and strength of asset's trend:
Intermediate trend: teal for bull trend, orange for bear trend.
Long-term trend: green for bull trend, red for bear trend.
Left side:
The image clearly shows that during the decline, the bearish intermediate trend was tested multiple times, acting as a resistance. This is a sign of weakness in the intermediate trend. The price did not have enough strength test the long-term trend yet, which is a sign that the long-term trend is still bearish.
Right side:
The intermediate trend first turned into neutral, then bullish. This is a sign of strength in the short-term and medium-term trends. This strength did not weaken and eventually. By maintaining the bullish intermediate trend, the long term trend was able to turn bullish again and a strong uptrend is now unfolding. This is a sign that the long-term trend is changing to bullish.
The Trend Rainbow also helps in risk management. On the right side of the chart the price is making a very steep move and both the intermediate and long-term trends are very far away from the current price. This shows us potential risk and the possibility of a deeper pullback. Trend edges can be used as potential entries or targets, depending on the situation.
👉 General advice
Confirming Signals with other indicators:
As with all technical indicators, it is important to confirm potential signals with other analytical tools, such as support and resistance levels, as well as indicators like RSI, MACD, and volume. This helps increase the probability of a successful trade.
Use proper risk management:
When using this or any other indicator, it is crucial to have proper risk management in place. Consider implementing stop-loss levels and thoughtful position sizing.
Combining with other technical indicators:
The indicator can be effectively used alongside other technical indicators to create a comprehensive trading strategy and provide additional confirmation.
Keep in Mind:
Remember that the example presented highlights how the Trend Rainbow indicator can be used. However, like all indicators, it is not a definitive market predictor. Thorough research and backtesting are essential before making any trading decisions. Furthermore, it's crucial to have a solid understanding of the indicator and its behavior. Additionally, incorporating fundamental analysis and considering market sentiment can be vital factors to take into account in your trading approach.
Limitations:
The indicators within the TradeMaster Lite package aim for simplicity and efficiency, while retaining their original purpose and value. Some settings, functions or visuals may be simpler than expected.
⭐ Conclusion
We hold the view that the true path to success is the synergy between the trader and the tool, contrary to the common belief that the tool itself is the sole determinant of profitability. The actual scenario is more nuanced than such an oversimplification. Our aim is to offer useful features that meet the needs of the 21st century and that we actually use.
🛑 Risk Notice:
Everything provided by trademasterindicator – from scripts, tools, and articles to educational materials – is intended solely for educational and informational purposes. Past performance does not assure future returns.
Cerca negli script per "trend"
Dynamic Trendline Break - Strategy [presentTrading]- Introduction and How It Is Different
The Dynamic Trendline Break Strategy is a unique trading algorithm that leverages the power of trendlines and swing detection to identify potential trading opportunities.
Unlike traditional trendline strategies that rely on static trendlines, this strategy dynamically calculates trendlines based on pivot highs and lows.
This dynamic approach allows the strategy to adapt to changing market conditions (especially 24hr markets like Crypto) and potentially identify trading opportunities that static trendlines might miss.
BTCUSD 6hr chart
Tencent 700.HK 1D chart
- Strategy, How It Works
The strategy works by first identifying pivot highs and lows using a lookback period defined by the user. These pivot points are then used to calculate the slope of the trendlines. The slope calculation method can be chosen from three options: Average True Range (ATR), Standard Deviation (Stdev), or Linear Regression (Linreg), providing flexibility to the trader.
Once the trendlines are calculated, the strategy identifies potential trading opportunities when the price crosses over the upper trendline (for long trades) or crosses under the lower trendline (for short trades). The strategy also allows the user to define the trade direction (Long, Short, or Both) and the stop loss method (Fixed or SuperTrend).
- Trade Direction
The trade direction parameter allows the user to define the direction of the trades that the strategy will take. If set to "Long", the strategy will only take long trades when the price crosses over the upper trendline. If set to "Short", the strategy will only take short trades when the price crosses under the lower trendline. If set to "Both", the strategy will take both long and short trades.
- Usage
To use this strategy, simply input your desired parameters for the swing detection lookback, slope, slope calculation method, trade direction, stop loss method, and stop loss level. Once these parameters are set, the strategy will automatically calculate the trendlines and identify potential trading opportunities based on the defined parameters.
- Default Settings
The default settings for the strategy are as follows:
Swing Detection Lookback: 30
Slope: 0.618
Slope Calculation Method: ATR
Trade Direction: Both
Stop Loss Method: SuperTrend
Stop Loss Level: 15%
SuperTrend Factor: 3
SuperTrend Lookback: 21
These settings can be adjusted to suit your trading style and risk tolerance. Always remember to backtest any changes to the settings before live trading.

Dynamic Trendlines Multi-TimeframeThe Dynamic Trendlines indicator is a useful tool for traders to identify potential support and resistance levels in the market. By analyzing price volatility and drawing trendlines based on high volatility candles, it helps traders visualize key price levels that may influence future price action. This indicator uses the Average True Range (ATR) as a measure of price volatility to determine the threshold for high volatility candles. This indicator can be used on multiple time frames, so just choose which one works best for you!
The underlying concept of this indicator revolves around the calculation of the True Range and Average True Range. The True Range is the maximum value among the difference between the current high and low, the absolute value of the difference between the current high and previous close, and the absolute value of the difference between the current low and previous close. The ATR is then calculated as the simple moving average of the True Range over a user-defined period (default is 14). The threshold for high volatility candles is determined by multiplying the ATR by a user-defined multiplier (default is 1.5).
The indicator identifies high volatility candles when the closing price is greater than the previous closing price plus the threshold. Based on the price action, trendlines are drawn connecting the high or low of high volatility candles. The initial color and style of the trendline are determined by whether the price is moving up or down. Green solid lines represent upward price movement, while red solid lines represent downward price movement.
As the price crosses the trendlines, the indicator tracks the number of crosses and updates the line's style accordingly. If the price crosses a trendline twice, the line style is changed to dashed, indicating the potential weakening of the support or resistance level.
This indicator works best with trading methods that focus on capturing price breakouts or reversals. Traders can use the trendlines to identify potential entry or exit points, stop-loss levels, or take-profit targets. It's important to note that this indicator should be used in conjunction with other technical analysis tools and an understanding of the overall market context to make informed trading decisions.
When using the Dynamic Trendlines indicator on TradingView, users can customize the ATR length, threshold multiplier, and the number of recent trendlines displayed on the chart. Additionally, small triangles are plotted below high volatility candles, with their color based on the trendline it starts, providing a quick visual reference for traders.
In summary, the Dynamic Trendlines indicator is a valuable tool for identifying potential support and resistance levels in the market by analyzing price volatility and drawing trendlines based on high volatility candles. It is best suited for breakout and reversal trading strategies and should be used in conjunction with other technical analysis tools for optimal results.

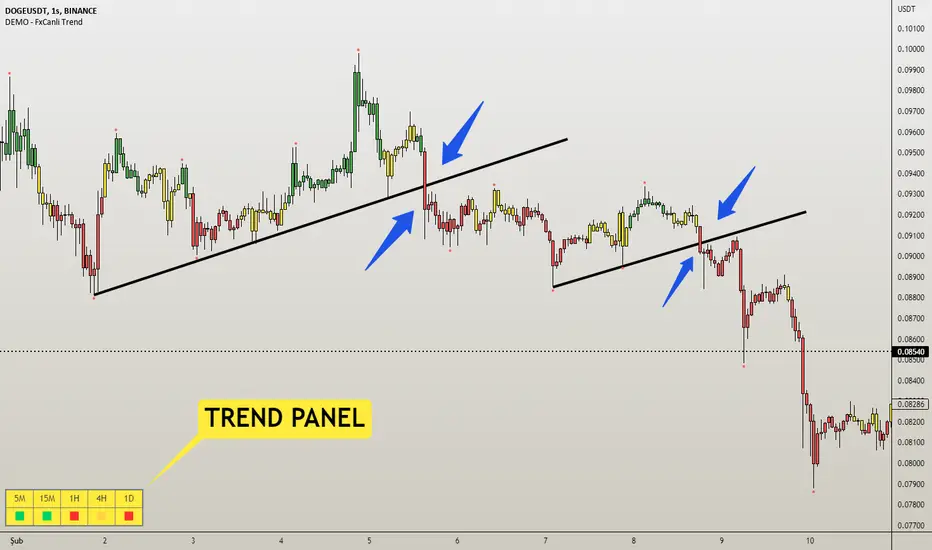
DEMO - FxCanli TrendEN - FxCanli Trend indicator will help you to show the way of the trend and give alerts when trend changed
DEMO VERSION of FXCANLI TREND Indicator work with any NZD or any DOGE symbols
TR - FxCanli Trend İndikatörü grafiklerinizde trendin yönünü veren ve trend değiştiğinde alarm veren TradingView indikatörüdür.
FXCANLI TREND indikatörünün DEMO VERSİYONUNU herhangi bir NZD veya DOGE sembolü ile kullanabilirsiniz.
EN - For Example | TR - Örnek
NZD|...
NZD|USD
NZD|CAD
NZD|CHF
NZD|JPY
DOGE|...
DOGE|USD
DOGE|USDT
DOGE|USDTPERP
DOGE|BTC
EN - FxCanli Trend indicator will help you to show the way of the trend and give alerts when trend changed
When the candles are;
Green Candles - Up Trend
Yellow Candles - Trend may Change
Red Candles - Down Trend
TR - FxCanli Trend İndikatörü grafiklerinizde trendin yönünü veren ve trend değiştiğinde alarm veren TradingView indikatörüdür.
Yeşil Mumlar - Yukarı Trend
Sarı Mumlar - Trend Dönebilir
Kırmızı Mumlar - Aşağı Trend
HOW TO USE BUY & SELL SIGNALS ?
(ALIŞ & SATIŞ SINYALLERI NASIL KULLANILIR?)
1) Never use BUY or SELL signals without any chart patterns. (Alış veya Satış sinyallerini asla formasyonsuz kullanmayın)
it can give good results with the candle color change when chart pattern triggered
(Formasyon gerçekleştiğinde, mum rengi değişimi takip edilmeli)
Ex 1) Wedge Pattern (Takoz Formasyonu) - BTC|USDT
Ex 2) Flag Pattern (Bayrak Formasyonu) - ETC|USDT
Ex 3) Head and Shoulders Pattern ( Omuz Baş Omuz Formasyonu)
Ex 4) Triangle Pattern ( Üçgen Formasyonu)
Features - Özellikler
1) Trend Panel - Trend Paneli
2)EN - Panel Width - to get better view at mobile phones and tablets
TR - Cep telefonları ve tabletlerde daha güzel görünüm için Panel Genişliği
3) Multi Timeframe Trend Tracking - Çoklu Zaman Dilimi Trend Takibi
4) Alert Control / Alarm Kontrolü
EN - Selected Alert - when all timeframes have same trend it will give selected time frame alert
TR - Seçilmiş Zaman Dilimi - Tüm seçilen zaman dilimleri aynı trend olunca, seçilmiş zaman dilimi alarmı verir
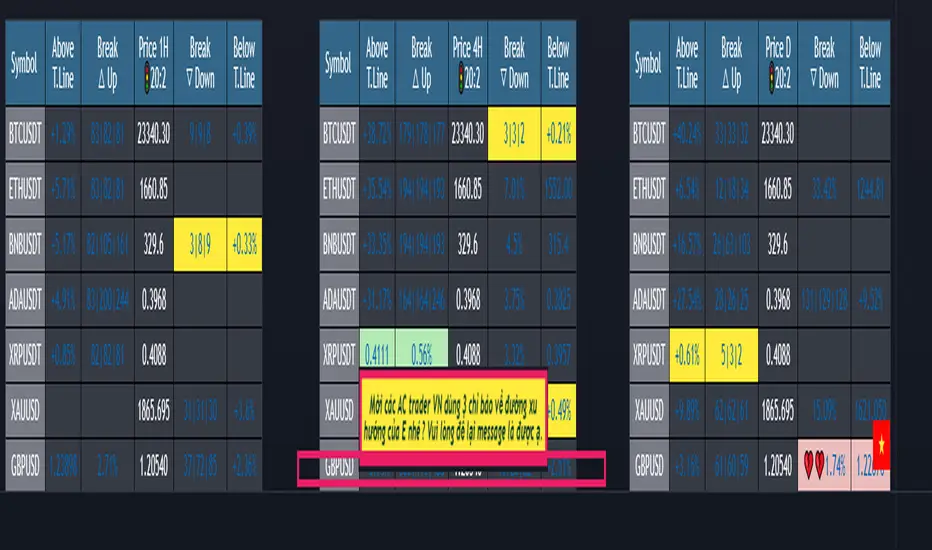
(1-20)Dashboard trendlines PriceThis is a script about 20 trading pairs with trendline.
-on each chart of a trading pair, there is only one trendline pair: 1 uptrendline and 1 downtrendline
-so when the statistics on the table also show the column of the uptrend and the column of the downtrend
-When the price approaches any trendline but the ratio is 1%, that trendline will be colored blue (downtrend), red (uptrend)
-the column above T.line(below T.line) is the value of the current trendline compared to the closing price of the candle
-The Break up (Break down) column when the price breaks will show the green heart (break up), the red heart break (break down) and the percentage value when breaking through the point of the trendline.
-price column is the current price of the candle
-especially when a candle has closed above the trendline (assuming an uptrend), then from the 2nd tree to the current , it will count according to memory so that traders know when the price broke, and how many candles already.
-The breakdown parameter is displayed (for example, 3|8|10), which means that the price has broken through 10 candles, of which 8 trees are closing above the breakout point, and the last 3 are closing above. break point
-In addition, when displaying 3 parameters as above, the next column (above/below T.line) will display the percentage from when the price breaks that point to the current price of the candle.
-you can change the time in Resolution indicator settings to show multiple time arcs
Thank you everyone for your interest and trust
- 5 pairs are free for traders :https://vn.tradingview.com/script/KGSjrLC3/
---------------------------------------------------------------------------------
Vietnamese
Đây là script về bảng thống kê 20 cặp giao dịch với đường trendline .
-trên mỗi biểu đồ của cặp giao dịch chỉ tồn tại duy nhất 1 cặp trendline là: 1trendline tăng và 1 trendline giảm
-vì vậy khi thống kê trên bảng cũng hiển thị cột của trend tăng và cột của trend giảm
-khi giá tiến gần đến 1 đường trendline bất kì mà tỉ lệ còn 1% thì đường trendline đó tô màu xanh(trend giảm) ,màu đỏ(trend tăng)
-cột above T.line(below T.line) là giá trị của đường trendline hiện tại so với giá đóng cửa của nến
-cột Break up(Break down) khi giá phá vỡ sẽ thể thiện trái tim xanh(phá vỡ lên),trái tim đỏ vỡ(phá vỡ xuống) và giá trị phần trăm khi phá qua điểm của trendline.
-cột giá là giá hiện tại của nến
-đặc biệt khi 1 cây nến đã đóng cửa trên đường trendline(giả sử trend tăng) thì từ cây thứ 2 đến hiện tại nó sẽ đếm theo bộ nhớ để các trader biết được giá đã phá khi nào,và qua bao nhiêu nến rồi.
-thông số khi phá vỡ hiển thị (ví dụ là 3|8|10) thì hiểu là giá đã phá vỡ qua 10 nến, trong đó có 8 cây đóng cửa trên điểm phá vỡ,và 3 cây gần nhất đang đóng cửa trên điểm phá vỡ
-ngoài ra khi hiện 3 thông số như trên thì cột bên cạnh (above/below T.line) sẽ hiển thị được số phần trăm tính từ khi giá phá vỡ điểm đó đến giá hiện tại của cây nến.
-các bạn có thể thay đổi thời gian trong cài đặt chỉ báo Resolution để hiển thị nhiều cung thời gian
Cảm ơn mọi người đã quan tâm và tin dùng
Immediate Trend - VHXIMMEDIATE TREND - VULNERABLE_HUMAN_X
This indicator is used to identify the immediate trend in the market.
When a Short Term High (STH) is engulfed and closed above, we consider that as a bullish trend.
And Similarly, when a Short Term Low (STL) is engulfed and closed below, we consider that as a bullish trend.
STH - A candle that is higher than the one candle towards it's left and one candle towards it's right.
STL - A candle that is lower than the one candle towards it's left and one candle towards it's right.
HOW TO USE:
1. Do not take trades purely based on the immediate trend showcased by the indicator. Rather, use them as confluence with your trading strategy.
2. When you are expecting price to reverse at your point of interest (Denamd/Supply zone), this indicator can help you predict the reversal by showcasing the current trend.
3. Using this indicator you can travel the trend as long as there is a change of trend predicted by this indicator.

Rate Of Change Trend Strategy (ROC)This is very simple trend following or momentum strategy. If the price change over the past number of bars is positive, we buy. If the price change over the past number of bars is negative, we sell. This is surprisingly robust, simple, and effective especially on trendy markets such as cryptos.
Works for many markets such as:
INDEX:BTCUSD
INDEX:ETHUSD
SP:SPX
NASDAQ:NDX
NASDAQ:TSLA

Support & Resistance/Supply & Demand/Liquidity/Trendlines (Expo)Real-Time Support & Resistance/Supply & Demand/Liquidity Zones /Trendlines / Key Levels
This trading tool automatically identifies real-time Support/Resistance, Supply and Demand, Liquidity Zones, Key levels, and Trendlines.
FEATURES
This indicator includes all necessary features for traditional technical analysis, such as Trendlines, Support/Resistance, Supply/Demand, and Liquidity Zones. In addition to that, we have added key market levels.
Support/Resistance: Identifies areas in real-time where the price finds support and resistance.
Supply/Demand: The indicator analyzes the market structure in real-time and maps out key supply and demand zones. The user gets an instant understanding of the current market structure.
Liquidity Zones: Liquidity zones are displayed where there is a significant level of trading activity and when there is both high supply and demand for an asset, security, or contract.
TrendLines: Trendlines help traders determine the current direction of market prices. A trendline is displayed when a price action trend is detected.
Key Levels: Key levels are psychological levels that are under the attention of many traders. There is a lot of buying or selling pressure at these levels. At these key levels, price decides its direction, either to go bearish or bullish.
HOW TO USE
Use the indicator to identify several important and commonly used levels and zones. All zones work as a future reference where the price has a higher likelihood to react at, bounce off from, or reverse.
-----------------
Disclaimer
Copyright by Zeiierman.
The information contained in my Scripts/Indicators/Ideas/Algos/Systems does not constitute financial advice or a solicitation to buy or sell any securities of any type. I will not accept liability for any loss or damage, including without limitation any loss of profit, which may arise directly or indirectly from the use of or reliance on such information.
All investments involve risk, and the past performance of a security, industry, sector, market, financial product, trading strategy, backtest, or individual’s trading does not guarantee future results or returns. Investors are fully responsible for any investment decisions they make. Such decisions should be based solely on an evaluation of their financial circumstances, investment objectives, risk tolerance, and liquidity needs.
My Scripts/Indicators/Ideas/Algos/Systems are only for educational purposes!
Script a pagamento

MTF Trend WidgetThis indicator identifies trends in multiple higher timeframes (D, W, M) and shows them in a widget off to the right of the chart.
It's meant to be used as an alternative filter for "trading with the trend." Typically people use moving averages of varying lengths for this (i.e. if over 200 MA it's an uptrend, etc.), but I wanted to see if it might be more effective to see if the higher timeframes were actually trending or not in a certain direction.
For the purposes of this indicator, an uptrend is defined as higher highs and higher lows. So if currently in a downtrend and the highs are broken, the indicator will flip to an uptrend because now we have a higher high. Vice versa for downtrends.
The user can choose the lookback period for defining these highs/lows (the pivot points). A smaller lookback number will give you more frequent pivot points.
The user can toggle on visibility of all historical pivot points to make sure the frequency and placement of the swing highs/lows is to their liking.
The user can show the support/resistance lines of those most recent swing high/low points on the multiple timeframes as well.
When these lines are breached, that is when the trends change, so you can see if you are close to changing any longer term trends.
My hope is that this gives people a quick glance at the overall trend without having to cycle through different timeframes.

Breakout & Trend & Scalping (Zeiierman)█ Overview
Breakout & Trend & Scalping (Zeiierman) transforms time, volume, and trend behavior into a unified visual framework for identifying market expansion, compression, and breakout phases. Instead of viewing price as an isolated movement, the indicator reinterprets it as a continuous relationship between time-driven flow, volume displacement, and trend momentum.
The system constructs a hybrid analytical field using OBV-based flow modeling, time–trend alignment, and adaptive candle smoothing, providing a clear and fluid representation of both breakout probability and structural trend strength.
This advanced framework adapts to different market contexts, including intraday scalping, swing-trend validation, and multi-timeframe continuation analysis, revealing how volume and trend energy accumulate before volatility expansion.
⚪ Why This One Is Unique
Unlike conventional breakout or trend indicators that rely solely on price or volatility, this tool integrates time-weighted OBV mechanics, multi-timeframe trend correlation, and volatility-normalized candle transformation.
Its design leverages an adaptive Time–Trend Integration Engine that adjusts dynamically based on the selected timeframe and method. The result is a fluid, self-normalizing view of market rhythm, capturing not only the visible structure of trends but also the hidden buildup of momentum that precedes breakouts.
█ Main Feature: BTS Adaptive Candle System
The BTS Adaptive Candle System unifies time-based and trend-based flow analysis into a single visual model of market behavior. It synchronizes short-term momentum with long-term trend equilibrium, revealing how volume and directional energy evolve across different temporal structures.
The flow is inherently adaptive. During stable phases, it compresses volatility to emphasize directional persistence and trend continuity. When acceleration builds, it expands to highlight breakout potential and the ignition of new momentum.
Green-to-red and (red-to-green) transitions indicate shifts in order-flow dominance, while color intensity reflects the relative strength of participation. The built-in smoothing system filters out random noise while maintaining fast response to emerging direction, making the BTS Candle System equally effective for scalping precision, breakout confirmation, and long-term trend tracking.
█ How to Use
⚪ Trend Trading
Bullish trends appear when candles remain near the top of their range with bright, steady coloration. This structure shows sustained accumulation and consistent trend support. Fading color or mixed tones suggest short pauses or shallow pullbacks within an ongoing uptrend.
Bearish trends form when candles cluster near the lower range and deepen in red intensity, reflecting growing selling pressure. Consistent red sequences mark continued distribution, while lighter tones or brief color shifts often precede corrective bounces within a broader downtrend.
⚪ Trend Change Trading
When a large BTS candle crosses the midline, it often marks a decisive shift in market control. A strong candle breaking above the midline reflects dominant buying flow and the early phase of bullish momentum, often signaling the start of a new upward trend.
Conversely, when a large candle drops below the midline, it shows dominant selling pressure and the potential beginning of a downward cycle.
These midline transitions represent key moments where institutional flow changes direction. A rapid color shift or fading saturation in candles around these areas frequently precedes a trend reversal or volatility breakout, making them powerful confirmation points for both breakout and trend-change strategies.
⚪ Retracement/Pullback Trading
When BTS candles remain green or turn light yellow near the midline, it indicates balanced momentum as price consolidates during a temporary retracement. A renewed shift back to bright green candles from this area often signals the end of the pullback and the continuation of the uptrend.
In a downtrend, when BTS candles shift to light yellow or fade toward the midline, it shows a temporary slowdown in selling pressure as the price retraces upward. A return to deep red candles after this brief balance phase confirms renewed selling momentum and continuation of the prevailing downtrend.
⚪ Breakout Trading
Big candles in the BTS indicate a shift in control. If this occurs around a resistance level, there is a high chance that price will break out upward.
Similarly, if a large downward BTS candle appears near a support level, there is a high chance that a bearish breakout will follow through.
█ How It Works
⚪ Integrated Market Framework
The BTS system merges time, trend, and volatility behavior into a single adaptive flow field. It constantly balances fast and slow market components, maintaining a smooth equilibrium between short-term reactions and long-term structure.
Calculation: Uses normalized scaling and adaptive synchronization to align directional momentum across changing market states.
⚪ Core Trend Engine
At its center, the model interprets how price movement evolves within its volatility range. It tracks shifts in directional energy and transforms them into a stable momentum surface that highlights both trend continuation and turning points.
Calculation: Applies equilibrium-based mapping to sustain consistent directional flow even during market acceleration or compression.
⚪ Volatility Envelope System
The indicator forms a dynamic envelope around price movement, expanding and contracting with the current market speed. These zones reflect where energy concentrates or fades, helping visualize breakout potential and exhaustion levels.
Calculation: Adapts envelope boundaries through volatility-responsive scaling and balanced symmetry control.
⚪ Adaptive Time Modes
Two adaptive modes — Time and Trend — control how the model responds to changing conditions. The system automatically adjusts its responsiveness, allowing it to behave as a fast scalping model or a slow trend tracker without losing structural balance.
Calculation: Dynamically modifies its internal scaling to maintain equilibrium between speed and smoothness across selected timeframes.
-----------------
Disclaimer
The content provided in my scripts, indicators, ideas, algorithms, and systems is for educational and informational purposes only. It does not constitute financial advice, investment recommendations, or a solicitation to buy or sell any financial instruments. I will not accept liability for any loss or damage, including without limitation any loss of profit, which may arise directly or indirectly from the use of or reliance on such information.
All investments involve risk, and the past performance of a security, industry, sector, market, financial product, trading strategy, backtest, or individual's trading does not guarantee future results or returns. Investors are fully responsible for any investment decisions they make. Such decisions should be based solely on an evaluation of their financial circumstances, investment objectives, risk tolerance, and liquidity needs.
Script a pagamento

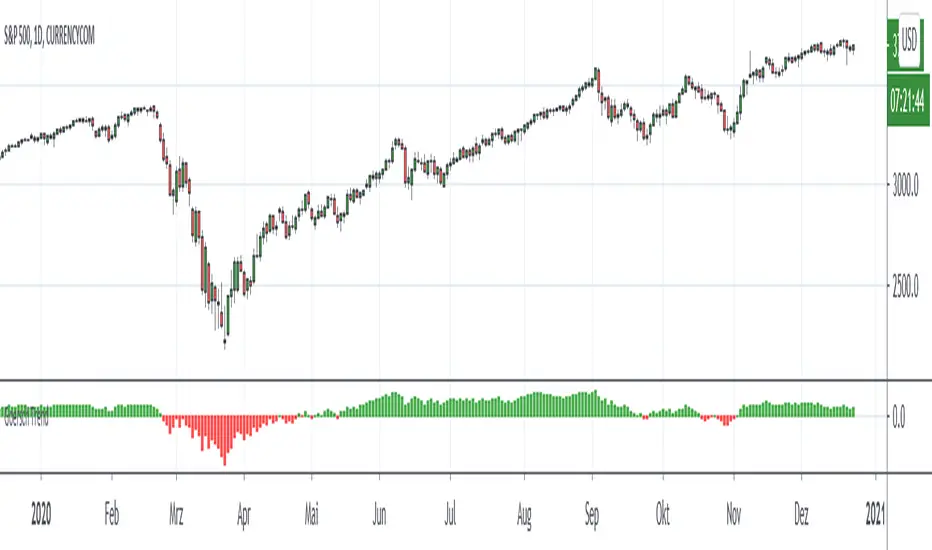
Goersch TrendENGLISH:
Goersch Trend Indicator for TradingView is a trend indicator that shows the actual trend and the trend strength based on the price movement of the past. The indicator can be used for any underlying and trading timeframe. The special feature is that it is extremely easy to interpret and that it works "out-of-the-box". The calculation automatically adjusts to the displayed timeframe. The interpretation of the Goersch Trned indicator is always the same - whether you are looking at a stock, a currency, an index or a commodity. Regardless of whether you work in the 5-minute chart, hourly, daily or even weekly chart. It is extremely simple to judge whether an underlying is running in a trend, whether this trend strength is currently increasing (stable) or decreasing (when the trend is weakening), or whether the trend is currently changing direction. The indicator shows you the important information at a glance.
The interpretation of the Goersch Trend indicator is very simple. Red bars represent a downward trend, green bars appear during an upward trend. The change from red to green signals a change from a downward to an upward trend and vice versa. The height of the bars represents the trend strength. The trend strength decreases when the bars become shorter. The change from red to green then signals a completed trend change.
For the calculation of the bar height, the fluctuation of a price change index is used as a basis in the Goersch Trend Indicator. The price change index is calculated from the respective candle closing price and the true high or true low of the previous candle, which is added or subtracted accordingly. From this price change index, a long-term moving average is calculated, the difference between this average and the price change index is visualized by means of the red and green bars.
To get access to the script, please PM, or send a message to the email address in the signature.
DEUTSCH:
Beim Goersch Trend Indikator für TradingView handelt es sich um einen Trend-Indikator, der anhand der Preisbewegung der Vergangenheit den Trend sowie die Trendstärke anzeigt. Verwendet werden kann der Indikator für jegliche Basiswerte und Zeiteinheiten. Das Besondere ist, dass er extrem leicht zu interpretieren ist und dass er "out-of-the-box" arbeitet. Die Berechnung passt sich automatisch auf die dargestellte Zeitebene an. So ist eine Interpretation immer gleich – egal ob Sie eine Aktie, eine Währung, einen Index oder einen Rohstoff betrachten. Unabhängig davon, ob Sie im 5-Minuten-Chart, Stunden-, Tages- oder gar Wochen-Chart arbeiten. Dabei ist es äußerst simpel zu beurteilen, ob ein Wert in einem Trend läuft, ob diese Trendstärke gerade zunimmt (also stabil ist) oder abnimmt (der Trend also schwächer wird), oder ob der Trend gerade kippt. Der Indikator zeigt Ihnen die wichtigen Informationen auf einen Blick.
Die Interpretation des Goersch Trend Indikators ist denkbar einfach. Rote Balken stehen für einen Abwärtstrend, grüne Balken erscheinen während eines Aufwärtstrends. Der Wechsel von Rot auf Grün signalisiert einen Wechsel vom Abwärts- in einen Aufwärtstrend und umgekehrt. Die Höhe der Balken repräsentiert die Trendstärke. Dadurch ergibt es sich schon, dass beispielsweise die Trendstärke abnimmt, wenn die Balken kürzer werden. Der Wechsel von Rot auf Grün signalisiert dann einen vollendeten Trendwechsel.
Für die Berechnung der Balkenhöhe wird im Goersch Trend Indikator die Schwankung eines Preisveränderungsindex zugrunde gelegt. Dieser errechnet sich aus dem jeweiligen Kerzen-Schlusskurs und dem True-High bzw. True-Low der vorhergehenden Kerze, das entsprechend hinzugerechnet oder abgezogen wird. Von diesem Preisveränderungsindex wird ein langfristiger gleitender Durchschnitt errechnet, die Differenz dieses Durchschnittes und des Preisveränderungsindex wird mittels der roten und grünen Balken visualisiert.
Um Zugang zum Skript zu erhalten, bitte eine PM, oder eine Nachricht an die Emailadresse in der Signatur.
Range & Trend (Zeiierman)█ Overview
Range & Trend (Zeiierman) is a trend-first mapping of price that fuses an adaptive Range & Trend Line, a Trend Buffer (noise gate), a volatility-aware Trend Tracker, and optional Range Levels & Candles to reveal where trend is establishing, compressing, or handing off to a ranged regime.
Execution is guided by graded Buy/Sell labels (Regular / Plus / Strong), structural HH/HL & LL/LH markers with optional Peak Profit readouts, and a multi-TF Timeframe Scanner for alignment.
⚪ Why This One Is Unique
Unlike single-source trend lines, this version layers two orthogonal stabilizers:
a Range & Trend core that adapts its band size to volatility and dispersion, and
a dynamic smoothing buffer that dampens insignificant fluctuations, ensuring only meaningful trend movements affect signal output.
Signals are graded (Regular / Plus / Strong) based on contextual conditions, allowing traders to gauge the conviction behind each trend event. Range Candles add regime context by coloring bars only when a statistically consistent range structure forms, highlighting potential consolidation or transitional market phases. A lightweight Timeframe Scanner completes the workflow, broadcasting alignment from intraday to daily without adding chart clutter.
█ Main features
⚪ Range & Trend Line – Signal Generator
Adaptive directional mapping forms the foundation of the system. It highlights the active trend through color transitions and generates graded Buy/Sell labels (Regular / Plus / Strong) to reflect the strength of confirmation. The line responds dynamically to volatility, revealing when momentum is expanding, stabilizing, or reversing.
Unlike typical reactive signal tools, this model isolates only the most strong and meaningful trend transitions — those with the structural weight to establish or extend a new long-term directional phase. Each signal represents a filtered, high-conviction shift rather than a short-term fluctuation.
⚪ Trend Buffer (Noise Gate)
A precision filter that smooths the core trend output and suppresses false flips caused by short-term noise. It enhances visual consistency and provides the confirmation layer used to promote Regular signals to Plus strength when agreement occurs between buffer and core.
⚪ Trend Tracker
A trailing validation line that tracks directional health and trend persistence. It advances only in the direction of the active move, creating an adaptive stop-like reference. Tracker alignment helps identify trend exhaustion and contributes to Strong-grade signal confirmation.
⚪ Range Levels & Candles
Contextual zones that identify periods of compression or balance. When a valid range forms, candles are shaded within it, distinguishing ranging environments from trending conditions. These zones help anticipate breakouts and define natural support and resistance areas.
⚪ Live Structure (HH/HL & LL/LH with Peak Profit)
Displays real-time structural evolution — Higher Highs/Lows during uptrends and Lower Highs/Lows during downtrends. The optional Peak Profit label shows performance since the last regime change, offering an immediate view of current trend efficiency.
⚪ Timeframe Scanner
A compact multi-timeframe alignment panel that visualizes bullish or bearish trend states across user-selected intervals. It provides fast confirmation of directional consensus, helping traders act only when the broader structure supports their chosen bias.
█ How to Use
⚪ Range & Trend Line – Signal Generator
The Range & Trend Line is the core signal engine — its color shifts mark confirmed directional changes. This is where the system produces the graded Buy/Sell signals shown as ▲ / ▼ labels. Each grade reflects how many internal layers agree at the moment of signal creation:
Regular (▲ / ▼) – Triggered by a confirmed flip in the Range & Trend core. It appears when the base trend direction changes and is the earliest signal of potential reversal.
Plus (▲ + / ▼ +) – Requires the Trend Buffer to confirm the same direction. This upgrade indicates stronger trend agreement and higher reliability.
Strong (▲ ++ / ▼ ++) – These are high-conviction continuation signals and typically occur after structural confirmation.
How to trade them: Regular signals provide early awareness; Plus signals suggest confirmation; Strong signals mark trend maturity or high-probability continuations. Always trade in the direction of the prevailing trend. Use the Trend Buffer or Live Structure to confirm the dominant directional bias before acting on a signal.
⚪ Support and Resistance
The Range & Trend Line and the Buffer Line can act as dynamic support and resistance zones. Price often reacts around these levels, confirming whether the current move is continuing or losing strength.
Look for confirmation or rejection signals near these lines. Reactions around them often mark key decision points within the active trend.
⚪ Range Levels & Candles
Highlights when price enters structured consolidation zones. Candle coloring activates only inside validated ranges, helping to identify areas that show the typical characteristics of a ranging market. These zones visually separate balanced conditions from active trends and provide context for potential transitions.
Watch how price reacts around the upper and lower range levels. Look for false or confirmed breakouts, and expect price to move between these boundaries until a clear breakout develops. Range edges can also serve as practical entry or stop zones.
█ How It Works
⚪ Range & Trend Core
The main engine that defines the chart’s directional trend line. It adapts to changing market conditions, showing a smooth and reliable view of trend strength and direction.
Calculation: Builds a range-adaptive structure whose width adjusts with current volatility. The core moves toward new highs or lows but limits pullbacks to avoid false shifts. Several smoothing methods work together to create a steady, low-lag trend path.
⚪ Trend Buffer (Noise Gate)
A stabilizing layer that keeps the main trend line steady when price noise increases. It improves visual clarity and helps confirm true direction before a trend update appears.
Calculation: Uses a feedback-based update that reacts more when movement is strong and less when noise dominates. This lets the buffer ignore minor fluctuations while staying responsive to real trend changes.
⚪ Trend Tracker
A support line that follows the main move and helps confirm when a trend remains intact. It also serves as a guide for managing active positions.
Calculation: Applies a one-way trailing system that only moves in the direction of the trend. The offset adjusts with volatility, keeping a consistent distance that tightens or widens with market energy.
⚪ Buy/Sell Signal Engine (Regular / Plus / Strong)
The signal system that classifies entries by strength and confirmation level. It reacts to real-time trend changes while filtering weak reversals.
Calculation: Detects state flips in the Range & Trend Core, checks for agreement with the buffer, and rates each signal by historical pattern support. Higher-grade signals appear only when several layers confirm continuation strength.
⚪ Range Levels & Candles
Identifies short-term balance zones and highlights candles within those areas. These zones show where price pauses before the next directional move.
Calculation: Finds upper and lower range limits based on recent highs and lows, confirming only when several bars form a stable zone. Candle colors and level lines extend slightly forward to show likely reaction areas.
⚪ Swing Points & Peak Profit
Marks key turning points and measures performance since the last reversal. It helps track the strength and duration of each movement.
Calculation: Keeps a short memory of recent pivots and updates only when a new high or low replaces the last one. The percent distance from the last flip to the current bar defines the live Peak Profit reading.
⚪ Timeframe Scanner & Alert Aggregator
Combines directional data from multiple timeframes into a single view. Alerts trigger only when all selected timeframes agree.
Calculation: Gathers the trend state from each timeframe, converts it to a simple up or down value, and compares the results. When every layer matches your chosen direction, one clear, high-confidence alert is sent.
-----------------
Disclaimer
The content provided in my scripts, indicators, ideas, algorithms, and systems is for educational and informational purposes only. It does not constitute financial advice, investment recommendations, or a solicitation to buy or sell any financial instruments. I will not accept liability for any loss or damage, including without limitation any loss of profit, which may arise directly or indirectly from the use of or reliance on such information.
All investments involve risk, and the past performance of a security, industry, sector, market, financial product, trading strategy, backtest, or individual's trading does not guarantee future results or returns. Investors are fully responsible for any investment decisions they make. Such decisions should be based solely on an evaluation of their financial circumstances, investment objectives, risk tolerance, and liquidity needs.
Script a pagamento

TBS - Trend Buy and Sell IndicatorTrend Buy and Sell Indicator
TBS identifies trend based on price cross-over/cross-under to a moving average. Confirmed Up-trend is displayed in green and Down-trend in red backgrounds. Before a trend is confirmed price cross-over is displayed in blue and cross-under in orange backgrounds. Once an uptrend is confirmed, TBS suggest buys based on touch downs to a Support moving average by a green arrow under the candle . A sell is suggested by TBS by a red arrow on top of the candle when the price reaches a certain percentage above support moving average. Motivation and Tolerance levels are provided to fine tune buying and selling signals.
Example : Default settings for BTC Weekly charts are Trend Moving Average = 50, Support Moving Average = 21, Motivation Buy = 10, Tolerance Buy = 5, Motivation Sell = 50 and Tolerance Sell = 90. That means in uptrend identified by green background every time the closing price touches 10% higher than 21 week moving average value TBS suggests buy, so a trader can choose to buy 80% of intended position at this level. If the price continues to drop down and touches 5% below 21 week moving average, a trader may choose to buy another 20% at this level. In the likely scenarios of price hike from here a trader may choose to sell 80% at the Motivation Sell level 50% higher than 21 week moving average. If the price reaches Tolerance Sell level at 90% higher than 21 week moving average a trader may choose to sell remaining 20% of the position.
Note 1 : TBS suggest Buys and sells but the execution of buy and sell is up to trader's discretion for example using Stop Buy order or Limit Buy order etc.
Note 2 : TBS is designed to be a medium to long term indicator for example weekly and monthly timescales. Traders might find it useful on shorter term time-frames but its not designed for short term time frame in mind.
Note 3 : Most of the parameters in TBS indicator are configurable as Trend Moving Average and Support Moving Average vary significantly across assets. Default parameters are set for Bitcoin Weekly time frame. Traders should play around with parameters to find best fit for Trend Moving Average and Support Moving Average for the asset of interest. For example TBS is very relevant and useful for Gold Weekly time frame with Trend Moving Average = 100, Support Moving Average = 30, Motivation Buy = 1, Tolerance Buy = 0, Motivation Sell = 11 and Tolerance Sell = 20.

Auto Trend Channel by Atilla YurtsevenHi traders,
I have coded this "Auto Trend Channel" script to help myself to draw a perfect trend. I usually use "Open / Close" as source. Play around with the "Lookback" period to find the best fit. Hope you enjoy it.
Note: This indicator repaints as highs and lows changed.
Remember to follow me and drop some comments below.
Disclaimer: This is not financial advice
Trade safe,
Atilla Yurtseven
Auto Trend Lines [Anan]Hello Friends..
This is Auto Trend Lines, A script that draws trendlines from the pivot points in the price chart,,
So helpful and smart !
Play with the options to adjust the precision.
This is my simple edition from " Trendlines - JD "

BOSS Automatic Trendlines and Support Zones IndicatorTHE BEST FOREX, BINARY OPTIONS, STOCK AND CRYPTO INDICATORS FOR TRADINGVIEW.COM
Our auto-trendlines indicator and our support and resistance zones indicator with Fast and Slow EMA's all combined in one!
TrendLines
Trendlines when drawn properly make an excellent tool for traders. Used improperly though, they become ineffective and even counterproductive, resulting in a belief that prices have made a reversal when they really haven't, or that a trend has strength when price action suggests it doesn't.
The Boss Auto Trendline Indicator draws the trendlines automatically, and now you can effectively use trendlines as part of your trading strategy.
Trendlines highlight a trend or range (sideways movement). A trendline connects swing lows, where the low is lower than the surrounding prices, and swing highs in price. When the price rises, the swing lows rise.
Red Lines & Dots.
Connecting these lows with a line results in an ascending trendline , showing you that the trend is up. A trendline can also be drawn along the swing highs. This shows the angle of ascent, and the strength of the price move, whether strongly higher or not.
Green Lines & Dots
When the price falls, the swing highs fall. Connecting these highs with a line results in a descending trendline , illustrating the downward trend. A trendline can also be drawn along the swing lows. This shows the angle of descent and the strength of the downward price movement.
Support & Resistance Zones
Green = Support Zones
Red = Resistance Zones
The basic trading method for using support and resistance is to buy/long near support in uptrends, and to sell/short near resistance in downtrends.
Fast & Slow EMA's
Trend Following - you essentially use the EMA to track the primary trend. If a trading pair does not close beyond the average - you stay in the trade.
Moving Average Crosses - by using two different exponential moving average crosses you can generate buy and/or sell signals. For example, you can have a fast average cross a slow average to trigger a trade signal.
Dynamic Support and Resistance - EMA periods like the 21 or 55 can act as support and resistance zones.

BOSS Automatic TrendlinesTHE BEST FOREX, BINARY OPTIONS, AND CRYPTO INDICATORS FOR TRADINGVIEW.COM
Trendlines when drawn properly make an excellent tool for traders. Used improperly though, they become ineffective and even counterproductive, resulting in a belief that prices have made a reversal when they really haven't, or that a trend has strength when price action suggests it doesn't.
The Boss Auto Trendline Indicator draws the trendlines automatically, and now you can effectively use trendlines as part of your trading strategy.
Trendlines highlight a trend or range (sideways movement). A trendline connects swing lows, where the low is lower than the surrounding prices, and swing highs in price. When the price rises, the swing lows rise.
Red Lines & Dots.
Connecting these lows with a line results in an ascending trendline, showing you that the trend is up. A trendline can also be drawn along the swing highs. This shows the angle of ascent, and the strength of the price move, whether strongly higher or not.
Green Lines & Dots
When the price falls, the swing highs fall. Connecting these highs with a line results in a descending trendline, illustrating the downward trend. A trendline can also be drawn along the swing lows. This shows the angle of descent and the strength of the downward price movement.
Available at bosscripts.com
Website bosscripts.com

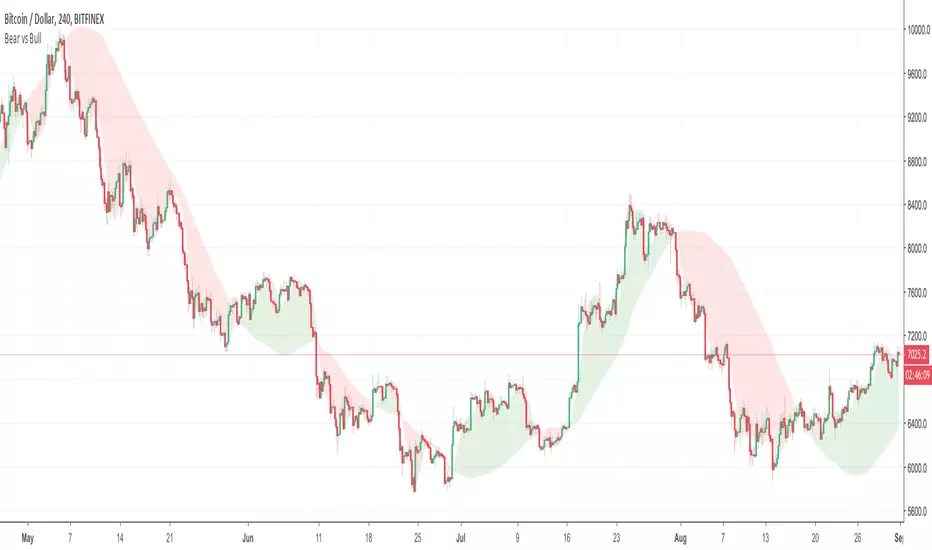
Bear vs Bull Trend indicator by Atilla YurtsevenHi Traders,
Bear vs Bull Trend indicator helps you to determine the trend direction easily. Using this indicator, you will not need to look for the cross-over anymore. You can simply choose your favorite Trend detection indicator from the properties (sma, wma, ema, linear). I usually use Linear trends.
Disclaimer: All the information in this article, including the algorithm & indicator, was provided and published for informational purposes only and should not be considered legal or financial advice.
PS: Please leave some comments and remember to follow me. I share only the indicators that i use.
Happy trading :)
Atilla Yurtseven
Trend Tracer [AlgoAlpha]🟠 OVERVIEW
This tool builds a two-stage trend model that reacts to structure shifts while also showing how strong or weak the move is. It uses a mid-price band (from the highest high and lowest low over a lookback) and applies two Supertrend passes on top of it. The first pass smoothens the basis. The second pass refines that direction and produces the final trail used for signals. A gradient fill between the two trails uses RSI of price-to-trail distance to show when price is stretched or cooling off. The aim is to give traders a simple way to read trend alignment, pressure, and early turns without guessing.
🟠 CONCEPTS
The script starts with a mid-range basis. This is the average of the rolling highest high and lowest low. It acts as a stable structure reference instead of raw close or typical price. From there, two Supertrend layers are applied:
• The first Supertrend uses a shorter ATR period and lower factor. It reacts faster and sets the main regime.
• The second Supertrend uses a slightly longer ATR and higher factor. It filters noise, waits for confirmed continuation, and generates the signal line.
The interaction between these trails matters. The outer Supertrend provides context by defining the broader regime. The inner Supertrend provides timing by flipping earlier and marking possible shifts. The gradient fill uses RSI of (close − supertrend value) to display when price stretches away from the trail. This shows strength, exhaustion, or compression within the trend.
🟠 FEATURES
Bullish and bearish flip markers placed at recent highs/lows
Rejection signals off the trend tracer line
Alerts for bullish and bearish trend changes
🟠 USAGE
Setup : Add the script to your chart. Timeframe is flexible; lower timeframes show more flips while higher ones give cleaner swings. Adjust Length to change how wide the basis range is. Use the two ATR settings and factors to match the volatility of the market you trade.
Read the chart : When the refined trail (stv_) sits above price the regime is bearish; when below, it is bullish. The wide trail (stv) confirms the larger move. Watch the gradient fill: darker colors appear when price is stretched from the trail and lighter colors appear when the move is weakening. Flip markers ▲ or ▼ highlight the first clean shift of the refined trail.
Settings that matter : Increasing the Main Factor slows main-trend flips and filters chop. Increasing the Signal Factor delays the timing trail but reduces noise. Shortening Length makes the basis more reactive. ATR periods change how sensitive each Supertrend pass is to volatility.

SmartFlow Trend Engine SmartFlow Trend Engine (STE) is a premium trend-strength model designed for intraday & positional traders who want a cleaner, faster way to identify market direction without relying on lagging indicators.
Instead of using moving averages, oscillators, or traditional momentum tools, STE uses a proprietary flow-based algorithm that tracks how efficiently price is moving through the session.
The result is a real-time trend score that instantly tells you whether the market is dominated by buyers or sellers.
What SmartFlow helps you do
✔ Identify trend continuation early
✔ Spot weak or fading trends before price reverses
✔ Stay aligned with market direction (great for option sellers)
✔ Avoid chop zones by confirming whether the day has real strength
✔ Gain confidence during volatile intraday movement
How to use (Simple Rules)
✔ Green background → Strong positive flow (bullish pressure)
✔ Red background → Negative flow (bearish pressure)
✔ TrendScore line gives additional clarity on momentum strength
✔ Works beautifully on index options, futures, and stocks
Best for
✔ BankNifty / Nifty option sellers
✔ Positional traders
✔ Intraday scalpers
✔ Index futures traders
✔ Anyone who needs a simple, reliable trend confirmation tool
Protected Algorithm (Invite-Only Script)
SmartFlow Trend Engine uses a protected calculation model designed exclusively for invite-only users.
The underlying logic is not based on common indicators, making it extremely difficult to reverse-engineer and ensuring premium value for subscribers.

APEX TREND: Macro & Hard Stop SystemAPEX TREND: Macro & Hard Stop System
The APEX TREND System is a composite trend-following strategy engineered to solve the "Whipsaw" problem inherent in standard breakout systems. It orchestrates four distinct technical theories—Macro Trend Filtering, Volatility Squeeze, Momentum, and Volatility Stop-Loss—into a single, hierarchical decision-making engine.
This script is not merely a collection of indicators; it is a rules-based trading system designed for Swing Traders (Day/Week timeframes) who aim to capture major trend extensions while strictly managing downside risk through a "Hard Stop" mechanism.
🧠 Underlying Concepts & Originality
Many trend indicators fail because they treat all price movements equally. The APEX TREND differentiates itself by applying an "Institutional Filter" logic derived from classic Dow Theory and Modern Volatility Analysis.
1. The Macro Hard Stop (The 200 EMA Logic)
Origin: Based on the institutional mandate that “Nothing good happens below the 200-day moving average.”
Function: Unlike standard super trends that flip constantly in sideways markets, this system integrates a 200-period Exponential Moving Average (EMA) as a non-negotiable "Hard Stop."
Synergy: This acts as the primary gatekeeper. Even if the volatility engine signals a "Buy," the system suppresses the signal if the price is below the Macro Baseline, effectively filtering out counter-trend traps.
2. The Volatility Engine (Squeeze Theory)
Origin: Derived from John Carter’s TTM Squeeze concept.
Function: The script identifies periods where Bollinger Bands (Standard Deviation) contract inside Keltner Channels (ATR). This indicates a period of potential energy build-up.
Synergy: The system only triggers an entry when this energy is released (Breakout) AND coincides with Linear Regression Momentum, ensuring the breakout is genuine.
3. Anti-Chop Filter (ADX Integration)
Origin: J. Welles Wilder’s Directional Movement Theory.
Function: A common failure point for trend systems is low-volatility chop. This script utilizes the Average Directional Index (ADX).
Synergy: If the ADX is below the threshold (Default: 20), the market is deemed "Choppy." The script visually represents this by painting candles GRAY, signaling a "No-Trade Zone" regardless of price action.
4. The "Run Trend" Stop Loss (Factor 4.0 ATR)
Origin: Adapted from the Turtle Trading rules regarding volatility-based stops.
Function: Standard Trailing Stops (usually Factor 3.0) are too tight for crypto or volatile equities on daily timeframes.
Optimization: This system employs a wider ATR Multiplier of 4.0. This allows the asset to fluctuate naturally within a trend without triggering a premature exit, maximizing the "Run Trend" potential.
🛠 How It Works (The Algorithm)
The script processes data in a specific order to generate a signal:
Check Macro Trend: Is Price > EMA 200? (If No, Longs are disabled).
Check Volatility: Is ADX > 20? (If No, all signals are disabled).
Check Volume: Is Current Volume > 1.2x Average Volume? (Confirmation of institutional participation).
Trigger: Has a Volatility Breakout occurred in the direction of the Macro Trend?
Execution: If ALL above are true -> Generate Signal.
🎯 Strategy Guide
1. Long Setup (Bullish)
Signal: Look for the Green "APEX LONG" Label.
Condition: The price must be ABOVE the White Line (EMA 200).
Execution: Enter at the close of the signal candle.
Stop Loss: Initial stop at the Green Trailing Line.
2. Short Setup (Bearish)
Signal: Look for the Red "APEX SHORT" Label.
Condition: The price must be BELOW the White Line (EMA 200).
Execution: Enter at the close of the signal candle.
Stop Loss: Initial stop at the Red Trailing Line.
3. Exit Rules (Crucial)
This system employs a Dual-Exit Mechanism:
Soft Exit (Profit Taking): Close the position if the price crosses the Trailing Stop Line (Green/Red line). This locks in profits during a trend reversal.
Hard Exit (Emergency): Close the position IMMEDIATELY if the price crosses the White EMA 200 Line against your trade. This prevents holding a position during a major market regime change.
⚙️ Settings
Momentum Engine: Adjust Bollinger Band/Keltner Channel lengths to tune breakout sensitivity.
Apex Filters: Toggle the EMA 200 or ADX filters on/off to adapt to different asset classes.
Risk Management: The ATR Multiplier (Default 4.0) controls the width of the trailing stop. Lower values = Tighter stops (Scalping); Higher values = Looser stops (Swing).
Disclaimer: This script is designed for trend-following on higher timeframes (4H, 1D, 1W). Please backtest on your specific asset before live trading.

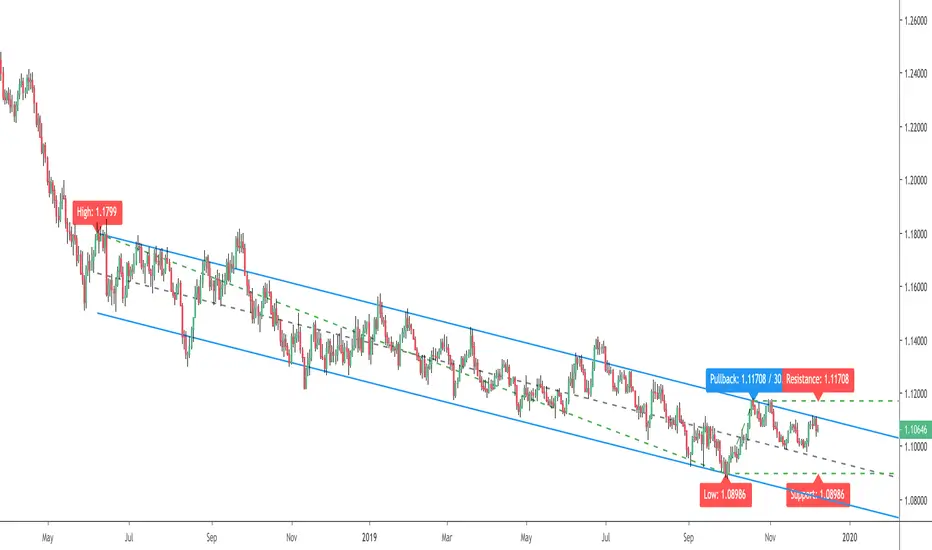
50% Fib Trend Cloud + ATR BandsThis indicator plots two structural 50% fibonacci midpoints from recent confirmed 'left/right' swings that form a *cloud* of equilibrium, then adds a rolling 50% fibonacci range midpoint based on a lookback window that's wrapped in ATR bands. Importantly, it solves a specific trading problem:
Structural midpoints (macro context) are powerful but can lag when price escapes prior ranges. Enter rolling 50% fib + ATR ➡️ which restores real-time balance & tolerance (micro context). Together they show where price is balanced structurally, where it’s balanced right now, and how much volatility to tolerate before acting.
➖➖➖
🔑 Why this is different
Most tools either draw a single midpoint (ex., daily 50%) or ATR bands around a moving average. This script fuses dual swing-based 50% midpoints (structure) + a rolling 50% with ATR (flow), so you don’t lose context when price escapes prior ranges. The cloud tells you who’s in control (fast vs. slow structure). The rolling 50% + ATR tells you how far is “too far” now.
➖➖➖
🧠 What it does (at a glance)
🔸Structural Equilibrium × 2 (Fib1/Fib2)
Two independent 50% midpoints formed from swing pivots (configurable Left/Right bars + optional smoothing). Their gap is the Midpoint Cloud = structural “fair value” zone.
🔸Rolling 50% + ATR Bands
A rolling highest/lowest window computes an always-current 50% rolling midpoint plot; ±ATR × length envelopes define a soft value area and over-stretch boundaries.
🔸Actionable Visuals
Optional fill between Fib1/Fib2, labels, and candle-overlay modes to instantly read regime (above both / below both / between).
🔸Smart Defaults
Timeframe-aware presets for L/R pivots & smoothing; full manual overrides available.
➖➖➖
⚙️ Calculations (plain-English)
🔸Pivot midpoints (Fib1 & Fib2):
1) Detect a swing using `Left/Right` bars
2) Take the swing’s high/low → compute 50%
3) (Optional) Smooth the line (SMA) to stabilize on noisy TFs
4) Repeat with a different sensitivity to get two distinct midpoints
🔸Rolling midpoint:
Highest High / Lowest Low over the last *N* bars → (HH + LL) / 2
🔸ATR levels:
`Upper = Rolling50 + ATR × Mult`, `Lower = Rolling50 − ATR × Mult`
(Typical: ATR length 14–21; Multipliers 2.236 for L1, 5.382 for L2)
➖➖➖
🤖 Auto-Configured Presets (with Manual Override)
💡Goal: make the midpoints “just work” on common timeframes while still letting you dial them in.
💡How Auto Presets work
When Auto Presets = ON, the script picks sensible L/R/S (Left bars / Right bars / Smoothing) for Fib Trend 1 and Fib Trend 2 based on chart timeframe.
🔸Fib 1 (fast) emphasizes *micro-structure* for quicker bias shifts.
🔸Fib 2 (slow) emphasizes *macro-structure* for anchor/bias context.
These defaults keep Fib 1 responsive without jitter and Fib 2 stable without lag.
➡️ Turn Auto Presets = OFF to take full control with the manual inputs described below.
➖➖➖
🛠 Manual Fib Midpoint Settings (when Auto = OFF)
💡Each midpoint uses three knobs:
🔸Pivot Left (L): bars to the left that must be lower/higher to qualify a swing
🔸Pivot Right (R): bars to the right that must be lower/higher to confirm the swing
🔸Smoothing (S): SMA period applied to the raw 50% midpoint (stabilizes noise)
5-Minute optimized defaults
🔸Fib Trend 1: `L21 / R5 / S55` → responsive local structure (entries/exits, re-balancing zones)
🔸Fib Trend 2: `L55 / R13 / S89` → broader structure (trend context, anchors/stops)
Timeframe guidance
🔸1m–3m: may feel a touch laggy → consider ~`L13 / R3 / S34`
🔸15m–1h: defaults remain strong → optionally ~`L34 / R8 / S89`
🔸4h+ : increase span for stability → `L89–144 / R13–21 / S144–233`
➡️ Rule of thumb: shorter L/R = faster detection, longer S = smoother line. Tune until Fib 1 captures the “active swing” and Fib 2 captures the “dominant swing” without whipsaw.
➖➖➖
🎛 Inputs (quick reference)
🔸Fib Trend 1/2: Source (High/Low/Close), Left/Right bars, Smoothing length, Show/Hide, Cloud fill toggle
🔸Rolling 50%: Lookback length, Price basis (Wicks/Close/HLC3/OHLC4), Plot scope (Full / Last N / None)
🔸ATR Bands: ATR length, Multipliers (L1/L2), Plot scope, Line width/colors
🔸Overlay & Labels: Candle overlay mode, Label padding/size, 50% centerline toggle, Plot widths
➖➖➖
🖍️ Candle Coloring & Overlay Modes
💡Purpose: make trend instantly visible on the candles and ATR levels.
1) Color Logic (dropdown)
🔸 Fib Midpoints — Colors by position of price vs. Fib 1 & Fib 2
🔸ATR Zones — Colors by which ATR zone price is in relative to the Rolling 50%
➡️ Price Reference: Choose the input used for the decision (Close, HL2, OHLC3, OHLC4).
➡️Tip: Close is crisp; HL2/OHLC variants are smoother.
2) Overlay Style (dropdown)
🔸 None — No visual change to candles
🔸 Bar Color — Uses `barcolor()` to tint built-in candles (this takes into account your Trading View settings, for instance if you have wicks set to white, they will show up as white with this setting)
🔸 PlotCandles — Draws unified custom candles (body, wick, border) with the same color for maximum clarity
💡Practical use
🔸 Pick Fib Midpoints to read structural bias at a glance (above/below/between the cloud).
🔸 Pick ATR Zones to read value vs. stretch around the Rolling 50% (mean-reversion vs. trend extension).
➖➖➖
📘 How to use
A) Trend confirmation
- Strong bullish bias when price holds above both structural mids; strong bearish when below both.
- Use the Rolling 50% + ATR as a dynamic re-entry zone: pullbacks that respect ATR(L1) often continue the prevailing trend.
B) Transition / mean reversion
- Inside the Cloud (between Fib1 & Fib2) treat behavior as neutralization/re-balancing; range tactics tend to outperform momentum plays.
- In ranges, fades near ±ATR around the rolling 50% can mark short-term edges.
C) Breakout context
- When price leaves the Cloud, the Rolling 50% keeps you anchored so price never feels “floating.” A clean hold outside ATR(L1/L2) suggests regime strength; quick re-entries hint at traps.
➖➖➖
🖼 Chart examples
➡️ Each snapshot shows how the Cloud (structure) and the Rolling 50% + ATR (flow) work together.
1) 1-Minute Downtrend – Cloud as Dynamic Ceiling
- The Cloud slopes down; pullbacks repeatedly fail under the Cloud’s underside.
- Rolling 50% (dashed mid) + ATR(L1) act as a reversion band: rallies stall near upper ATR and rotate lower.
2) 15-Minute Persistent Drift – Structure Guides, Flow Times Entries
- Long drift lower with Cloud overhead.
- Consolidations near the rolling mid resolve in the trend direction; ATR bands frame risk on each attempt.
3) 15-Minute Uptrend (BTC) – From Cloud Escape to Value Stair-Step
- After escaping the prior Cloud, rolling 50% + ATR establish a new higher value area.
- Pullbacks into ATR(L1) produce orderly stair-steps; Cloud remains supportive on deeper dips
4) 5-Minute BTC – Pullback to Value then Rotate
- Strong leg up; retrace tags lower ATR band and rotates back toward the rolling mid.
- Labels (Fib1/Fib2) make the structural context explicit for decision-making.
➖➖➖
🧪 Starter presets
- Intraday (5–15m): Fib1 ~ L21/R5 (smooth 5), Fib2 ~ L55/R13 (smooth 9) • Rolling = 55 • ATR = 14 • L1 = 2.5x, L2 = 5.0x
- Scalping: Shorten lookbacks & smoothing; keep ATR multipliers similar, or tighten L1.
- Swing: Lengthen all lookbacks; consider ATR length 21–28.
➖➖➖
🏁Final Word
This script is not just a visual tool, it’s a complete trend and structure framework. Whether you're looking for clean trend alignment, dynamic support/resistance, or early warning signs of a reversal, this system is tuned to help you react with confidence — not hindsight.
Rembember, no single indicator should be used in isolation. For best results, combine it with price action analysis, higher-timeframe context, and complementary tools like trendlines, moving averages etc Use it as part of a well-rounded trading approach to confirm setups — not to define them alone.
---
💡Turn logic into clarity. Structure into trades. And uncertainty into confidence.

Trend Pivots Profile [BigBeluga]🔵 OVERVIEW
The Trend Pivots Profile is a dynamic volume profile tool that builds profiles around pivot points to reveal where liquidity accumulates during trend shifts. When the market is in an uptrend , the indicator generates profiles at low pivots . In a downtrend , it builds them at high pivots . Each profile is constructed using lower timeframe volume data for higher resolution, making it highly precise even in limited space. A colored trendline helps traders instantly recognize the prevailing trend and anticipate which type of profile (bullish or bearish) will form.
🔵 CONCEPTS
Pivot-Driven Profiles : Profiles are only created when a new pivot forms, aligning liquidity analysis with market structure shifts.
Trend-Contextual : Profiles form at low pivots in uptrends and at high pivots in downtrends.
Lower Timeframe Data : Volume and close values are pulled from smaller timeframes to provide detailed, high-resolution profiles inside larger pivot windows.
Adaptive Bin Sizing : Bin size is automatically calculated relative to ATR, ensuring consistent precision across different markets and volatility conditions.
Point of Control (PoC) : The highest-volume level within each profile is marked with a PoC line that extends until the next pivot forms.
Trendline Visualization : A wide, semi-transparent line follows the rolling average of highs and lows, colored blue in uptrends and orange in downtrends.
🔵 FEATURES
Pivot Length Control : Adjust how far back the script looks to detect pivots (e.g., length 5 → profiles cover 10 bars after pivot).
Pivot Profile toggle :
On → draw the filled pivot profile + PoC + pivot label.
Off → hide profiles; show only PoC level (clean S/R mode).
Trend Length Filter : Smooths trendline detection to ensure reliable up/down bias.
Precise Volume Distribution : Volume is aggregated into bins, creating a smooth volume curve around the pivot range.
PoC Extension : Automatically extends the most active price level until a new pivot is confirmed.
Profile Visualization : Profiles appear as filled shapes anchored at the pivot candle, colored based on trend.
Trendline Overlay : Thick, semi-transparent trendline provides visual guidance on directional bias.
Automatic Cleanup : Old profiles are deleted once they exceed the chart’s capacity (default 25 stored profiles).
🔵 HOW TO USE
Spotting Trend Liquidity : In an uptrend, monitor profiles at low pivots to see where buyers concentrated. In downtrends, use high-pivot profiles to spot sell-side pressure.
Watch the PoC : The PoC line highlights the strongest traded level of the pivot structure—expect reactions when price retests it.
Anticipate Trend Continuation/Reversal : Use the trendline (blue = bullish, orange = bearish) together with pivot profiles to forecast directional momentum.
Combine with HTF Context : Overlay with higher timeframe structure (order blocks, liquidity zones, or FVGs) for confluence.
Fine-Tune with Inputs : Adjust Pivot Length for sensitivity and Trend Length for smoother or faster trend shifts.
🔵 CONCLUSION
The Trend Pivots Profile blends pivot-based structure with precise volume profiling. By dynamically plotting profiles on pivots aligned with the prevailing trend, highlighting PoCs, and overlaying a directional trendline, it equips traders with a clear view of liquidity clusters and directional momentum—ideal for anticipating reactions, pullbacks, or breakouts.
