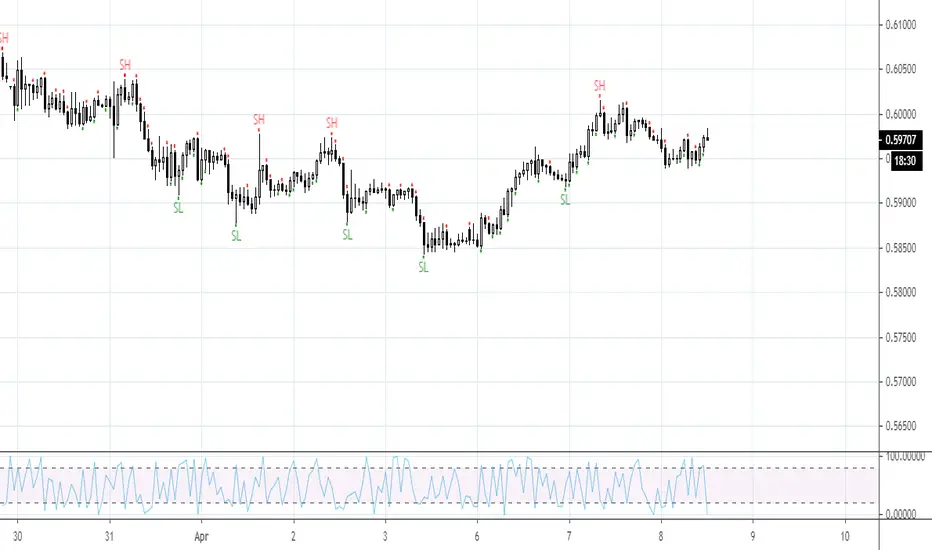
Trend FinderIdentify Chart trend using CCI/ADR and EMA patterns.
-> CCA : 20-25 will reduce noise. Modify it based on your need.
Cerca negli script per "trend"

Trend BarsIndicated by the red and green boxes above/below the candlesticks, this indicator shows any candlestick with a candle body GREATER than 50% of the entire range of the candle (from high to low). For example, a red box above a candlestick indicates that this particular candle has a body greater than 50% of the entire range of the candle in a bearish direction. This can be used as confirmation of a bearish trend or reversal in a bearish direction.
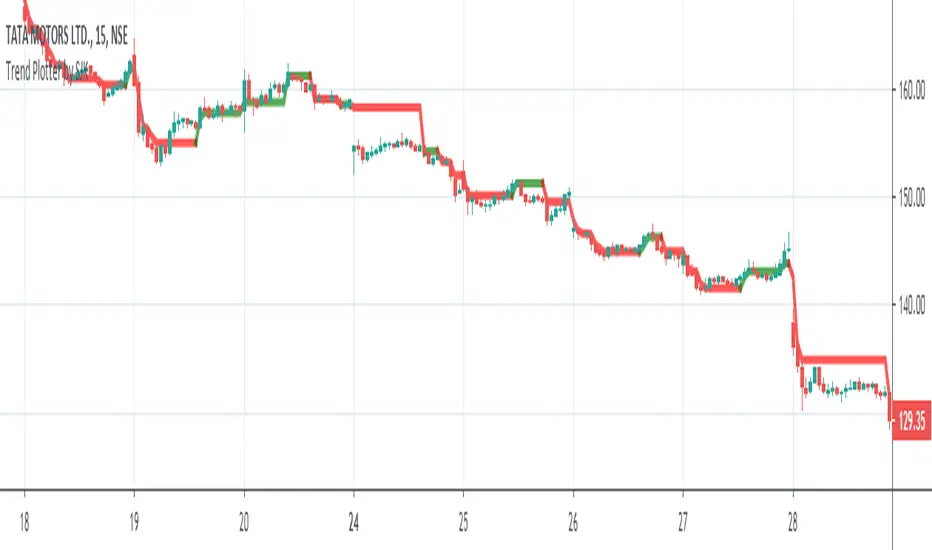
Trend Plotter by SJKThe script is on construction phase, but still can be used. This is a trend plotter based on ATR. Use a minimum time frame of 15 minutes. Wont work satisfactorily below that. Optimum is 30 minutes. Go short when the stock is under 200 day MA and go long when the stock is above 200 day MA. No buy or sell signal added, but can be used based on the color of the line plotted.
NiftyAnalysis - TrendLinesTrend Lines with various timeframes, beginning 15min to monthly.
It doesn't change with the chart layout TF.

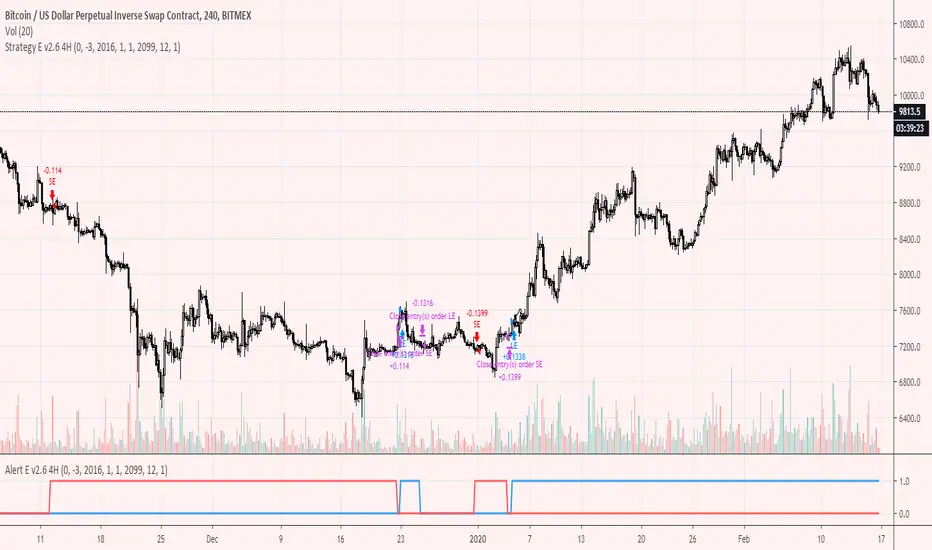
Trend-following Alert E v2.6 4HHi All,
Welcome to my second published Trend-following strategy for bitcoin , designed specifically for BITMEX:XBTUSD on 4H
This is an extension of my first script but then for the 4H timeframe.
This script is the Alert script to use for settings up Alerts on Tradingview.
The accompanying strategy script and explanations/caveats you can find here:
In this script you will find the "active_long" and "active_long" variables (red and blue lines) that show which positions are being taken by the strategy script.
You can set 'Once per bar close' alerts for this to get your alerts on TV.
For instance, I use 'crossing up @ 0.1' on "active_long" to set an 'Open Long" alert and a 'crossing down @ 0.9' to set a 'Close Long' alert.
The same holds for the 'Open Short' and the 'Close Short' alerts but then for the 'active_short' variable.
I've also added start and end dates to test specific time periods.
Please let me know if you have any questions.
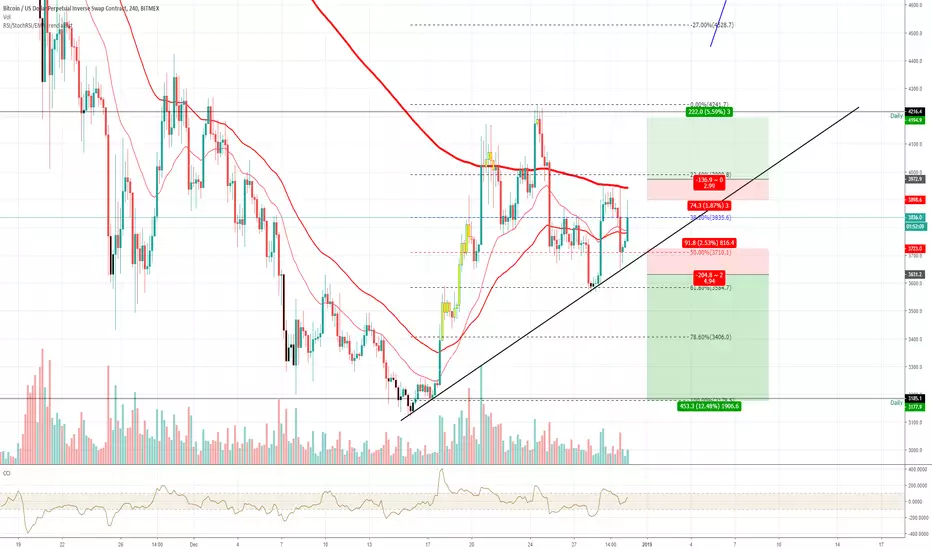
Trend-following Alert E v2.6Hi All,
Welcome to my first published Trend-following strategy for bitcoin , designed specifically for BITMEX:XBTUSD.
This script is the Alert script to use for settings up Alerts on Tradingview.
The accompanying strategy script and explanations/caveats you can find here:
In this script you will find the "active_long" and "active_long" variables (red and blue lines) that show which positions are being taken by the strategy script.
You can set 'Once per bar close' alerts for this to get your alerts on TV.
For instance, I use 'crossing up @ 0.1' on "active_long" to set an 'Open Long" alert and a 'crossing down @ 0.9' to set a 'Close Long' alert.
The same holds for the 'Open Short' and the 'Close Short' alerts but then for the 'active_short' variable.
Please let me know if you have any questions.

easyTrend V2.0 - Easy Trendtrend analysis with color trend line
*green as up trend
*red as down trend
and signal(V character in chart) for resistance ,
plus signal for trend reverse (A character in chart)

Trend folower (4H)Basic trend following strategy based on weiswave combined with two custom filters. Shows consistent profits with limited drawdowns from 2015-2020 on BTCUSD.

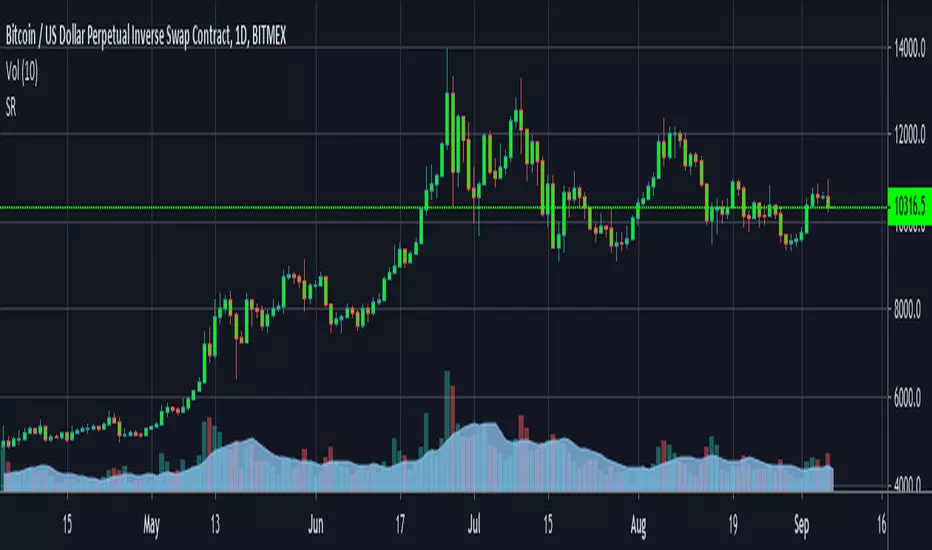
Trend SR basedworks well on XBTBTC 1D
uses support and resistance zones breakout as trendpoints
need volume for clear down/up trend
orange = down trend starting
red = down trend
white = up trend starting
green = up trend
inspired by cryptozyzz's zyzz script
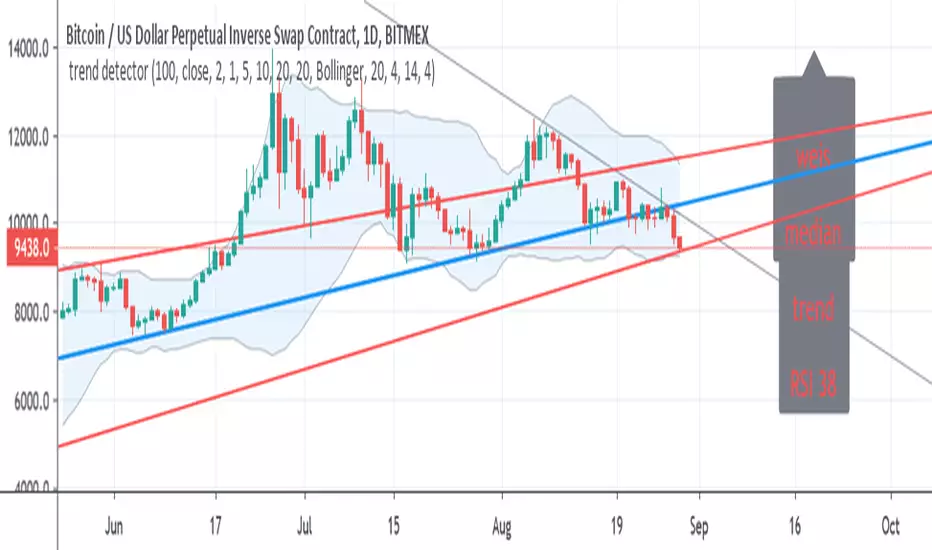
trend detectorThis is just template to build up better indicator on it
So in basic we have modified trend SMA which is fast length 10 to detect fast changes
then we weis volume (done by lazy bear)
Bollinger channel with my addition of trend lines
the median is based on basis line of the channel
so good long entry spot are when trend is positive , weis positive and rsi bellow 45 and the candles bellow median
good exit is opposite
one can can add more indicators to make it better
so I just put this together since in my trading I use this indicators allot


Trading Temple Trend Tracker LONG v3Trend trading strategy for higher timeframes (mostly 3D to W), will give signals / alerts for when the trend is changing. Older versions are abandoned & incomplete.


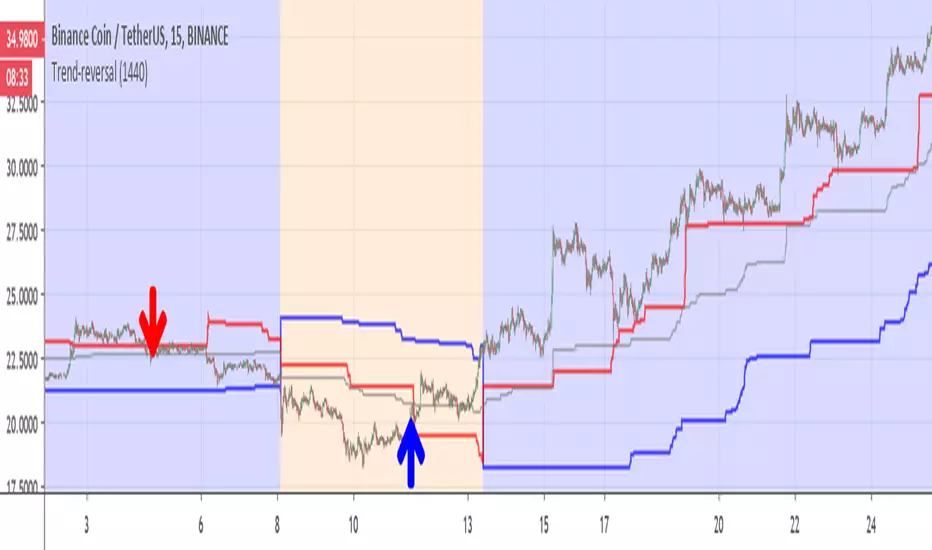
Trend-reversalThis indicator is for detection of trend reversal based on trailing stop (blue line)
the Bullish zone is in blue (red above blue line), bearish zone in orange ( blue line above red line)
gray line is the average of donchian channel
I put the line on 1440 min (so it like daily trailing line) , you can make it shorter if you want .
In this example of BNB coin we see in red arrow that the coin drop from red line so it loosing power -here it sell point during bullish period(blue)
on the other hand when we are in bearish (orange), we can see that the coin is breaking the red line -buy point and the trend is reverse
main script is taken from ceyhun so credit is to him on this
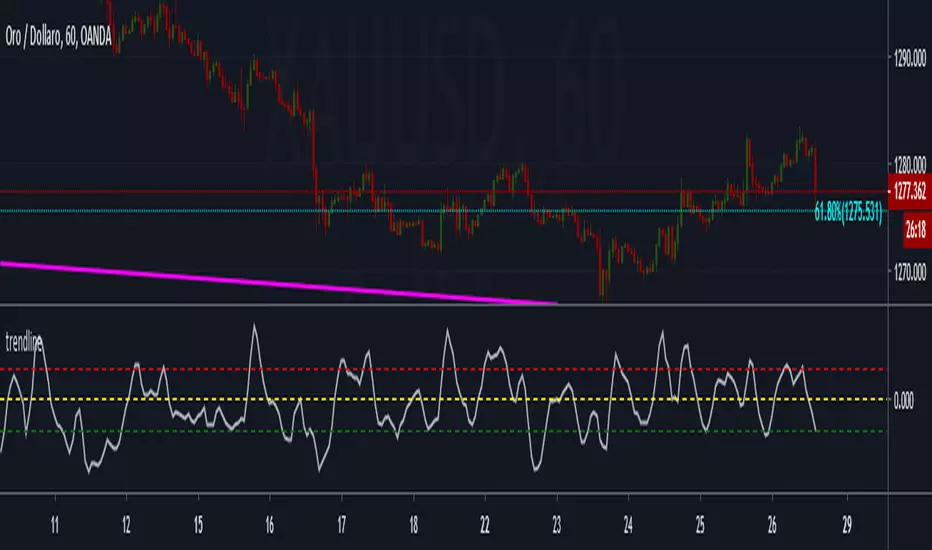
trendlineoscillatore che misura il trend : avvisa del possibile cambio di tendenza sugli estremi selltrend e buytrend e conferma la tendenza sulla
linea dello zero confirm_trend
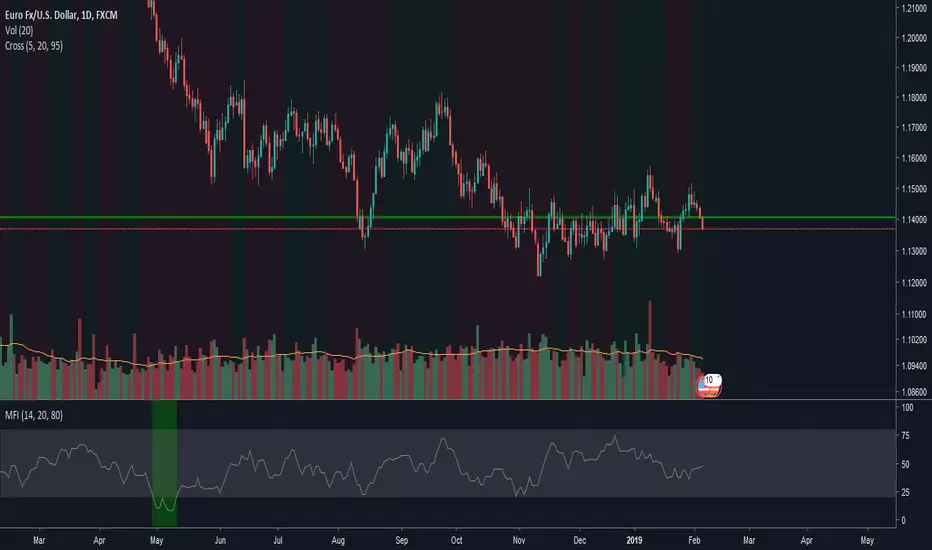
trend highlighterhighlights green when fast ma is higher than slow ma (default 5/20) and red otherwise. useful for seeing trends at a glance
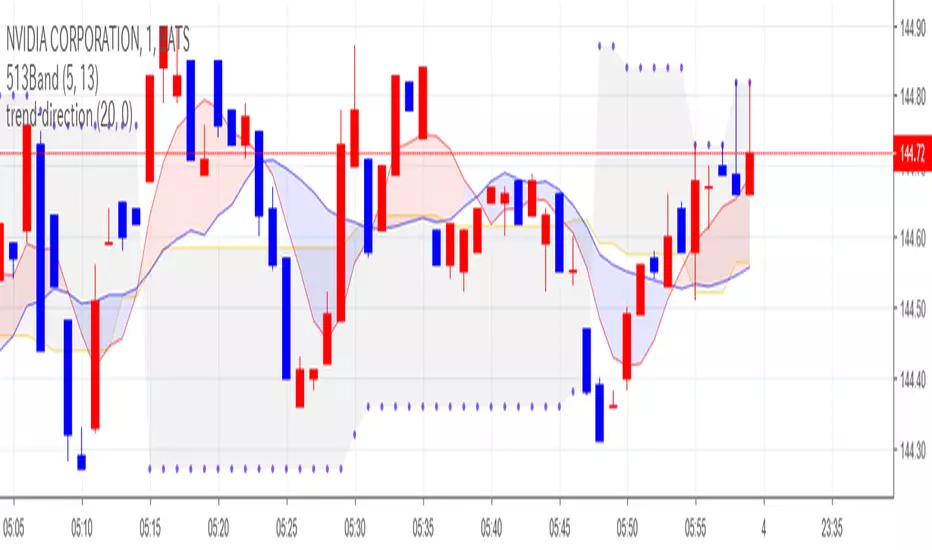
trend-direction-fi01This is an indicator to check the range period and trend occurrence period.
When the closing price is within the "net", judgment is made as the range, and where I left the "net" it is recognized as a trend occurrence.
In addition, it is also possible to check multiple entry timing with this indicator.
This indicator can be used in any market.
RSI/StochRSI/EMA trend assist updated- Trend determined by the crossover of the 4hr 13 and 26 EMA's (or whatever you set the Short and Mid term EMA to) All settings customisable in the 'cog' wheel of the indicator in the top right of the screen.
- Oversold conditions ( Stoch RSI and RSI ) are shown with a black candle
- Black candle = Potential long WITH the trend
- Black candle and small green circle below = Potential long AGAINST the trend (used better as a warning to watch trade in case exit required.)
- Overbought Conditions ( Stoch RSI and RSI ) are shown with a yellow candle
- Yellow candle = Potential short WITH the trend
- Yellow candle with small red circle above = Potential short AGAINST the trend (used better as a warning to watch trade in case exit required.)
Best used to confirm your TA and provide additional confirmation on market conditions. (not as a standalone buy sell indicator)
I've found it useful for keeping my head right by showing me clearly the trend on the larger timeframes and keeping me out of the market until I see conditions that meet my entry criteria. Backtesting seems to show good results on the 1hr (default settings)
Trend-Two-line trade-timeIt is an indicator that uses two lines and shows the trend occurrence period and the range period.
We set it so that you can catch the trend early by moving several minutes earlier.
This indicator is based on original calculation and it is suitable for any market.

trend-direction trade-timeThis is an indicator to check the range period and trend occurrence period.
When the closing price is within the "net", judgment is made as the range, and where I left the "net" it is recognized as a trend occurrence.
In addition, it is also possible to check multiple entry timing with this indicator.
This indicator can be used in any market.
