Ichimoku Anchor EntriesThis is an ichimoku MTF entries based on baseline and MA
Requested by user Yusufali
Cerca negli script per "ichimoku"
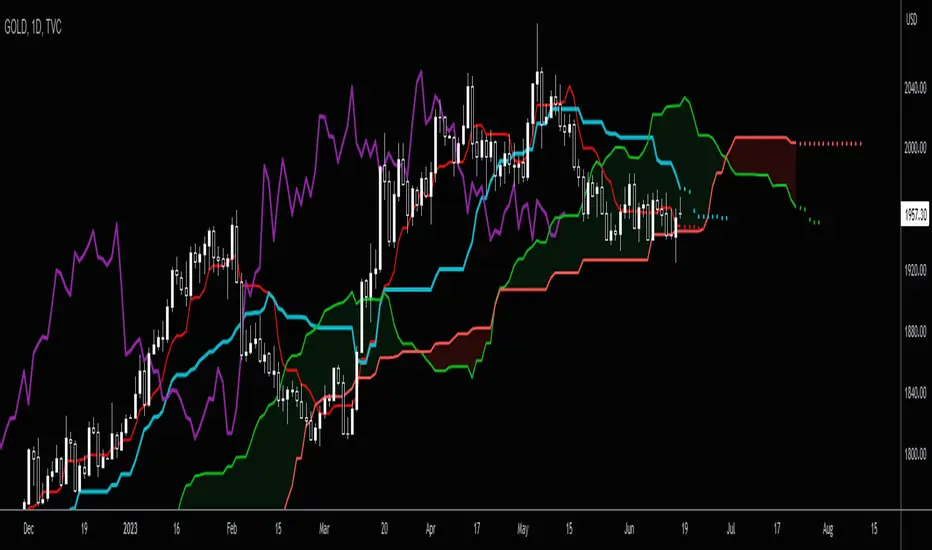
ICHIMOKU MTFMultiple Time Frame Version of Ichimoku Kinko Hyo Indicator.
Created in 1940's by Goichi Hosoda withe the help of University students in Japan.
Ichimoku is one of the best trend following indicators that works nearly perfect in all markets and time frames.
Ichimoku is originally an built in indicator in Tradingview but there are some problems like:
the indicator hast 5 lines but you can change only 4 parameters in the settings menu of Tradingview Charts which you could only control 3 of the lines effectively. A second problem is that Tradingview preferred to use English titles for the ICHIMOKU lines instead of giving them the most common original Japanese ones. (So I rewrite the indicator)
Kijun Sen (blue line): Also called standard line or base line, this is calculated by averaging the highest high and the lowest low for the past 26 periods.
Tenkan Sen (red line): This is also known as the turning line and is derived by averaging the highest high and the lowest low for the past nine periods.
Chikou Span (Plum line): This is called the lagging line. It is today’s closing price plotted 26 periods behind.
Senkou SpanA (green line): The first Senkou line is calculated by averaging the Tenkan Sen and the Kijun Sen and plotted 26 periods ahead.
Senkou SpanB (purple line):
The second Senkou line is determined by averaging the highest high and the lowest low for the past 52 periods and plotted 26 periods ahead.
PERSONALLY I ADVISE YOU TO USE ICHIMOKU WITH DEAFULT LENGTHS (9,26,26,52,26) IN ORDER FOR STOCK MARKETS AND FOREX MARKETS
FOR CRYPTO YOU'D BETTER USE:
10,30,30,60,30 OR 20,60,60,120,60
THE TRICKY THING IS THAT KEEPING THE 1-3-3-6-3 RATIO CONSTANT IS NECESSARY
Here's a link of my Youtube video explaining ICHIMOKU but unfortunately only in TURKISH:
www.youtube.com
Developed by: Goichi Hosoda
Here's the link to a complete list of all my indicators:
tr.tradingview.com
Ichimoku kullanımı anlattığım detaylı video serisini linkten izleyebilirsiniz:
www.youtube.com
İndikatörü geliştiren: Goichi Hosoda

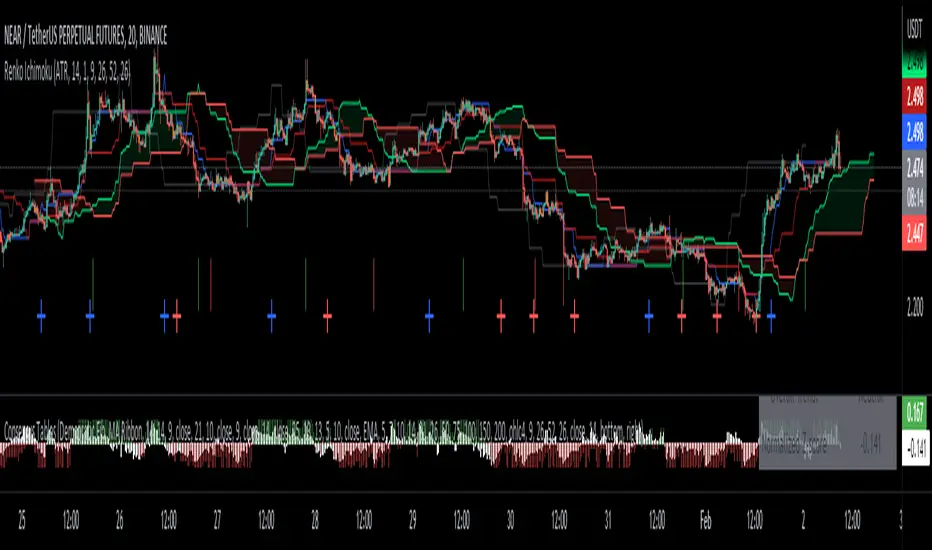
Renko Ichimoku CloudThis script utilizes its source from a non-repainting renko closing price. Renko charts focus solely on price movement and minimize the impacts of time and the extra noise time creates. Employing the renko close helps smooth out the Ichimoku Cloud. Insignificant price movements will not cause a change in the plotted lines of the indicator unless a new threshold is breached or a "brick" is created.
This Ichmoku Cloud includes all standard lines with standard lengths. These include:
Tenken Sen
Kiju Sen
Senkou A/B
Chikou Span
We have also included plotted marks for when there is a Tenken Sen/ Kiju Sen cross and for the Kumo cloud twist.
There are two methods for selecting the box size. Box size is critical for the overall function and efficacy of the plots you will visually see with this indicator. Box size is set automatically using the Average True Range "ATR" or manually using the "Traditional" setting. The simplest way to determine a manual box six is to take the ATR of the given instrument and round it to the nearest decimal place. As an example, if the ATR for the asset is 0.017, you would round that number to 0.02 and utilize this as your traditional box size.
Ichimoku Cloud and ADX with Trailing Stop Loss (by Coinrule)The Ichimoku Cloud is a collection of technical indicators that show support and resistance levels, as well as momentum and trend direction. It does this by taking multiple averages and plotting them on a chart. It also uses these figures to compute a “cloud” that attempts to forecast where the price may find support or resistance in the future.
The Ichimoku Cloud was developed by Goichi Hosoda, a Japanese journalist, and published in the late 1960s. It provides more data points than the standard candlestick chart. While it seems complicated at first glance, those familiar with how to read the charts often find it easy to understand with well-defined trading signals.
The Ichimoku Cloud is composed of five lines or calculations, two of which comprise a cloud where the difference between the two lines is shaded in.
The lines include a nine-period average, a 26-period average, an average of those two averages, a 52-period average, and a lagging closing price line.
The cloud is a key part of the indicator. When the price is below the cloud, the trend is down. When the price is above the cloud, the trend is up.
The above trend signals are strengthened if the cloud is moving in the same direction as the price. For example, during an uptrend, the top of the cloud is moving up, or during a downtrend, the bottom of the cloud is moving down.
DMI is simple to interpret. When +DI > - DI, it means the price is trending up. On the other hand, when -DI > +DI , the trend is weak or moving on the downside. The ADX does not give an indication about the direction but about the strength of the trend.
Typically values of ADX above 25 mean that the trend is steeply moving up or down, based on the -DI and +D positioning. This script aims to capture swings in the DMI, and thus, in the trend of the asset, using a contrarian approach.
Trading on high values of ADX, the strategy tries to spot extremely oversold and overbought conditions. Values of ADX above 45 may suggest that the trend has overextended and is may be about to reverse.
This strategy combines the Ichimoku Cloud with the ADX indicator to better enter trades.
Long orders are placed when these basic signals are triggered.
Long Position:
Tenkan-Sen is above the Kijun-Sen
Chikou-Span is above the close of 26 bars ago
Close is above the Kumo Cloud
MACD line crosses over the signal line
-DI is greater than +DI
ADX is greater than 45
Close Position:
3% increase trailing
3% decrease trailing
The script is backtested from 1 January 2018 and provides good returns.
The strategy assumes each order is using 30% of the available coins to make the results more realistic and to simulate you only ran this strategy on 30% of your holdings. A trading fee of 0.1% is also taken into account and is aligned to the base fee applied on Binance.
This script also works well on MATIC (1d timeframe), ETH (1d timeframe), and SOL (1d timeframe).

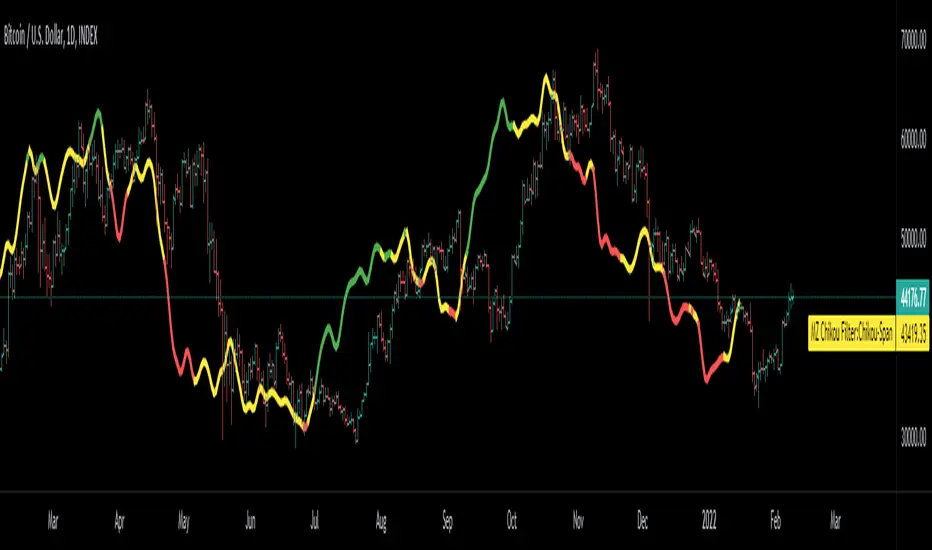
Chikou Filter for Ichimoku CloudThis Indicator enhances functionality of Chikou-Span from Ichimoku Cloud using a simple trend filter.
Methodology
Chikou is basically close value of ticker offset to close and it is a good for indicating if close value has crossed potential Support/Resistance zone from past. Chikou is usually used with 26 period.
Chikou filter uses a lookback length calculated from provided lookback percentage and checks if trend was bullish or bearish within that lookback period.
Bullish : Trend is bullish if Chikou span is above high values of all candles within defined lookback period. Green color shows bullish trend.
Bearish: Trend is bearish if Chikou span is below low values of all candles within defined lookback period. This is indicated by red color.
Reversal / Choppiness : White color indicates that Chikou are swinging around candles within defined lookback period which is an indication of consolidation or trend reversal.
Default Settings
Different source types are included but I've found that (OHLC4+High+Low)/3 is better for Chikou and Symmetrically Weighted Moving Average (SWMA) is also applied but it produce some repainting though. Default period is set to 26 and lookback percentage is 50%. Low percentage would decrease filter's efficiency.
Usage
This filter can be used to check if Chikou crossover has occurred in past. This can be used with Donchain channels, Bollinger Bands or any Moving Average as replacement of High / Low values. I'll use this indicator in all my Ichimoku Cloud studies especially adaptive ones. Filter outputs in Color and Integer format; both can be used as signals definitions.
Ichimoku Cloud OscillatorThis script shows Ichimoku values in a different manner. While studying Ichimoku one thing stuck out to me and that is that the Kijun-Sen line is considered to be the equilibrium of the market, it acts like a magnet and price always returns to it. Taking this into account I made a script that plots the distance from equilibrium as an oscillator.
With that value being an oscillator it allows for some analysis that would have been harder to do looking at the normal ichimoku chart. For example smoothing the value and comparing the distance to the average distance to see if the market reached an extremity (too far from equilibrium). I added a bollinger band for those who are interested in analysing the value in that way but in my experience I do not use it except for noticing if market spiked outside of the band (green and red dots).
It is advised to use this oscillator as a trend analysis tool the same way you would use a money flow. Below a breakdown of current features
- Disequilibrium1: The white sharp wave is the raw distance from Kijun with settings to smooth it out using a WMA
- Disequilibrium2: The blue smooth wave is the smooth distance from Kijun with settings to smooth it further out using a WMA
- Yellow line: The distance of Tenkan-Sen from Kijun-Sen which in alot of ichimoku strategys act as a trend filter or a crossover as market change.
- Green and red zone: The slope of the kumo cloud, color coded to see if kumo is red or green. Use it in the same way you would use money flow on market cypher, it is a longer term trend strength indicator and like all smoothed values it lags behind. You can use this to decide which direction to trade in but not as a signal on it's own.
- Bollinger Band: Acts the same way a bollinger band does, use this to analyse the wave structure, especialy the middle line the same way you would use Disequilibrium2, if the waves are a good distance from this line market can be overbought oversold or it is just a good indication that the trend is strong. Outer bands should be your warning bands as the waves tend to jump back to the middle line when touching those.
Would love some feedback on this as I do not think this can be used for divergences but would like to hear some possible patterns/strategys.
My current strategy is noticing an increasing wave after a squeeze (waves keep getting smaller untill a large trend happens, wave no longer goes to middle and keeps expanding). When I notice this I wait for the white wave to enter the blue and touch the mid bollinger line (small pullback during strong trend) and open a trade in the direction of the trend. I use the green and red zone to decide if the long term direction tells the same to get confluence.

Future Ichimoku LinesFuture Ichimoku Lines Plot: Tenkan-sen next 5 days, Kijun-sen next 10 days, Kumo A next 5 days and Kumo B next 14 days will be display
This will help you forecast the future of price and increase winning probability!
Always remember, risk management is the key of a successful trader
Have a nice trade! :D
Ichimoku Kinko Hyo Cloud - no offset - no repaint - strategyIchimoku Kinko Hyo Cloud - no offset - no repaint - RSI filter - strategy
The indicator contains both the standard Ichimoku Cloud , as well as the one without the visual offset.
The Strategy Tester indicates good backtest results when the Ichimoku Cloud is paired with the RSI .
However, it seems it likes to work more as a standalone system.
The indicator can be easily converted to the study() mode by commenting/uncommenting a few lines,
then the alarms can be configured.
There are entry and exit signals ready to be used by the alert system.
The coloring of the cloud without offset contains all 3 conditions: Uptrend , Downtrend , Transition .

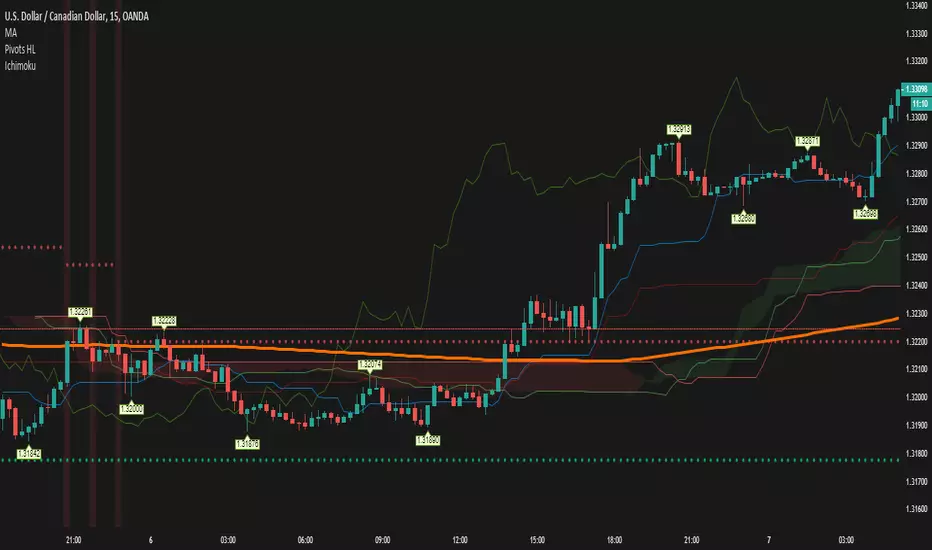
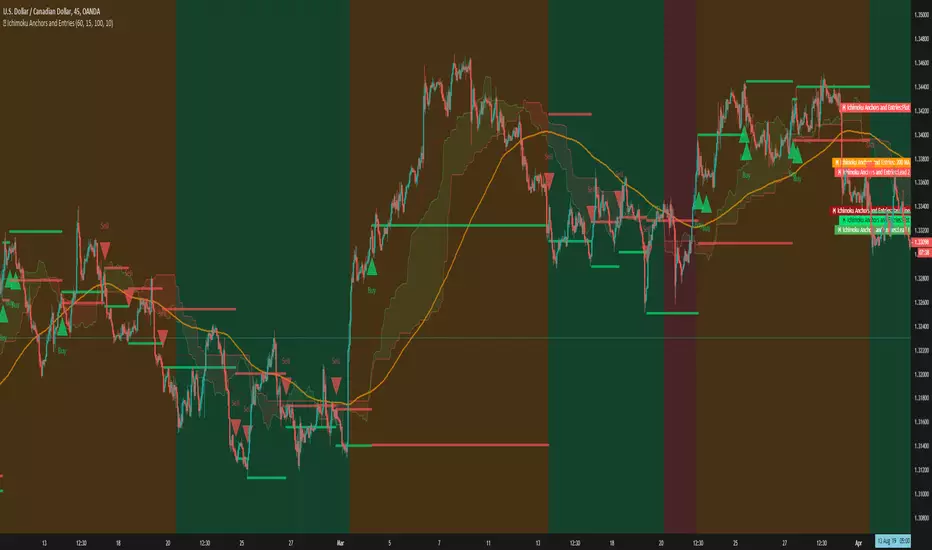
Ichimoku Anchors and EntriesThis is an ichimoku scalper that makes trades based off anchor and signal time frames
There consist of 3 types of trades
Weak, Medium and Strong
Red represents weak entries
Medium is represented by orange
And Green is the strong Entries

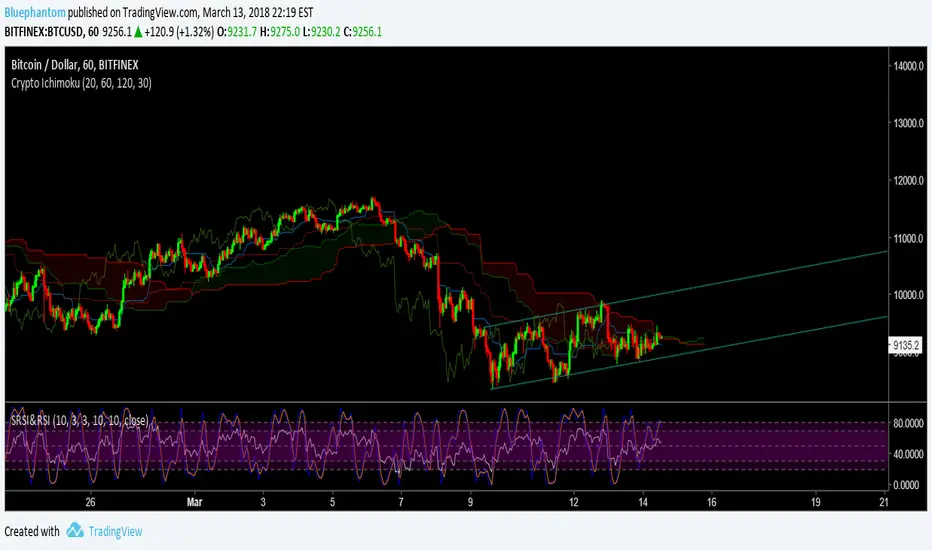
Crypto Ichimoku by BluephantomAs Cryptocurrencies are a 24/7 market I've created a cryptocurrency version of the Ichimoku.
I haven't made any major changes to how the ichimoku works.
Default settings are (20,60,120,30);
you can also try (10,30,60,30).
If you find my Scripts useful and would like to donate:
BTC:
3DVzwAggm2PuQ9y3ENxB8UWe5Sij7L55Nz
LTC:
MDTsyKDp9eshASbMvcwXFM2MRNBDEBbXiA
Ichimoku Kinko Hyo + HULL-MA_X + MacDThe Ichimoku Kinko Hyo system includes five kinds of signal, of which this strategy uses the most recent of ones i.e. Tenkan Sen / Kijun Sen Cross and price crosses the Kijun Sen. As the Chikou Span, Senkou Span A and Senkou Span B are shifted into the past/future, the trigger signals will be only be used for visual confirmation and not part of the strategy.
The Tenkan Sen, also known as the Turning or Conversion line, is a moving average of the highest high and lowest low over the last 9 periods in this strategy.
The Kijun Sen, also known as the Standard or Base line, is a moving average of the highest high and lowest low over the last 24 periods in this strategy.
The Chikou Span, also known as the Lagging line, is the closing price plotted 24 periods behind in this strategy.
The Senkou Span A, also known as the 1st leading line, is a moving average of the Tenkan Sen and Kijun Sen and is plotted 24 periods ahead in this strategy.
The Senkou Span B, also known as the 2nd leading line, is a moving average of the highest high and lowest low over the last 51 trading days is plotted 24 periods ahead in this strategy.
Moving average convergence divergence (MaCD) is a trend-following momentum indicator that shows the relationship between two moving averages of prices. The MaCD is calculated in this strategy by subtracting the 24-day exponential moving average (EMA) from the 12-day EMA. A nine-day EMA of the MACD, called the "signal line", aMaCD in this case, is then plotted on top of the MaCD. In this strategy, MaCD/ aMaCD Cross is functioning as a trigger for buy and sell signals.
As with most technical analysis methods, Ichimoku is likely to produce frequent conflicting signals in non-trending markets, So in addition to Ichimoku Kinko Hyo, the Hull MA is popular amongst some day traders, as the indicator which in combination with MaCD attempts to give an accurate signal by eliminating lags and improving the smoothness of the line.
Alan Hull, developed this moving average indicator and hence it’s called the Hull MA.
Now, let’s dissect how the Hull moving average is calculated.
The Hull MA involves the weighted moving average (WMA) in its calculation.
First, calculate the WMA with period (n / 2) and multiply this by 2. Remember ‘n’ is the time period configurable based on the trader’s requirement. The default setting is 12 periods in this strategy, fast Hull MA crossing slow Hull MA will generate a circle on charts.
Second, calculate the WMA for period “n” and subtract if from the first step. Thirdly, calculate the weighted moving average with period sqrt (n) using the data from the second step. You can take a look at the below formula:
Hull MA= WMA (2*WMA (n/2) − WMA (n)), sqrt (n))
The Hull MA Cross in combination with Tenkan Sen / Kijun Sen Cross and MaCD tries to give an accurate signal by eliminating lags and improve the smoothness of price activity. Please note that price trends can and do change often, so your readings of the charts and this trading system should be probabilistic, rather than predictive.

Simple Ichimoku Kinko Hyo Cloud█ OVERVIEW
This indicator as an educational and showcase the usage of user-defined types or objects (UDT) for Ichimoku Kinko Hyo or Ichimoku Cloud.
█ CREDITS
TradingView

Volume Spread Analysis IchimokuThis version of the popular Ichimoku indicator is modified to let the user choose between his classic mode and the volume-weighted mode.
Every line of the indicator is customizable with this function.
The Kijun and Tenkan lines are choosable from:
1. The normal version, so the average of the high and the low of the selected period
2. The volume mode, so the average price of the selected input ponderated to the volume
The Senkau Span A is the average from the Kijun (fast line) and the Tenkan (slow line) lines and it's choosable from:
1. The normal price version
2. The volume mode
3. The average between points 1 and 2
4. The automatic average between the two fast lines that you've chosen
The Senkau Span B is the slowest line of the indicator, used to determine the long-term trend, and can be chosen from:
1. The normal average price between the high and the low of the selected period
2. The volume average price, using the Volume Weighted Moving Average
The Trama Backline is the popular "LUX Algo" T.R.A.M.A. indicator, which I'm thankful for, and can be fantastically used to display the current trend strength and condition. This line is readable in the following way:
- If the line is moving sideways, the trend may be in a consolidation phase
- If the line is moving upwards or downwards, the trend may be in a trend phase

Ichimoku VariationsThe Ichimoku cloud is traditionally constructed from the highest high and lowest low for a number of periods. This script allows for it to be transformed and calculated like more traditional moving averages (e.g. simple moving average, exponential moving average). Since the Ichimoku is normally a system of moving average-like lines, maybe someone out there will learn something from being able to switch to sma, ema, etc etc.
In general, I think no TA indicator is a magic bullet, and you should just use what you like!
Credit: This script utilizes the "Color Gradient Framework" tutorial by LucF (PineCoders) to create gradient visuals, which are also customizable for the user.
Recommended modes:
default
SMA
EMA
SMMA
WMA
VWMA
Tillson T3
Not Recommended (These moving averages are too fast, and probably will require adjusting settings to something like the 20-60-120-30 to make more sense):
HMA
EHMA
TEMA
ALMA
LSMA

MTF Ichimoku Signal [Takazudo]A multi timeframe Ichimoku Signal indicator. This indicator shows the status of each Ichimoku Signals.
1. TK-Cross
Tenkan-Sen & Kijun-Sen cross status
2. Future Kumo
The newest Kumo color
3. Kumo & Current Relation
The relation between current price & Kumo.
4. Kumo & Chikou-Span Relation
The relation between Kumo & Chikou-Span.
5. Chikou-Span & Candle Cross
Chikou-Span & Candle cross status

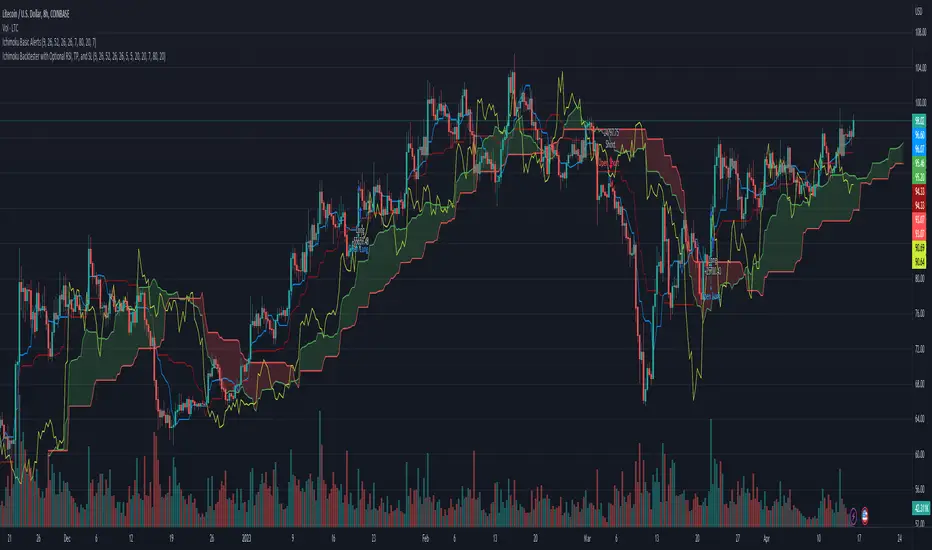
Ichimoku Backtester with TP, SL, and Cloud Confirmation OptionStarted with the Basic Ichimoku strategy from Mizuki32. Added Take Profit, Stop Loss (for both long and short), and a toggle to wait for confirmation from the cloud.
Adaptive IchimokuThis is part 10 of 11 in the system named Ninetales/Volt V2 you can find on Tradingview.
No. You may not add custom values, testing all the variables of Ichimoku is a giant pita. You can uncheck ones you dont like though.

Ichimoku Kinko Hyo (colorblind friendly)This is the Ichimoku Kinko Hyo indicator, using colorblind friendly colors as much as possible so that every line or cloud trend can be identified more easily. It is correctly visible both in bright and dark mode.
Note: I have only tested the visibility on myself (I'm deuter), if anyone with another kind of colorblindness has issues distinguishing lines, I'll happily take any suggestion to improve this script.

13/21 EMA + Ichimoku Kinko Hyo StrategyThis trading strategy uses combination of the Ichimoku Kinko Hyo system with Fibonacci numbers based 13/21 exponential moving average ( EMA ) crossover, giving excellent results in trending assets !

EMA + Ichimoku Kinko Hyo StrategyThis trading strategy uses combination of the Ichimoku Kinko Hyo system with Fibonacci numbers based exponential moving average(EMA) and RSI 12/24 crossover, giving excellent results in trending stocks !

Ichimoku Time RetracementThis is educational tool for understand pullback measurement .
Price pullback and Time pullback is basic concept for ichimoku.
I change parameters to understand relationship of each line easily and add lines .
Enjoy!!

Ichimoku 2 sets of settings, markers and alertsThis is my take on the masterful, beautiful and powerful Ichimoku.
It comes with:
- 2 sets of settings you can flip between,
- 5 types of markers:
--- Tenkan/Kijun crosses,
--- Price (close)/Tenkan crosses, with the option of only showing those occurring with the trend, so on pullbacks,
--- Price (close) exits out of the Kumo,
--- Chikou exits out of the Kumo,
--- Overbought/Oversold conditions (shown on the chart).
- Choice of showing only long or short markers,
- Coloring of bars using OB/OS conditions,
- Alerts on all markers and on combinations.
The markers are intended as indications—not bulletproof buy/sell signals.
The overbought/oversold conditions are detected when the high/low is a multiple of ATR away from Kijun. The ATR length and multiple used are configurable.
I normally use the Josh Olszewicz (CarpeNoctom) big settings, so those are the default.
I prefer subtle coloring on charts and my choice of colors reflects that.
You will see references to KumoA and KumoB in the names of inputs and style elements. For me, KumoA is the top of the Kumo when it is bullish, so the bottom when bearish.
As usual when creating alerts, be sure you already have defined proper inputs and that you are on the intended interval, as they will be used when triggering alerts.
