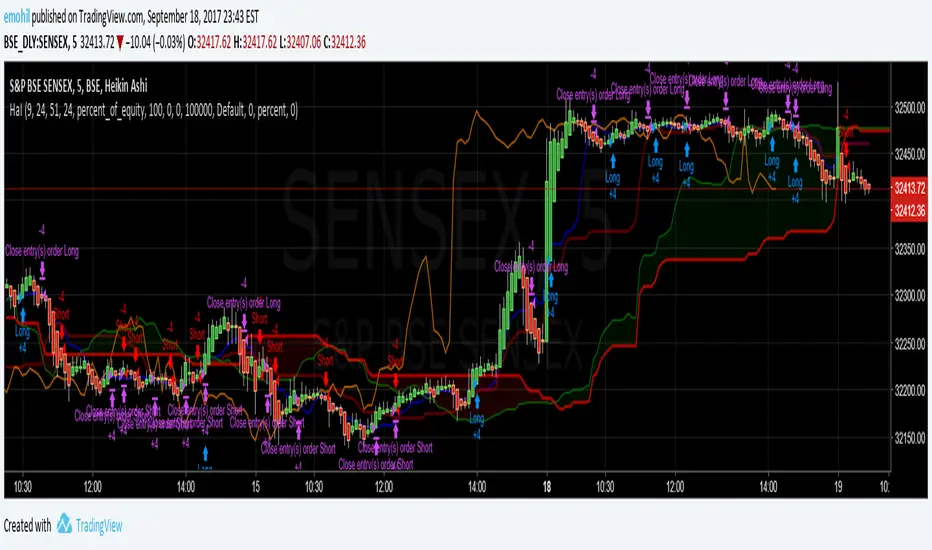
CoryT's Noro's Ichimoku AlertsA few months ago I took Noro's Ichimoku Cloud and used the AV bot template to throw stops on it. I took some code from JustUncleL
to make it not so hideous. Trailing Stops are turned off, stop losses are turned off (you really don't need them with this), and this is currently a Long/Short strategy, the Longs Only and Shorts Only options are broken right now, I'm tired and you guys can either fix it yourselves or deal with it like this for now.
Hint: If you wanna use this as a long-only strategy just have AV close your buy orders whenever a short is triggered.
Cerca negli script per "ichimoku"
CoryT's Noro's IchimokuA few months ago I took Noro's Ichimoku Cloud and used the AV bot template to throw stops on it. I took some code from JustUncleL
to make it not so hideous. Trailing Stops are turned off, stop losses are turned off (you really don't need them with this), and this is currently a Long/Short strategy, the Longs Only and Shorts Only options are broken right now, I'm tired and you guys can either fix it yourselves or deal with it like this for now.
Hint: If you wanna use this as a long-only strategy just have AV close your buy orders whenever a short is triggered.
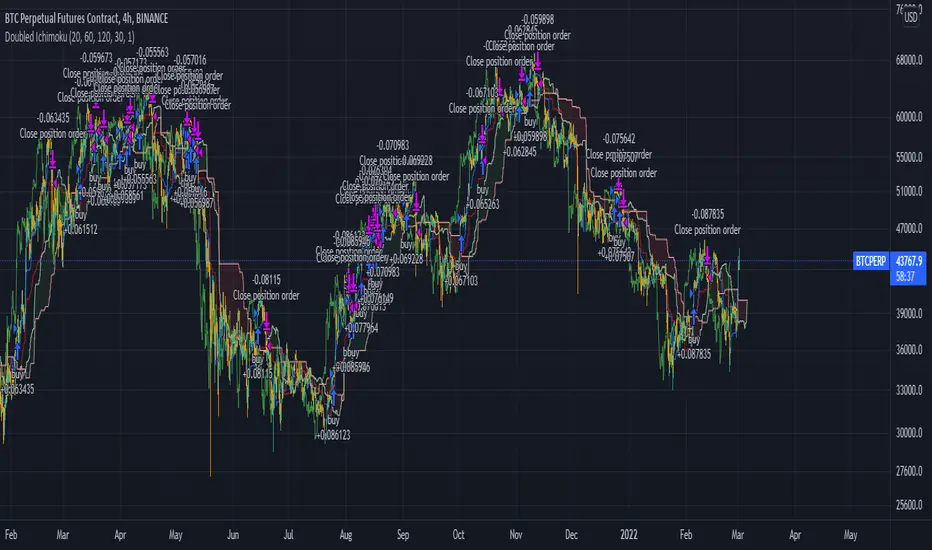
TSP Ichimoku Clouds x2 MTFDouble Ichimoku
Use a Multiple of current time frame :
15m * 4 = 1h
1h*24 = 1d

Fibon-IchimokuThis is a highly modified version of the classic Ichimoku cloud indicator. It incorporates Fibonacci retracement levels into the display. Hence the name "Fibon-Ichimoku"
As well as the standard short term Tenken-sen (blue line) and medium term Kinjun-sen (red line), it also includes a long term perspective line as well (in white).
The Tenken-sen and Kinjun-sen lines have been adjusted to work with 24hr Cryptocurrency markets.
Each line can also have the option to show 38.2% and 61.8% Fibonacci levels, however, I suggest not using them all at once, as there is a lot of information on the screen.
There is also a faint green and red thin line showing the top and bottom limits of the long term period.
Plotted above the candles, is a Fibonacci extension target line as a "possible" sell target level, this uses the Kinjun-sen time frame to find the swing low and swing high.
The extension target value is customisable by value as well as by forward or backward display offset.
The target level will show if the closing prices, from current bar to 2 periods back, is greater than the long term 50% line and the current Kinjun-sen 61.8% level is greater than the current long term 50% level.
After that if the Tenken-sen line is above the Kinjun-sen line, then the target will be green indicating a stronger trend. If it's less, then it will show as yellow.
BUT WAIT THERE"S MORE!!!
======================
Just for the sake of it, it also includes as an option to show inside bar alerts and price bar direction.
an "X" means an inside bar, arrows up or down indicate the direction of movement if it's not an inside bar.
The middle points of the bars determine the colouring of the alert.
If the current middle is greater than the previous, then it's green.
If the current middle is less than the previous, then it's red.
If there is no change then it's yellow.


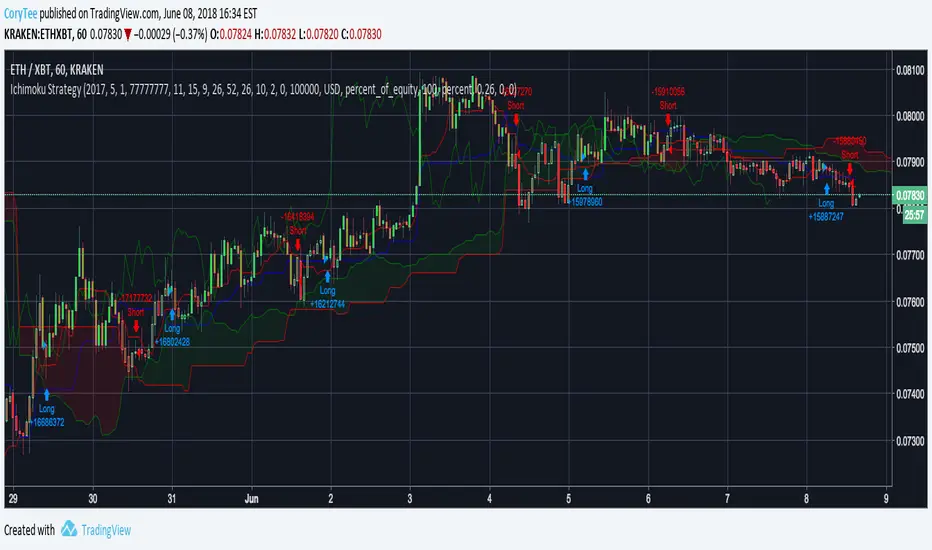
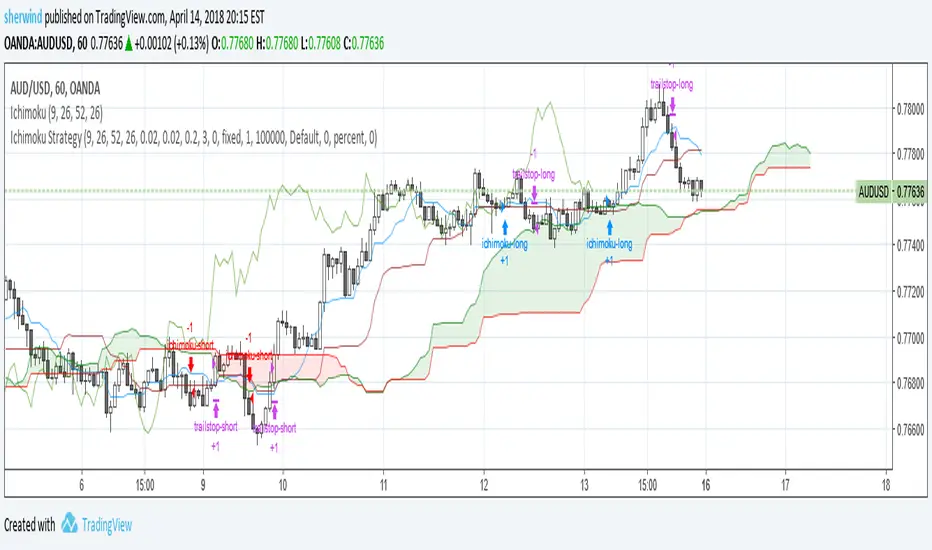
My Ichimoku indicator & Strategyhello I'm a beginner in trading, but I try to learn how to code strategies.
I recoded the Ichimoku indicator, and created my personnal strategy based on it.
The backtesting is done from 1/1/2017 to today in 45 min Time Unit for candles, with a 1 000 € equity.
The trades are all Long Entries and Exits with no pyramiding, no short trades at all.
/!\ Exchanges commission fees are not calculated and can in reality easily divide by 2 the total profit (am I right guys?) /!\
A buy signal is triggered upon these conditions:
- close is above the Kuma (cloud)
AND
- close crosses over Kijunsen AND Kijunsen is not flat (calculated with rising and falling with input "Kijunsen Lag")
OR
- Close crosses over ChikouSpan AND there was a sell signal in the last 8 candles
Sell signal is the same but reversed.
I appreciate your feedback ! Maybe I will update this later if I get better results.

Idō Heikin Ichimoku [DW]This is an experimental study inspired by Goichi Hosoda's Ichimoku Kinkō Hyō.
In this study, a McGinley Dynamic replaces the Tenkan-Sen and Kaufman's Adaptive Moving Average replaces the Kijun-Sen.
The cloud is calculated by taking the mean of the highest high and lowest low, adding a golden mean standard deviation above and below, and offsetting it over the specified period.
The lagging span is calculated by offsetting the closing price by the same amount as the cloud period.

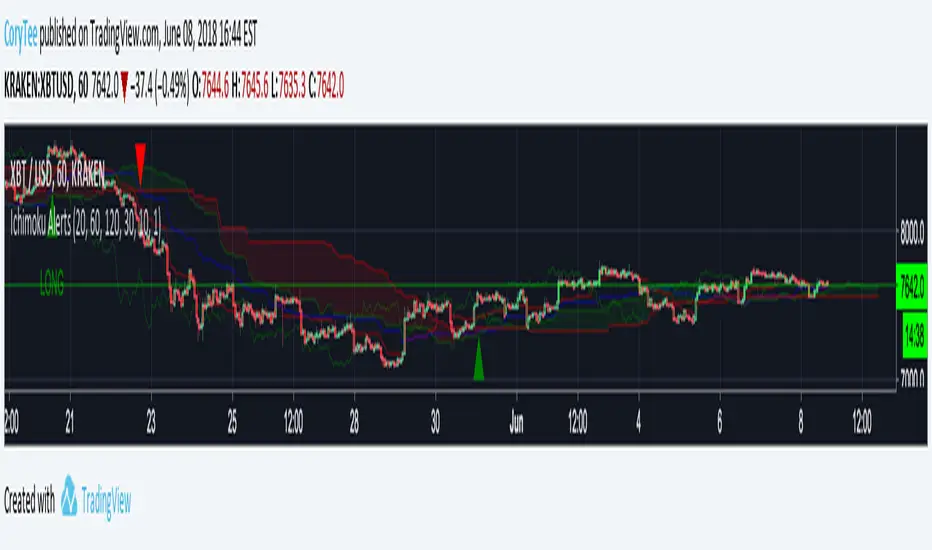
Multiple Ichimoku CloudsFor anyone that uses the Ichimoku Cloud there is a consistent need to flip between timeframes to get information about this at all levels. However, that trouble is now over. In this script there are 4 Ichimoku Clouds that operate in 4 different time frames. To change the timeframe simply change the multiplication factor to the desired levels. How this script works is that it takes your current timeframe as an input then it applies multiplication factors to it to achieve larger timescales. In the example here we are looking at the XBTJPY pair on the 1 hour. Our first cloud is 1x scaling, meaning that it is the 1 hour cloud. The second and third are 2x and 4x respectively meaning that we are looking at the 2 hour cloud and the 4 hour cloud. Lastly the largest cloud is the 24x cloud, aka the daily cloud. Now you only really need one look at the clouds for all the essential information.
As always feel free to message me about anything regarding this script.
Be happy :)
Heiken Ashi + Ichimoku Kinko Hyo StrategyHeikin-Ashi:
Instead of using the open-high-low-close (OHLC) bars like standard candlestick charts, it uses a modified formula. Out of which only following two are used in this strategy.
High = Max (High,Open,Close)
Low = Min (Low,Open, Close)
Ichimoku Kinko Hyo:
The Ichimoku Kinko Hyo system includes five kinds of signal, of which this strategy uses four signals i.e. Tenkan Sen / Kijun Sen Cross, price crosses the Kijun Sen, Chikou Span and Kumo. Although the Chikou Span, Senkou Span A and Senkou Span B (Kumo) are shifted into the past/future, these trigger signals enhances the strategy.
The Tenkan Sen, also known as the Turning or Conversion line, is a moving average of the highest high and lowest low over the last 9 periods in this strategy.
The Kijun Sen, also known as the Standard or Base line, is a moving average of the highest high and lowest low over the last 24 periods in this strategy.
The Chikou Span, also known as the Lagging line, is the closing price plotted 24 periods behind in this strategy.
The Senkou Span A, also known as the 1st leading line, is a moving average of the Tenkan Sen and Kijun Sen and is plotted 24 periods ahead in this strategy.
The Senkou Span B, also known as the 2nd leading line, is a moving average of the highest high and lowest low over the last 51 trading days is plotted 24 periods ahead in this strategy.
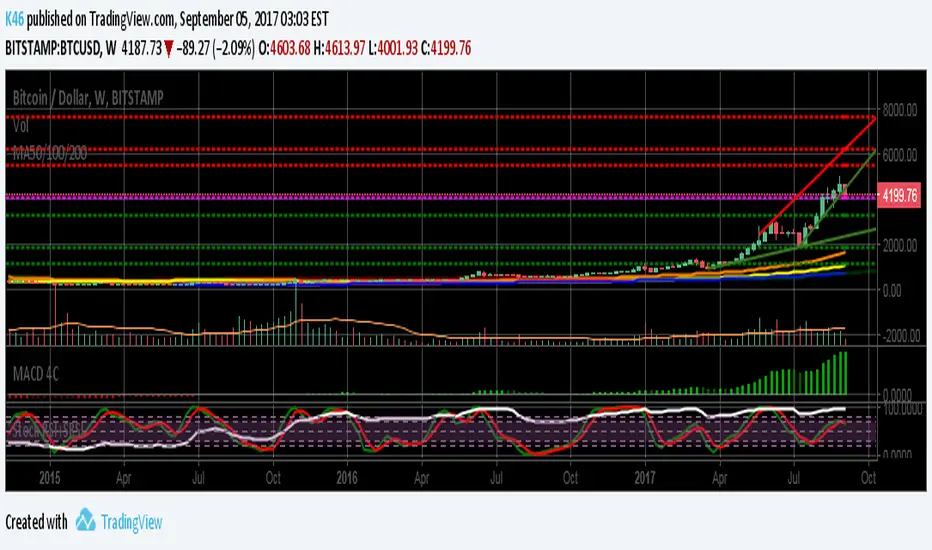
MA 50/100/200 + Ichimoku Cloud + Support/Resistance and PivotMA 50/100/200 + Ichimoku Cloud + Support/Resistance and Pivot
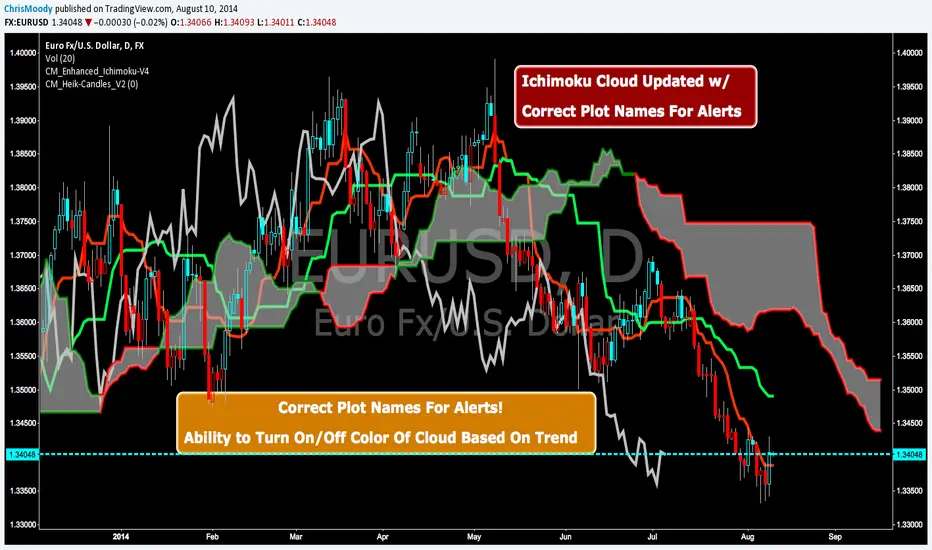
CM Enhanced Ichimoku Cloud-V4CM Enhanced Ichimoku Cloud-V4 Updated For Alerts!!!
Correct Plot Names For Alerts!
Ability to Turn On/Off Color Of Cloud Based On Trend!
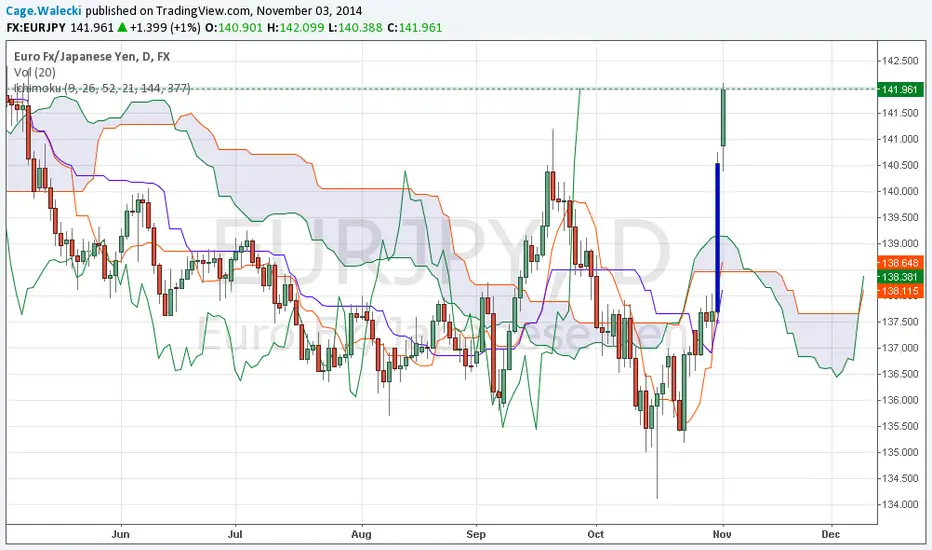
Ichimoku Cloud ExIchimoko Clouds with vertical lines at the Conversion Period (default: 9), Base Period (default: 26) and Lagging Span B period (default: 52) as visual clues to the offsets.

Ichimoku 4H crypto strategy -- LONG ONLYThis is a LONG ONLY strategy for 4h timeframe of any Cryptocurrency/USD pairs. The strategy opens only 1 position at a time with the following conditions.
Open Long Position when:
1. Closed price above cloud AND
2. Green cloud ahead AND
3. Conversion line above Baseline AND
4. Lagging span above cloud and price action AND
Close trade when:
1. Lagging span gets below price action or cloud OR
2. Price gets inside the cloud OR
3. Price gets below baseline
You can use it on a lower timeframe at YOUR OWN RISK. My optimal timeframe is 4 Hour candles.
Cheers.
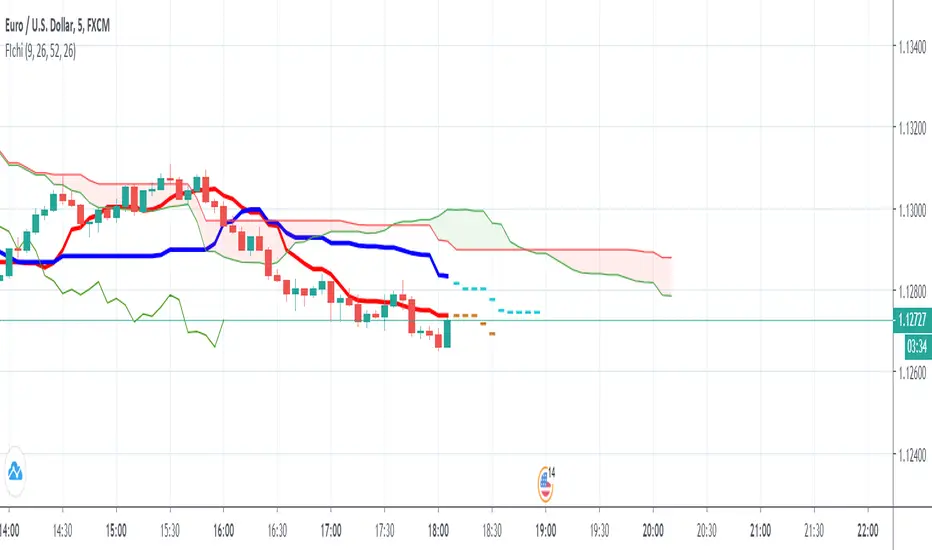
Ichimoku +FutureKijunIt's a simple code that will show you the future Kijun and Tenkan, assuming that no new High or Low will be submitted.
Ichimoku with ADXMy first attempt at coding a strategy in pine script.
The strategy tests for a confluence of bull / bear signals and executes a trade when these are met.
It uses the ADX as a screen against fake breakouts.

Ichimoku Cross Indicator [Mehdihz]This script shows tenken & kijen lines position to better detection of crosses.


Ichimoku Cloud StrategyBased on the trading strategy described at
stockcharts.com
See Also:
- Backtesting and forwardtesting (of TradingView Strategies)
- 9 Mistakes Quants Make that Cause Backtests to Lie
- When Backtests Meet Reality
- Why MT4 backtesting does not work
Ichimoku-Hausky_v2.1Made a little update to my trading system. This system is made so that you can easily follow the trend and know when to get out. You still have to know basic market structure to find a good entry.
NB!! I see that i placed the entry wrong on the example, you have too wait for the EMA to go below the MA :)
I have posted the right one at the bottom.
Take profit can be set at last low or you can use trail stop on the EMA, MA, Kijun-sen or Tenkan-sen.
Example rules:
Buy:
IF Market is in a trend or are possibly close to break out of range
THEN see if price has closed above cloud
IF price has closed above cloud
THEN see if EMA has crossed above MA
IF EMA has crossed above MA
THEN buy or wait for pullback
Sell:
IF Market is in a trend or are possibly close to break out of range
THEN see if price has closed below cloud
IF price has closed below cloud
THEN see if EMA has crossed below MA
IF EMA has crossed below MA
THEN buy or wait for pullback

Ichimoku-Hausky_v2 Trading SystemMade a new version of my trading system. I have added a cloud that is made with 45 EMA and 104 MA. Now you can choose where to set trailing stop. As shown in the example you set trailing stop under the cloud.