SupermokuThis is a completely custom Ichimoku Cloud indicator bundle and strategy backtested on all BTC fiat pairs with impeccable results. The profit factor can only get so high. This is the crème de la crème of Ichimoku Cloud.
Cerca negli script per "ichimoku"

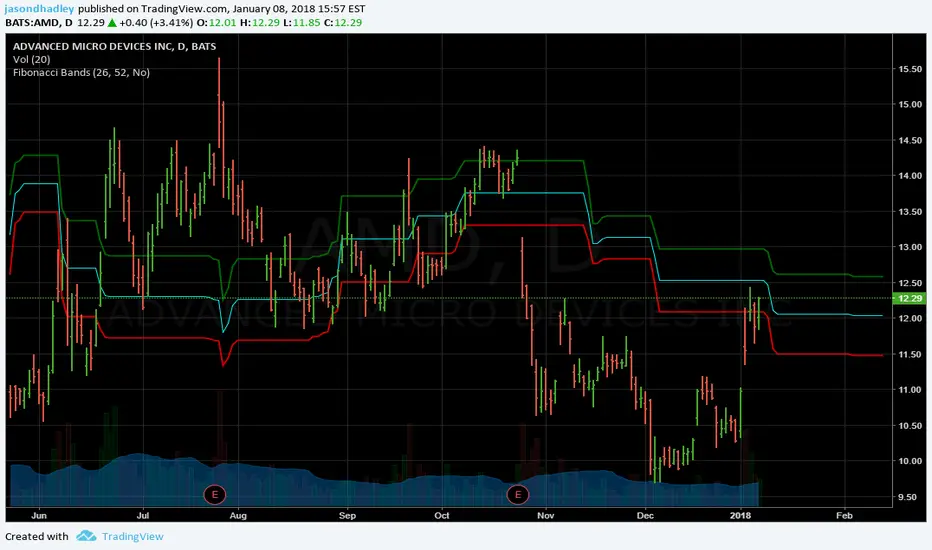
Fibonacci BandsFibonacci Bands work like a cross between Bollinger Bands and Ichimoku clouds.
The upper Fib band is the 61.8% band, the middle Fib band is 50% band and the lower Fib band is the 38.2% band. It also has a forward projection inspired by Ichimoku clouds.
You do have the option of enabling the 100% and 0% bands within the options.
This is the initial release of the indicator, beautifying it and opening up the source code will be in future releases.
Senkou Span Cross Strategy [Krypt]A simple trading strategy oriented towards cryptocurrencies that uses log-space Ichimoku clouds
Long position: when Senkou Span A crosses over Senkou Span B
Short position: when Senkou Span A crosses under Senkou Span B
The indicator used in this strategy is available as a standalone script:

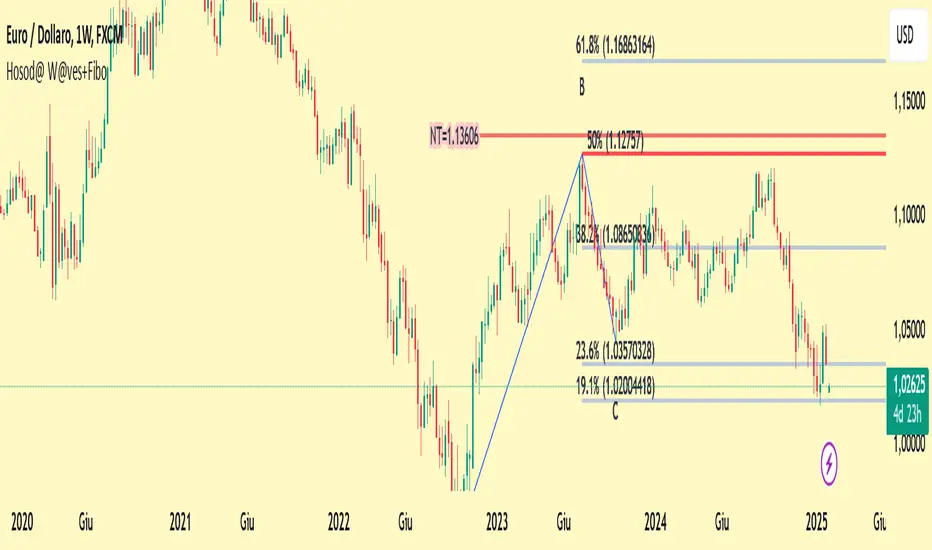
Hosoda Waves ABCThe Hosoda Waves indicator was devised by Goichi Hosoda, the creator of the Ichimoku system, with the idea that previous highs and lows could determine future price ranges to which the market would react. Hosoda's projections include the NT, N, V, and E waves, derived from calculations based on both upward and downward ABC swings. The calculations for Hosoda's waves are as follows:
NT Wave = C + (C - A)
N Wave = B + (B - A)
V Wave = B + (B - C)
E Wave = C + (B - A)
This indicator visually represents the calculations by Hosoda. Additionally, Hosoda indicated time cycles: 9, 17, 26, 33, 42, 51, 65, 76, etc., which are not integrated into this indicator as they are not considered effective in contemporary times.
Once applied to the chart, the interactive Pine Script tool version 5 will prompt you to identify 3 points of "low-high-low" or "high-low-high," both for upward and downward movements. Once clicked, these price points can be moved. If you change the time frame or market instrument, the indicator must be removed because it remains tied to the prices where it was initially drawn.
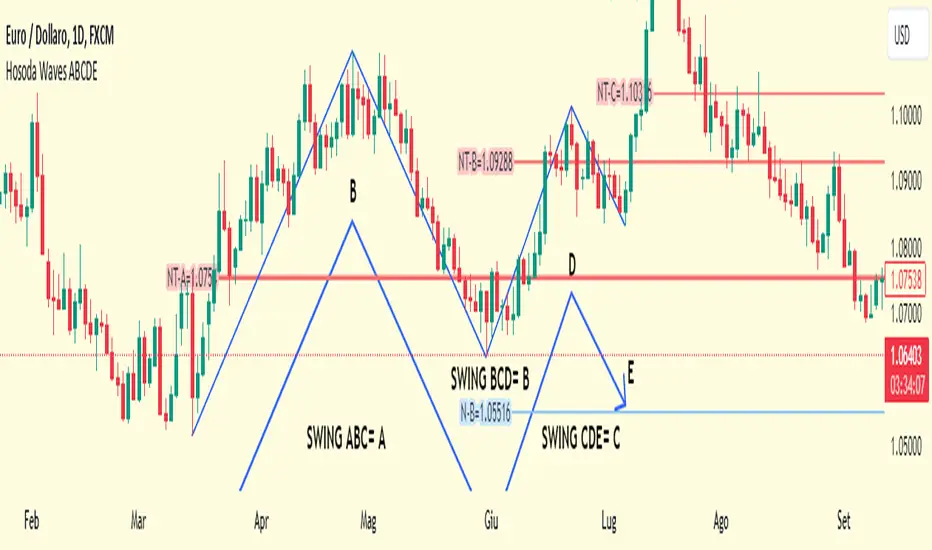
Hosoda Waves ABCDEThe Hosoda Waves indicator was devised by Goichi Hosoda, who is also the creator of the Ichimoku system, with the idea that previous highs and lows could determine future price ranges that the market would react to.
Hosoda's projections are the NT, N, V, and E waves, which are derived from calculations based on both upward and downward ABC swings.
Hosoda's waves are derived from the following calculations:
NT Wave = C + (C - A)
N Wave = B + (B - A)
V Wave = B + (B - C)
E Wave = C + (B - A)
There are already scripts for the Hosoda waves, and my idea is to project an ABCDE swing simultaneously, meaning projecting three swings:
ABC, indicated with an A, resulting in NT-A, N-A, V-A, E-A.
BCD, indicated with a B, resulting in NT-B, N-B, V-B, E-B.
CDE, indicated with a C, resulting in NT-C, N-C, V-C, E-C.
Once the indicator is applied to the chart, the interactive Pine Script tool version 5 will prompt you to identify 5 points of "low-high-low-high-low" or "high-low-high-low-high," both for upward and downward movements and mixed.
Once clicked, these price points can be moved. If you change the time frame or market instrument, the indicator must be removed because it remains tied to the prices where it was initially drawn.
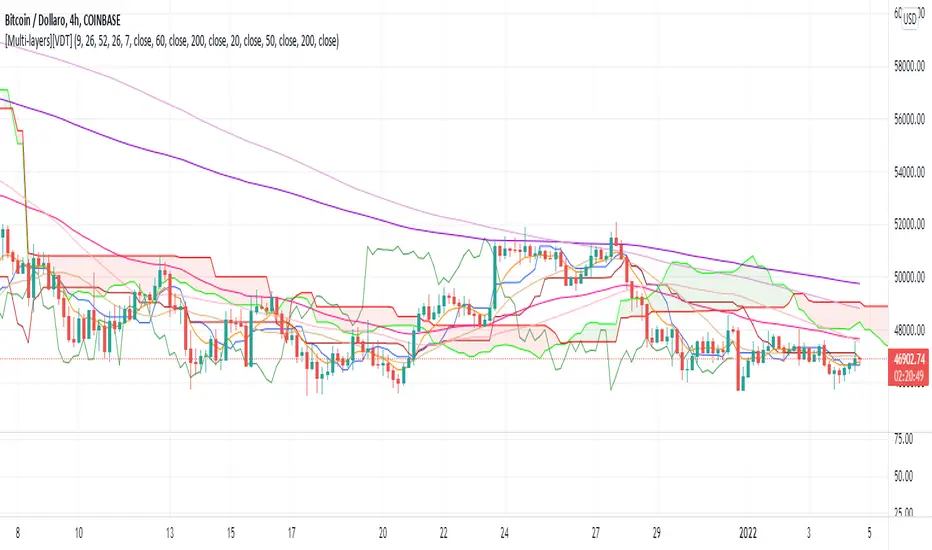
[Multi-layers][VDT]New multi-indicator to merge together three of the most popular indicators used by traders in technical analysis:
1) Ichimoku Cloud, with parameters editable by the trader. Default parameters are: 9-26-52-26
2) 3X Simple Moving Average (SMA), with periods editable by the trader. Default periods are: 20-50-200
3) 3X Exponential Moving Average (EMA), with periods editable by the trader. Default periods are: 7-60-200
Traders can decide whether to print or to hide each indicators separately in the graph, creating three different overlays.
TK Cross and Kumo Twist AlertBased on the ichimoku cloud system, this shows on a chart where Tenkan-Kijun cross happens and when a Kumo Twist happens.

BOLT ICHI M1A no cut-loss strategy based on custom ichimoku cloud to suit 1 minute timeframe strategy for FCPO market. However, there is a toggle button to enable stop-loss and take profit at the bottom that based on money value (RM) not tick count.

SeaSide420 StrategyThis Strategy by SeaSide420 uses IchiMoku, Engulfing candles and 3 moving averages to find entry to buy and sell orders. It will hold buys and sells at the same time, it will close orders by StopLoss, or Trailing StopLoss or Target Profit. In the example chart here, only the trailing stop is active. It does have commission already included in this result. The initial test equity is set to 1 (1 BTC) so if you use this on say, a FOREX pair, you might want to check your settings, for example, set the initial equity to 100,000 USD as it normally is. I set this to 1 BTC to show that Holding 1 BTC for 2 years would not be as profitable as trading 1 BTC with this strategy for 2 years. The commission level is the same as Binance (0.1%), and the example pair is a Binance instrument, where Bitcoin trades can be in and out this way (CFD). Here it is shown on Daily chart, and with other timeframes/pairs, you may need to adjust the settings (MA period etc). New settings are achieved by you testing them yourself. This is published as an experimental script for use through API to do Automated trading on crypto exchanges. Questions welcome. Strategy free to use, Script private (PM me about it) I have not tested the alerts, but i did include alerts when open and close orders. Let me know if it works or not.

Technicals Rating Strategy v420Ichimoku, HMA, RSI, Stoch, CCI, MACD, Technicals Rating Strategy is a trading Bot that looks at these chosen indicators and assigns a value to each, then calculates the result of adding each indicators result value to a overall rating, which is then compared to a user set level. Here seen on Bitcoin, it has the broker fee included in the testing result. If you choose to use it on Forex etc, perhaps remove the broker fee which is unrealistic for FX trading.
It has a Win/Loss ratio of only 40% wins, but it catches the big moves and thats the main thing, so if ELON MUSK had of used this strategy instead of BUY and HOLD, he could of made 700% instead of 7% (as is, may, 2021)
Mainly intended for use as Automated TRADE BOT.
(imagine if Elon Musk did use this bot with his 1.3 billion $ worth of BTC, the drawdown would be like, half a billion or something haha (p.s.- use smaller lotsize % to get smaller drawdown, but then smaller profit....) )
For use with any pair and timeframe. In fact there is a timeframe setting to set the strategy to look at alternative timeframe from chart, but as default will just be set to charts timeframe.

Ichimoku with shift (Pink)Hello traders you can easy shift cloud and chikou span(Apply positive and negative shifts)
Kind regards Ehsan(pinklove)

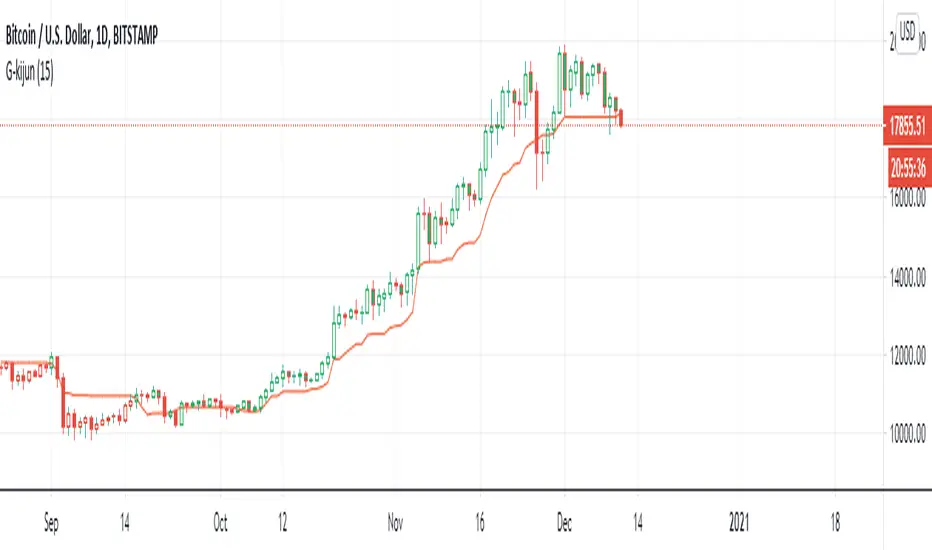
G-Kijun trailing stopThis indicator is the part of ichimoku kyo hyo.
I luv kijun-sen very much
kijun-sen is develop form (Highest - Lowest)/2
It's mean 50% of fibonacci
and I create color Green for price over the kijun-sen when the price cross down the kijun-sen it'sll be Red
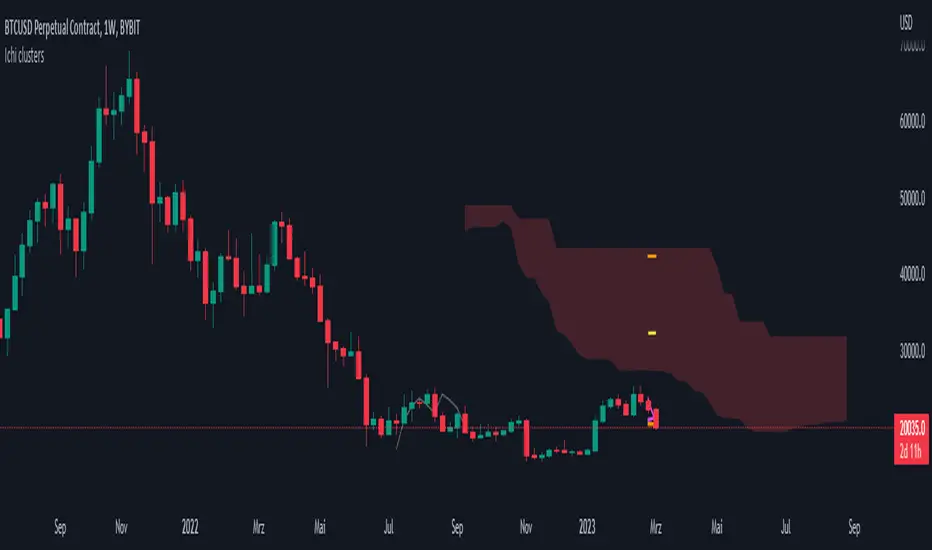
Ichimoku Kinko Hyo - mtf clustersThis script can show mtf-clusters from higher time frames. Tenkan-sen, Kijun-sen, Senko-span A and Senko-span B are displayed in the current time frame from higher time frames (the range is from 1 minute to the monthly time frame). Sometimes these levels form clusters that act as strong levels of support and resistance.
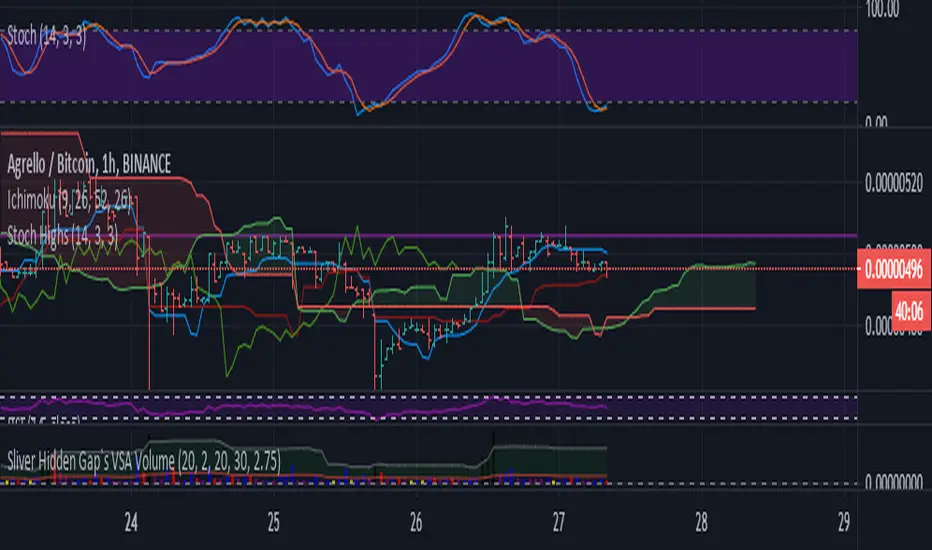
Pink panther It is a simple indicator, you can use it with all time frames. So the pink line present the last high potential area that price try to breakout , and to use it you must consider three main things :
1- price on your time frame above Ichimoku cloud.
2- RSI above 50.
3- MACD crossover.
how to execute your order?
when price break the pink line and close 1 minute candle .
Overlay_set by HallyIt is a set of overlay indicators that combine 5 simple moving averages, Bollinger band, and clouds of Ichimoku cloud.
The reason I made this is because I want to make it easier to switch the display of the indicator when trading in a short time.
For example, if you double-click SMA, the setting dialog for this indicator opens. Immediately check the check box of the Bollinger you want to add and close the dialog.
You can quickly switch the display with this feeling and save the amount of mouse movement.
x0xXx0xx0xXx0xx0xXx0xx0xXx0xx0xXx0xx0xXx0xx0xXx0xx0xX
単純移動平均線5本と、ボリンジャー・バンド、一目均衡表の雲を1つにまとめたオーバーレイ系のインジケーターのセットです。
これを作った理由は短い時間でのトレードの際にインジケーターの表示を切り替えるのを楽にしたいからです。
たとえば、SMAをダブルクリックすればこのインジケーターの設定ダイアログが開くのですぐに追加表示したいボリンジャーのチェックボックスにチェックしてダイアログを閉じる。
という感じで素早く表示を切り替えることが出来き、マウスの移動量を節約できます。

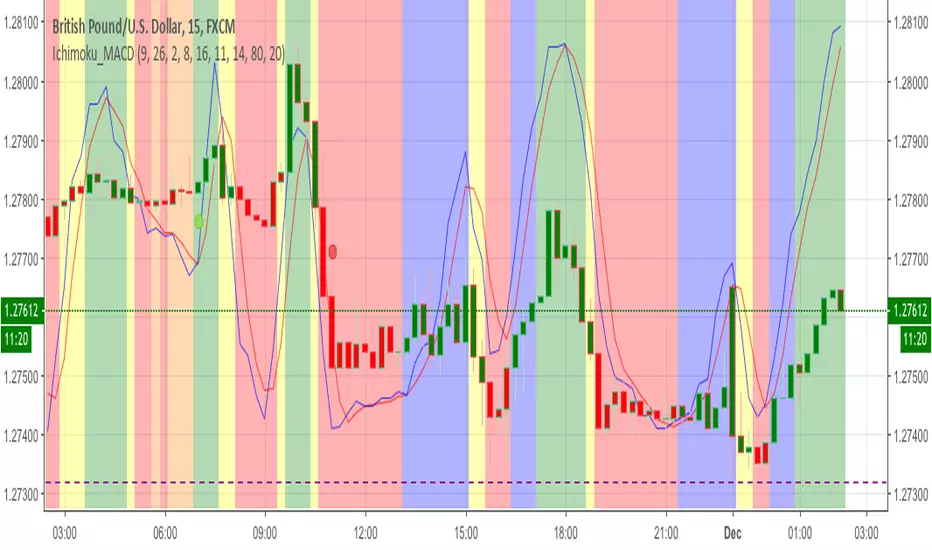
Hakimi - Ichi Based Pivot Time Prediction - V.2This indicator is based on multitime ichimoku and can be used to predict some of pivots .
How to use:
1- Select the arbitrary chart (Candles, Heikin Ashi, Line and Renko) and time frame.
2. Set the “Offset” value. Default value is -1.
3. Set the “Time Coefficient 1” to “Time Coefficient 4”. Default values are 2, 3, 4 and 5.

Commander IndicatorMulti mixed customized Indicators
double Ichimoku set (Kijun 103 and 26)
EMA 103
Pioneer EMA 1
3MA
SwingHello All,
Here is another gem I recently finished working on.
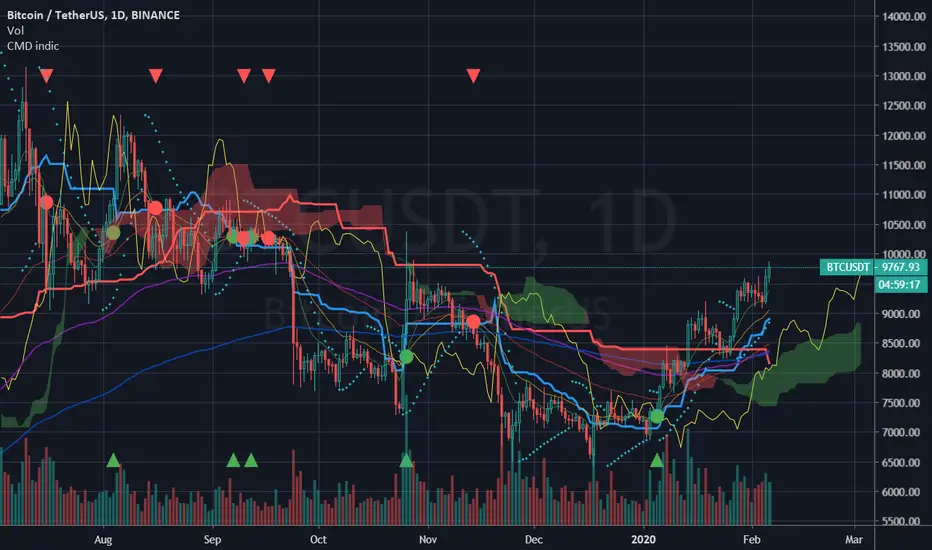
Swing is a Ichimoku based indicator which I designed specifically to call major swing trades.
Here I have Daily BTC chart which shows Swing perfectly calling major trend reversals.
Not only that, this indicator also works its magic on lower TFs, here is just one example, where Swing called major moves on BTC 1hr chart.
Contact me for more information.
:) :)

Uber Baseline [UTS]Uber Baseline is a highly customizable Baseline component for any trading system. Different strategies can be applied making it a powerful tool for every trader.
General Usage
The Baseline is used as an indication of the prevailing trend and helps keeping the trader out of bad trades.
Price above the Baseline only allows for LONG trades and below Baseline only allows for SHORT trades.
On price cross upwards from below Baseline and and candle close above Baseline the movement can be considered as bullish. Controversy if price crosses Baseline downwards from above and and candle closes below the baseline the movement can be considered as bearish.
Hence, ENTRY Signals for LONG or SHORT can be derived from those Baseline crosses.
Furthermore, any Baseline cross can also be treated as valid EXIT signal for an open position as the movement indicates a possible shift in trend.
Price that moves with unusual high volatility into one direction often tends to not trend but instead pulls back. Overshoot of the base line (default setting: 1x ATR) is recognized but does not produce an ENRTY signal, only an EXIT signal.
Advanced techniques can incorporate the one-candle-rule waiting for pullbacks after Baseline overshot following a possible ENTRY in direction of the new trend.
Trend traders can also look for Baseline bounces after an ENTRY signal for confirmation and better trade entries.
Moving Averages
16 different Moving Averages are available:
ALMA (Arnaud Legoux Moving Average)
DEMA (Double Exponential Moving Average)
EMA (Exponential Moving Average)
FRAMA (Fractal Adaptive Moving Average)
HMA (Hull Moving Average)
JURIK (Jurik Moving Average)
KAMA (Kaufman Adaptive Moving Average)
Kijun (Kijun-sen / Tenkan-sen of Ichimoku)
LSMA (Least Square Moving Average)
RMA (Running Moving Average)
SMA (Simple Moving Average)
SuperSmoothed (Super Smoothed Moving Average)
TEMA (Triple Exponential Moving Average)
VWMA (Volume Weighted Moving Average)
WMA (Weighted Moving Average)
ZLEMA (Zero Lag Moving Average)
A freely determinable length allows for sensitivity adjustments that fits your own requirements.
Trend Visualization
If the predominant trend direction is DOWN the moving average is painted red. If the trend direction is UP the moving average is painted in green.
If the movement is FLAT then the color is gray.
Alerts
Traders can utilize the following signals to trigger alerts from:
Bull Cross
Bear Cross
Overshoot Up
Overshoot Down
Those values are > zero if a condition is triggered.
Alert condition example: "Bear Cross" - "GreaterThan" - "0"

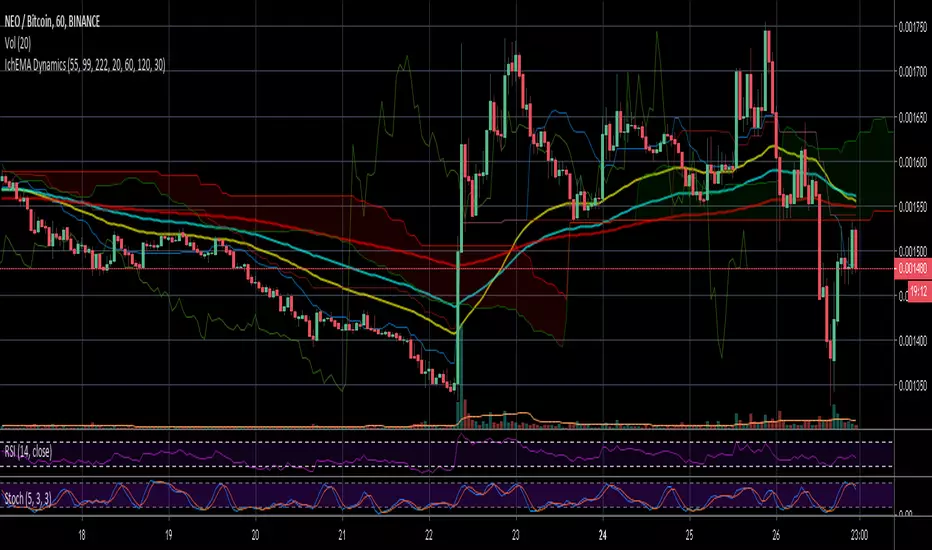
IchEMA Dynamics w/ EMAs and Cloud (for Darth Crypto's TFC Group)This indicator has the EMAs and Ichimoku cloud that make up my IchEMA Dynamic Supports. One of our members is experienced in making scripts, and was working on a much more complex solution that includes indicator functions as well! For now, this will give you my exact indicators for IchEMA dynamic supports. This indicator will automatically use my settings as the default settings.
Crypto4Fun Gunbot Script #1This script provides a trigger for Gunbot (or any other bot) combining different indicators on 2 timeframes as follows :
1) on the timeframe of the chart : ichimoku and SMA-spread
2) on the higher timeframe : DI+ and DI- ==> you can select your preferred higher timeframe, preferrably higher than the timeframe of the current chart
All parameters are configurable
Workinstructions :
Add the script to your chart
Move the shown indicator to a window below
Set the email alert as follows : 'plot' value crosses over 95
Feedback and suggestions are welcome

Ali_Trading Tools
This Tools includes the following:
MA:50 with Color Code
MA:100,200
EMA:15
Bollinger Bands
Ichimoku Cloud
Pivot Point High and Low
