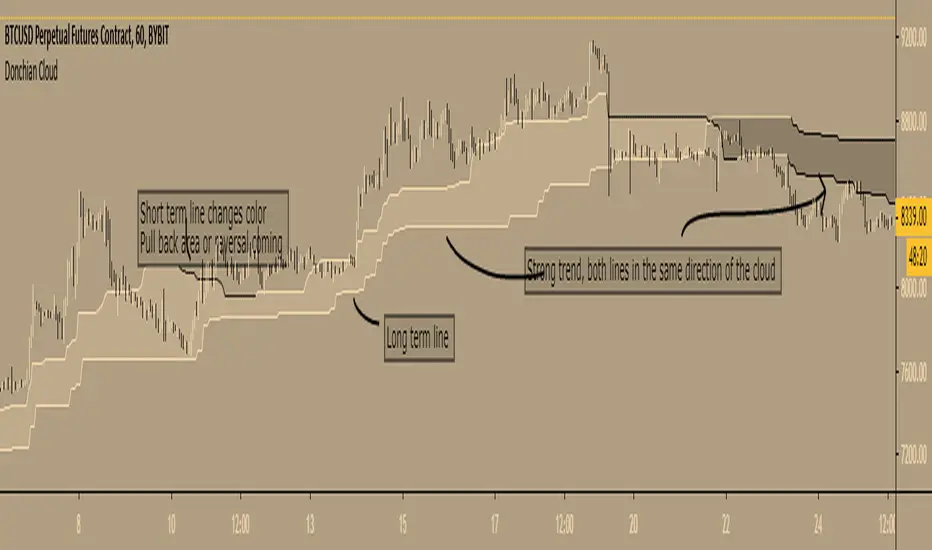
Donchian Cloud - evoA cloud based on the highest high and lowest low of a given period (Donchian), same lines used in Ichimoku Cloud (Conversion line or Base line).
Short term line is based on current time frame, long term line is based on your given multiple of current time frame.
The color of the lines is based on up or down movement.
I stole a piece of code from PineCoders for the multiple time frame:
I have not used this in my trades (yet) so I don't know how good it is, just posting because it looks nice :)
Feel free to share your settings if you can find good ones.
Cerca negli script per "ichimoku"
Zentrading Trend Indicator v3.1This is a script for beta testing only.
Based on ichimoku, but with slightly different behaviour, with many added features such as : trend detection, momentum detection, multiple time frame support/resistance levels, exhaustion/reversal signals.
Used in conjunction with the other ZT indicators (ZT momentum, ZT CyclePhase, and ZT Volumebars) the strategy provides very distinct setups to trade for reversals, breakouts and pullbacks.

Direction TradeDirection Trade is a moving average based indicator which combines power of SMA and WMA together.
The Buy/Sell (Arrow) signals comes from the combination of SMA and Hull MAs and works on multiple time frames.
The cross of yellow and blue indicates major trend change on bigger TFs, especially on Daily, these are also highlighted in the background color change.
In addition this indicator also adds power of Ichimoku which uses an optimized settings for crypto.

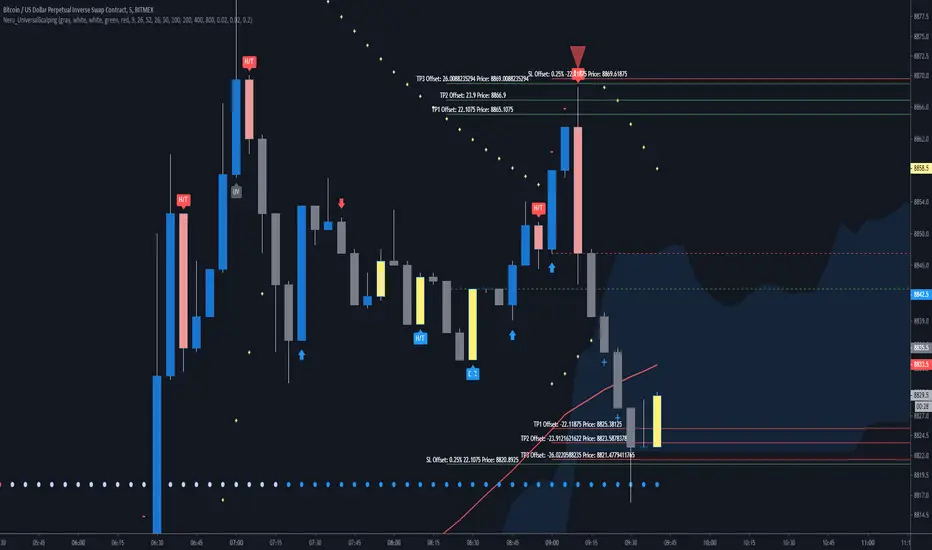
Neru_UniversalScalpingNeru_UniversalScalping - Tool
Markets: All markets, this is a universal tool which is using 100% standard settings for all built-in indicators.
Interval: 3 minutes to maximum 2 hours.
Built-In indicators:
- Basic Candlesticks (E/R as stronger one and H/T as weaker one)
- Stochastic breakups and breakdowns shown in different candle colors (close, 20 and 80)
- Extreme overbought and oversold conditions marked with a + an - (Stochastic >95 and <5)
- Daily and 4H Pivot Points
- Ichimoku Cloud (including Senkou´s, Tenkan + Kijun)
- 5 SMA´s (50,100,200,400 and 800)
- TrendEvaluator at the bottom, showing a basic trend (calculated from the cloud and 3 Moving Averages, 50, 100 and 200)
- Temporary buying + selling pressure labelled as arrows above and below candles
- Standard Parabolic Sar built-in
Risk Management:
You have the option to plot a basic risk calculation into the charts, based on the assumption, you don´t use a leverage and 100% equity.
Shown is a stop loss offset, the % and the price. Same goes for 3 take profits. Fees and spread are NOT included in this calculations.
You can choose between 0.25%, 0.5%, 1% and 1.5%, obviously the smaller the timeframe, the smaller risk you need to consider.
General Information:
All settings are adjustable, also in color and position.
This is not an automated system, that is generating entries and exits. With help of the built-in alarms you will have always to consider
the environment such as the trend, the relative position to the Pivot Points, the relative position to the Moving Averages and for example
conditions such as oversold / overbought and key-levels. It´s not replacing a human.
Please always be aware that counter trades on pullbacks are always more risky than trend-follow trades and a beginner should stick to less risk.
Warm regards, Neru
Neru_TrendEvaluator_v1Neru_TrendEvaluator_v1
_____________________
This trend-finder tool is showing you at the bottom of the chart (adjustable), what the current supertrend for the chosen interval is.
Used indicators are the Ichimoku Cloud (adjustable settings) and three SMAs (also adjustable).
Both have standard settings and are useful for Stocks, Forex and Cryptocurrencies.
_____________________________________________
Warm regards,
Neru

[Birbicator] StochTKDBirbicator is a custom indicator prototype based on Stochastic oscillator, enriched with Stochastic of Tenkan and Kijun of Ichimoku with adjusted, prototyped settings. It includes the ribbon, which corresponds with the momentum per Stochastic oscillator crossovers. It involves histogram as well which displays the relation of distance between Tenkan and Kijun. It displays the coloured candles in the main chart also. The orange colour is bullish while dark candle is bearish. White candles are neutral.
The indicator displays the strength of the trend when Stochastic and TK are following the same direction. The stronger buy/sell signal appears on the Stoch crossover simoultaneous to Histogram crossover.


Lancelot Band - ATR Reversal+Trending IndicatorThis is an indicator I created recently, with the mind of spotting where price might reverse and where the price is trending. You can see this as the primary indicator for your system, however, it is recommended you use this in conjunction with other confirmation indicators.
This script focus solely on ATR or Average True Range.
This indicator is the combination of the baseline from the Ichimoku cloud and the concept of the Keltner channel.
Baseline period = 14
ATR period = 14
ATR Mult = 1.5
For reversal
Long when price crossover Lower band & Stop loss at xLower band
Sell when price crossunder Upper band & Stop loss at xUpper band
For Trend Following
Long when price crossover xUpper band and Stop loss at Upper band
Short when price crossunder xLower band and Stop loss at Upper band
Again, you will need other indicators to help you to succeed in this system. This indicator will not generate the best exit for your position but will generate a good entry signal when you use it with both volume indicator and exit indicator.
Works well on BTCUSD XBTUSD, as well as other major liquid Pair.
Feel free to follow me on Twitter @Lancelot_Auger for more free Alpha.
Please acknowledge my effort by like and follow.
And lastly,
Save Hong Kong, the revolution of our times.

CloudRest ATR based cloudThis is an indicator I have been working on for the past 2 years, developed specifically for cryptocurrency.
It is primarily a trend following indicator with great success and it performs the best in 4hrs to the weekly chart.
There are two components of this indicator.
The baseline from Ichimoku cloud and volatility stop .
baseline period = 26
volatility stop = 1.5ATR, 3
You can view this as the main component of a trend following system but you will need other confirmation indicators to confirm your entry.
Feel free to modify the script for your own system.
Feel free to follow me on twitter @Lancelot_Auger
I will be posting more content in the future, stay tuned.
And lastly,
Free hong kong, the revolution of our time!

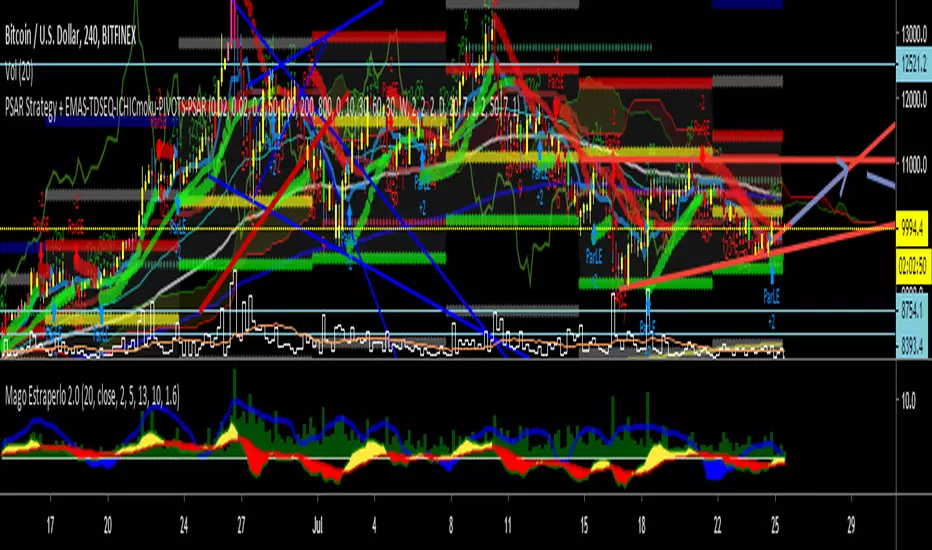
PSAR Strategy + EMAS-TDSEQ-ICHICmoku-PIVOTS-PSARPSAR Strategy + EMAS-TDSEQ-ICHICmoku-PIVOTS-PSAR
In this script you have a good strategy, called Parabollic PSAR and this indicators:
4 EMAS --> 50, 100, 200 and 800
TD Secuential
Ichimoku indicator
Pivots
Parabolic PSAR.
The Mango Ribbon The Mango Ribbon is a convenience indicator which encompasses a combination of moving averages combining those of exponential and Ichimoku averages. I will be updating this indicator with more features as time passes.
Hope you enjoy. For access, simply pm me on Telegram (porco1x) or use the sign up form at mangoresearch.co

MA-EMA-BB - NakajimaSome MA and EMA that you can hide/show
Bollinger Bands
Ichimoku
Fibonacci
Fractals


APEX - Swing Aura StrategyA backtester of my new strat, it's a hybrid swing/scalp strat that really looks for quick low profits. Will keep it hidden as it's a bit of a work in progress right now. Working on it to perform well enough with the Apex Trading bot, ran it for a day now and it ended the day on a 1.78% portfolio profit, so I'm really pleased with that.
As for details it's based on Keltner Channels, Bolingers Bands and a Ichimoku cloud. To spice it up there's even a Wave trend in there as well!
All the settings for the bits and parts are changeable so feel free to mess around with them, but will keep my sell triggers fixed for now, so no editing of those from within the script unfortunately.
Enjoy!

ICH+BB+MA_BY_CRYPDOGThis is multiful layout. :)
1. ICHIMOKU BASE LINE + CONVERTER LINE
2. Multiful BB BAND ( MAX 4 )
3. MA / EMA / VMA ( MAX 6 )
4. Color custom / Input number custom
If you have any question dm me.
Thanks!
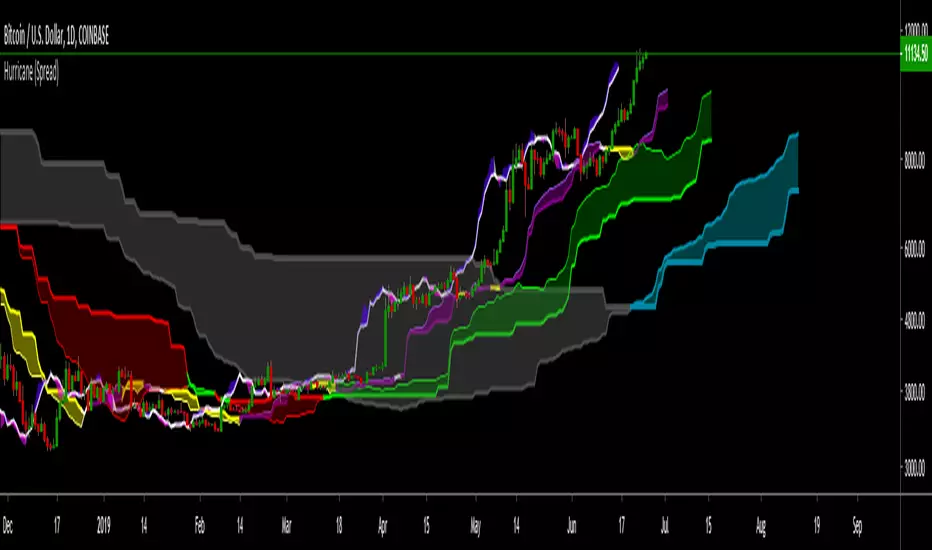
HurricaneThe Hurricane Indicator
This Indicator takes the traditional Ichimoku and expands it's capabilities to a whole new level.
It is a trend based trading indicator that utilises equilibrium calculations from multiple time frames, to reveal areas of support, resistance, strength, weakness, acceleration and momentum throughout the various bull and bear market trends.
By using the three components of the Hurricane together (or individually), it presents the entire picture of micro, mid-term and macro trends, enabling the trader to scalp price movements on a smaller time frame whilst keeping an eye on the larger trend.
For a full write up on what it does and the explained settings follow this link:
docs.google.com
Add this to your favorites, then send me a message through Trading View and I'll grant you temporary access to try it out.
To continue using it after the trial period, send me a message.
BTC: 13UKYNt4AAz2Yh2Suu6AAEWoUEiRVjqC12
LTC: LX4bUBdjiRPsagUbZoAczSGgDC4YqTJL7w
(YEK) Combo(YEK) Combo is a combination of several indicators (listed below). You can use them together or one by one. Just click settings, and choose which of them to be shown.
Here are the indicators included in this script:
- Ichimoku Cloud
- Bollinger Bands
- Moving Average 1
- Moving Average 2 (In case of detecting golden crosses or death crosses)
- Exponential Moving Average
- T3 Tillson
- MavilimW
Enjoy!

IchiMA ChannelEstrategia basada en un principio de ichimoku, Green Long , Red Short.
Make it simple.

HARA's favorite indicator by Theo ParkThis indicator contains :
4 Ichimoku clouds
8 Moving Averages
1 Fibonacci Bollinger Bands
2 Normal Bollinger Bands
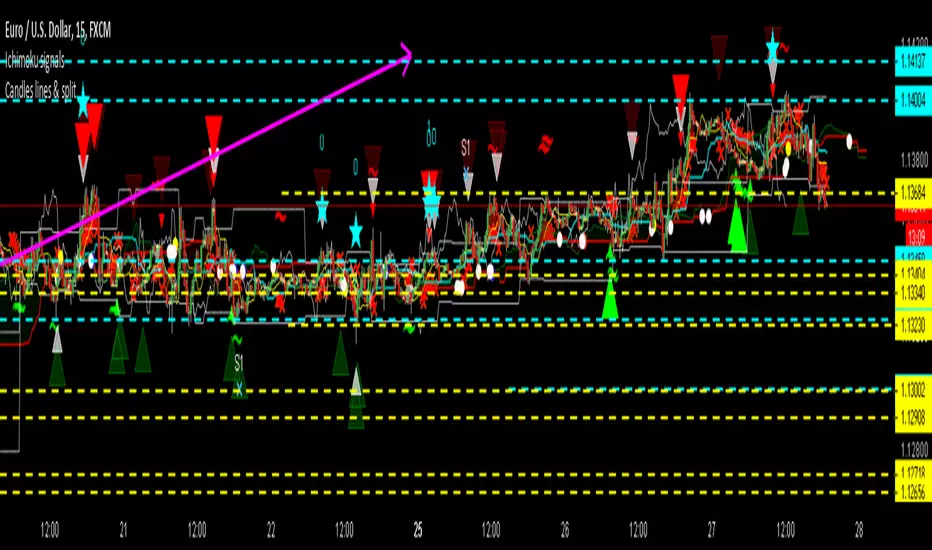
Candles lines & splitTrigger alerts when candle pattern are detected.
More conditions are shown : if previous ichimoku levels are touched, if divergence is being raised.
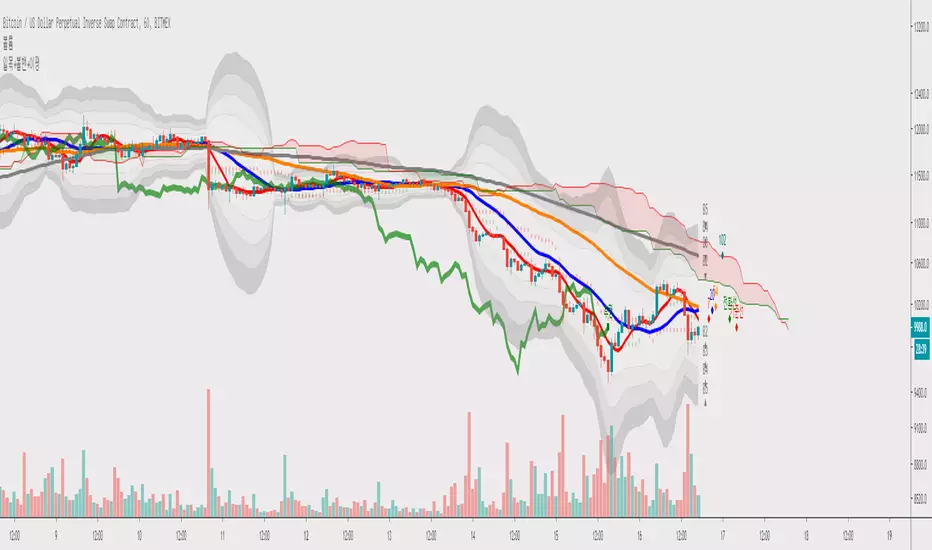
MBY_Trade1HBITFINEX:ETHUSD
Hi.
This is MBY_LAB.
This indicator is a paid indicator.
The color of the moving average reflects MACD.
The signal line in the middle of the screen is the Ichimoku baseline.
And you can also trade through the Bollinger Band at the same time, and you can turn it off when you need it.
You can see the Fibonacci resistance line and supporting line at a glance.
We have set the background color to distinguish between bearish and burlish.
Please use strategy test in 1 hour time frame.
Please give me a message.

ZenTrading MTFA Trend TerritoryBetaversion
This is a multiple timeframe analysis script using ichimoku that checks where price (close) is on different timeframes.
Green : Price is in bullish territory
Orange : Price is in consolidation
Red: Price is in bearish territory.
The script looks at 15 min, 1 Hr, 4 HR, D, W, M timeframes. Not all will be relevant (depending on trading timeframe and on asset).
Possible to toggle timeframes on and off (15 min and M timeframes may not be relevant for the asset or timeframe you trade on, switch them off for a cleaner chart)

Cyatophilum Ichimoku Small TimeFrames [BACKTEST]A script for daytraders trading small timeframes.
Currently in developpement.
If you want to try it send me a PM, and give a like to receive updates.
