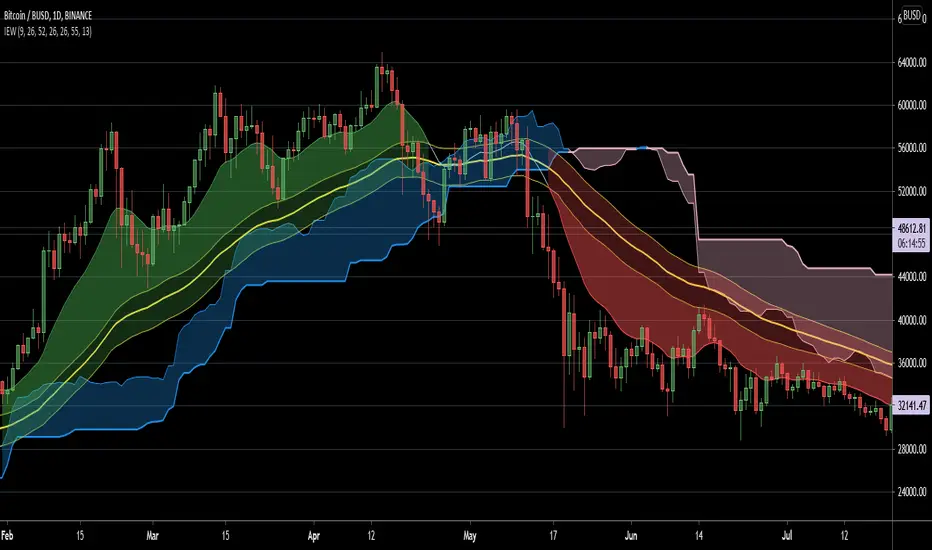
Ichimoku EMA WaveThis script combines a customizable Ichimoku Cloud/ EMA combination to provide a quick trend visualisation.
For example, long entries can be found when the green EMA wave rises above the Ichimoku cloud.
Combine it with some oscillators (like MACD) for good results.
Also, experimenting with a different "wavelength" (default 50) and/or EMA length (default10) for different securities is a good idea.
Script is free to use and to modify at ones liking.
Cerca negli script per "ichimoku"
Ichimoku by HosodaWritten from scratch Ichimoku indicator, based on original calculations from Hosoda books. All formulas are exactly the same as Hosoda put them in his books, it contains additionally analysis from Higher Timeframe allowing to display Chikou trend, Kijun and Senkou-span B which are crucial in determining trend. It also contains overlay of Kyushu Legs. This is initial version of script and will be contanstly improved.
Some Ichimoku scripts have basic bugs in calculations and I ensure that formulas in this indicator are fully correct in relation to formulas provided by Hosoda.

Ichimoku BaselineVersion 1.0 with some possible updates in the future.
Based on Ichimoku Cloud, this indicator pulls information about Tenkan, Kijun, as well as the Cloud Spans to calculate an immediate to short-term level of support or resistance, depending on whether price is above or below it.
Breaking across the line can be a good indicator of when to be long or short on the market, as well as a good way to have a "Baseline" to filter out other signals.
By default it is set to a modest 5 bar displacement/offset. Feel free to experiment with this value.
Enjoy!

Ichimoku Crypto LONG 3h ANY CRYPTO PairThis is a strategy which works with most of the crypto pairs on the 3H time frames.
It beats easily on the long term buy and hold strategy.
This strategy is made from the baseline from ichimoku together with ema 200
This is a long only strategy.
THe condition is : our candle is above ema 200 and our ichimoku its telling we have a long trend. We exit on the opposite signal.
If you have any questions private message me !

Ichimoku with MACD/ CMF/ TSI This is a strategy made from ichimoku cloud , together with MACD, Chaiking Money FLOW and True Strenght Index.
It can be adapted to any timeframe and any type of financial markets.
The idea behind its very simple,
We combine the long / short strategy from ichimoku, like cross between lines and below/above cloud together with histogram from MACD for positive/negative level. We use the same criteria for TSI and CMF, to check if its above or below 0 level.
Based on that we have a long or a short entry. The exit happens when the next options triggers, like for example we had long signal, we exit when we receive the short signal and viceversa.
It can be adapted with a risk management to apply a tp/sl level.
For any suggestion or details , let me know.

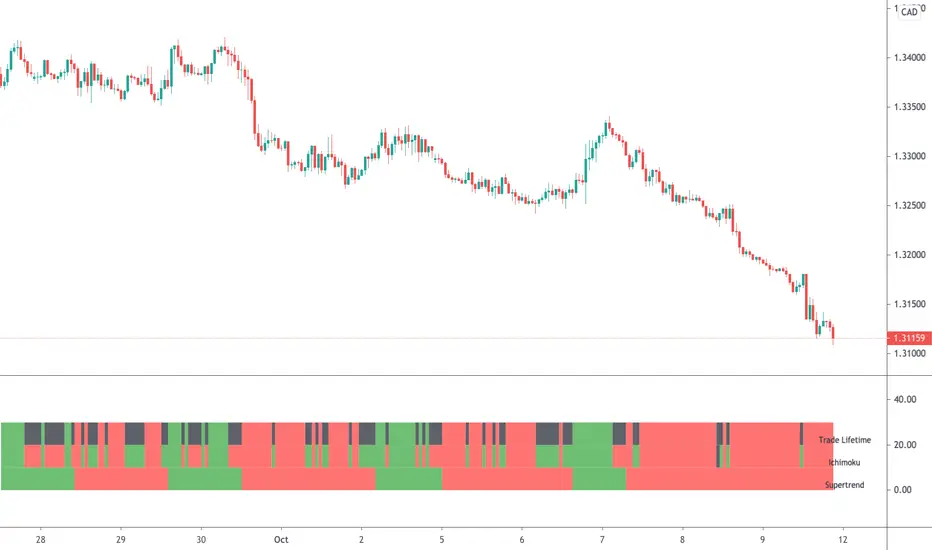
Ichimoku & Supertrend Combined StrategyOne of my mixed approach strategy indicators which include's:
- Ichimoku using much faster settings. (ECC-11)
- Supertrend
Whilst both Supertrend and Ichimoku are quite reliable, they do sometimes provide false signals. By combining both indicators, trading when both agree, it reduces the number of false alerts.
Using this indicator is simple. If the lifetime line is green then buy. If red then sell and when black don't trade. So...
Green Line - This strategy is in a buy position
Red Line - This strategy is in a sell position
Black Line - DON'T TRADE
The trader's approach is simple, when all indicators are green or red, then take the trade. As soon as one indicator changes, then re-evaluate using your normal process, such as price action, to determine whether to close the trade or continue.
There are also some alerts for opening and closing positions.
If you wish to make some changes or discuss, please don't hesitate to message me.
Ichimoku Clouds with Trend IdentificationThis is another version of the Ichimoku Clouds indicator where I have added logic to evaluate the current chart as either Bullish, Bearish, or Mixed, depending on 4 factors:
1. Is the price above/below the cloud?
2. Is the conversion line above/below the base line?
3. Is the lagging span above/below the cloud?
4. Is the rightmost cloud green/red?
If all conditions point the same direction, then the chart will be labelled "Bullish" or "Bearish". Otherwise it will be labelled "Mixed".

Ichimoku Cloud "Pivot"The purpose of the base and conversion lines is to give an indication of the current trend but the numerous crossings and false signals make it noisy and unreliable. This new indicator dubbed the the Ichimoku Cloud Pivot is based on an average of the IC leading spans without the time offset which are further filtered through a Donchian Channel. The result is the purple line which has fewer crossings and reliably serves as a resistance/support as shown in the diagram. It can be used in instances where the cloud fails to give a clear signal of the current trend. The brown line is the standard conversion line and is shown for reference.
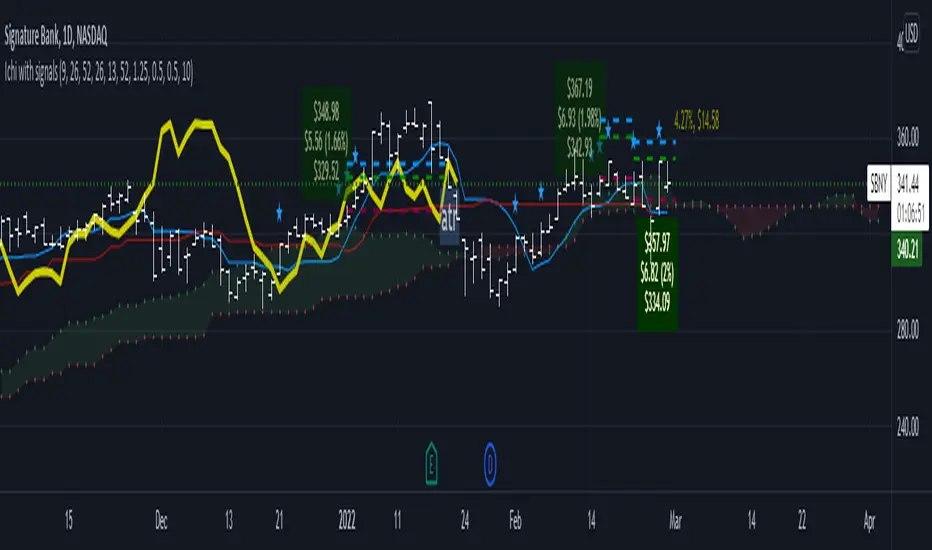
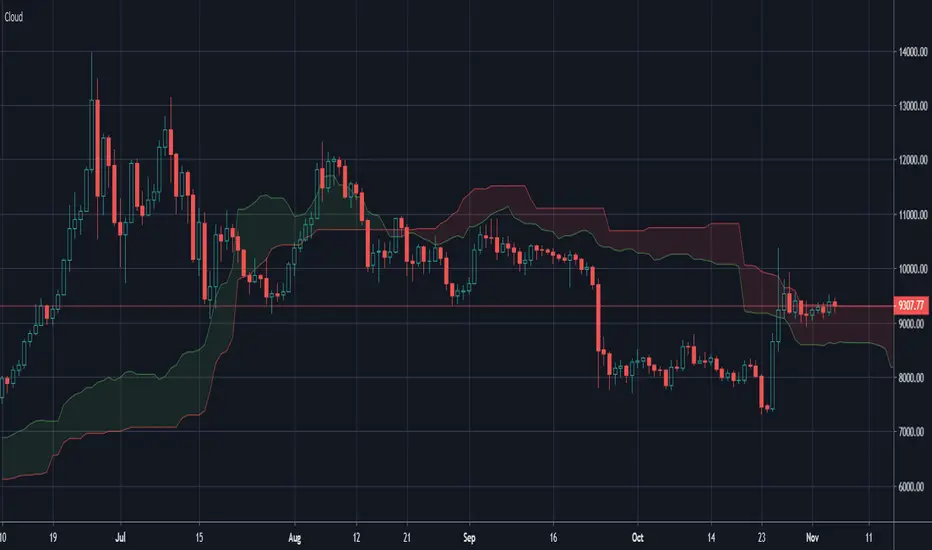
Ichimoku Cloud LONG and SHORT indicatorsThis simple script uses 4 rules from Ichimoku Cloud indicator to marks position entry points.
The idea is that by entering a long position just when these 4 criteria are met, you can capture a 2-3% plus move within the next few days:
1. The conversion line is above the base line
2. The price is above the clouds
3. The lagging span is above the clouds
4. The rightmost cloud is green
The same 4 criteria but inverted will indicate a short entry.
In order to avoid 'stale' entries which can lead to chasing, we want the price and conversion line crossovers to be recent, within the past few days. Ideally we want to enter before close on the day the entry signal is given so that we can capture any potential gap up (or down if short). Often the price will make a nice move the next day or day after. If any of the criteria become invalidated, or if after 4-5 days there hasn't been significant movement, then it was a false alarm.
This script will show the basic Ichimoku Cloud indicators, plus labels for bearish and bullish price and conversion line crossovers as well as LONG and SHOT indicators to show when the entry criteria have been met.
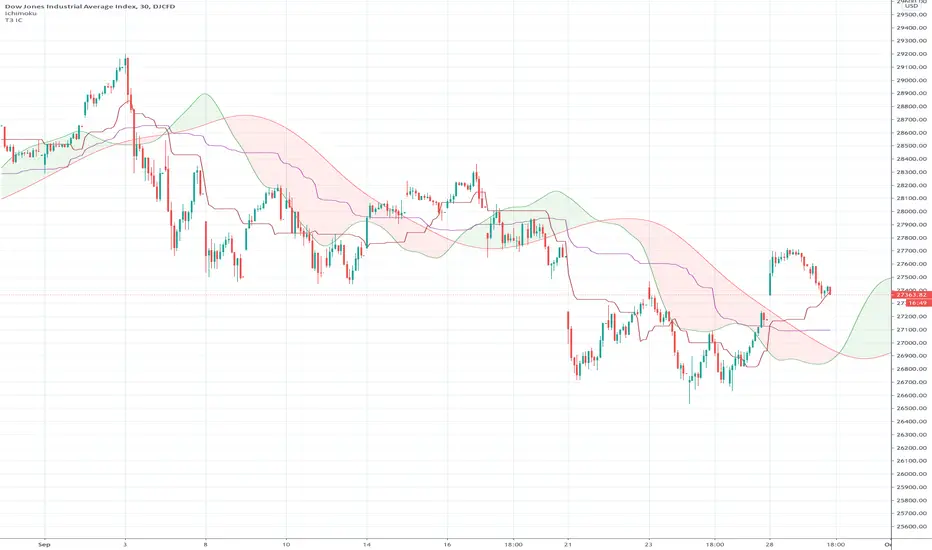
Ichimoku Cloud using Tilson T3 SmoothingThe standard Ichimoku Cloud is derived from Donchian Channels and is based on the range of the data set. However the channels are choppy and may not always be easy to read. By using moving averages, similar leading spans can be generated with a smoother outline. The T3 averages further smooths out the curve.

Ichimoku Kumo Switch Indicator [Mehdihz]This simple indicator just shows Ichimoku's Kumo cloud status.
Blue for increasing Kumo
Red for decreasing Kumo

Ichimoku Timeframe - [Silver-Wong]"Ichi Time" displays an Ichimoku indicator from another timeframe.
IE: Displays Ichimoku Daily while you are on the 4H chart.
Available timeframes:
- 1H
- 4H
- 12H
- Daily
- Weekly

Ichimoku MTFIchimoku MTF
This is two time frame indicator: Live and second as a default multi time frame for 1h
MTF Affected:
Kumo
Tenkan Sen
Kijun Sen
Chikou Span
Good Luck

Ichimoku Cloud OnlyPurpose: Makes your chart easier to read by removing some features displayed in the default Ichimoku Cloud
Benefit: Frees up space for other indicators that do the same or similar things. (like MAs and EMAs)
Removed Indicators: Conversion Line, Base Line, and Lagging Span.
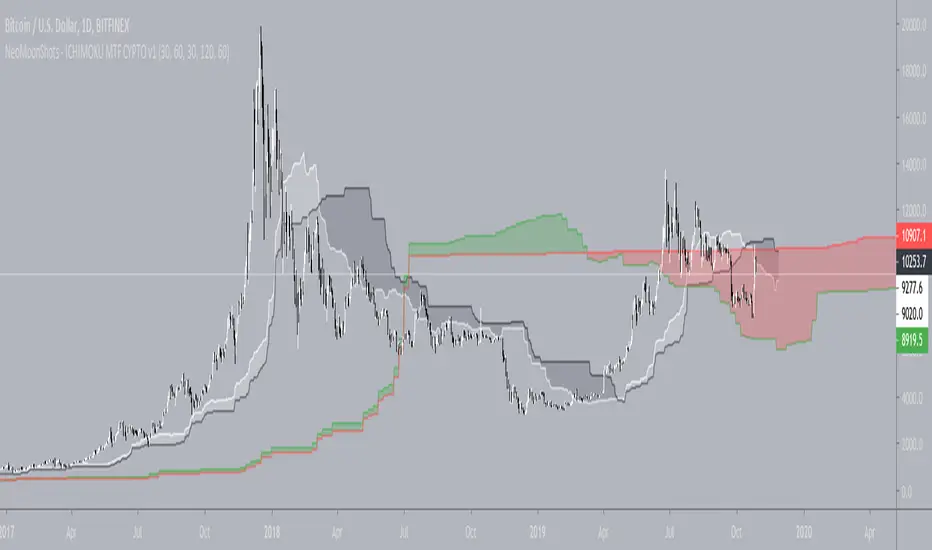
NeoMoonShots - ICHIMOKU MTF CYPTO V1Ichimoku cloud study to support multiple time frame (TF) at any given TF.
Supported TFs are:
1. 1 Hour
2. 4 Hour
3. Daily
4. 2Days
5. 3Days
6. Weekly.
Infopanel to show SenkouSpan A and B levels.

Ichimoku Cloud signalswith this indicator you will get buy and sell signals with 7 different strategies by Ichimoku clouds

Ichimoku Analyzer☑️Ichimoku Analyzer
-This indicator automatically analyzes the Ichimoku conditions.
- Long and Short signals.
- Allows you to add an MA filter.
-Works in any timeframe or market like Forex, Crypto, Commodities even Stocks.
-Recommended manual trading and bots.
Do you need an Script or an expert adviser for Forex, contact our coding service!
Get this indicator today! contact us.


Ichimoku Cloud + 3MASimple combination of Ichimoku and 3 moving averages. You can show/hide the MA's change their types and sources

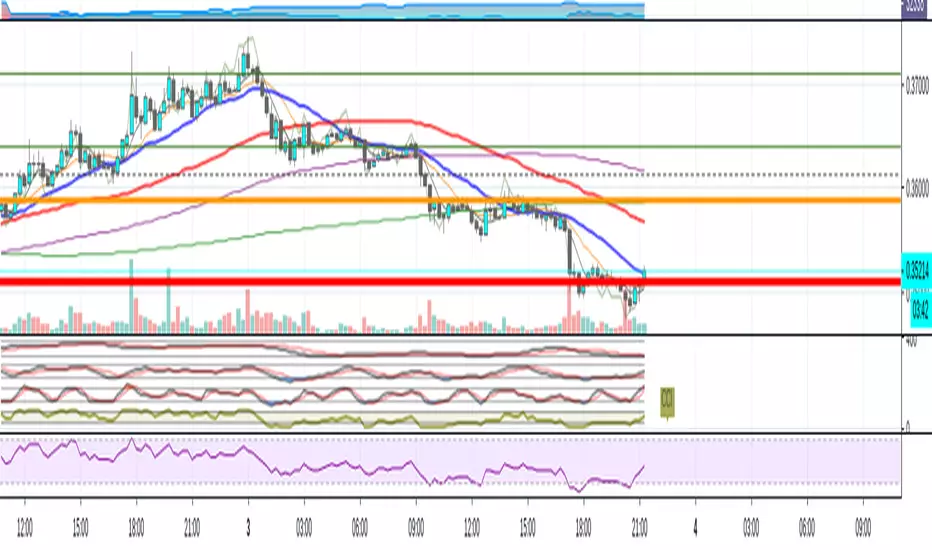
Ichimoku & 3 BB & Multi MA by Theo Park V1.1.00Ichimoku Cloud
3 Bollinger Bands
Multi Moving Averages
Ichimoku Backtest Ichimoku Strategy
You can change long to short in the Input Settings
WARNING:
- For purpose educate only
- This script to change bars colors.

Ichimoku Cloud x10 - Time fixedDraws up to ten ichimoku clouds, timeframe independant.
Just select your ichi settings, and which timescales you want to see. Enter 0 to disable, if you want less than 10 clouds.
