Richimoku (Enhanced Ichimoku with 4 Clouds)Are you an investor on the buy-side or a trader on the sell-side?
Use the brand new Richimoku Trading System to learn about trends earlier and discover trading signals and alternative data that can be transformed into sharper insights, better opportunities, and more profitable decisions.
The Richimoku Trading System includes:
1. Richimoku ( Advanced Ichimoku Kinko Hyo with 4 Clouds! )
2. Tenkan-Sen Strength Analyzer (Indentify divergences. Know First. Act Faster. A must-have for every Ichimoku trader)
3. Kijun-Sen Strength Analyzer (Indentify divergences... etc.)
4. Kumo Waves (Game changer!)
*As some indicators you may come across are using the repainting mode (which consists in correcting the false signal back in time).
You'll never see such thing in the Richimoku Trading System. What's on the charts is displayed in real time, no cheating...
Test the Richimoku Trading System For 12 hours! Study the chart history on all timeframes. Study all details incl. divergences etc.
FAQ.
How to access the Richimoku Trading System in tradingview?
To access your indicator simply click on “Indicators” at the top of your Chart, and click on “Invite-Only Scripts”. Click on the indicator to activate it. That’s it!
Will the Richimoku Indicator Trading System work for Stock and Index trading?
Sure! It works on all Forex, Stocks, Indexes, Metals and Crypto's!
Does this indicator work with a free TradingView Account?
Yes you can use the Richimoku Indicator Trading System with a free TradingView account.
Does the indiators work on all timeframes?
Yes, the indicators can be used on all time frames!
Cerca negli script per "ichimoku"

MZ Adaptive Ichimoku Cloud (Volume, Volatility, Chikou Filter) This study is a functional enhancement to conventionally used Ichimoku Clouds . It uses particular effective adaptive parameters (Relative Volume Strength Index (MZ RVSI ), Volatility and Chikou Backward Trend Filter) to adapt dynamic lengths for Kijun-sen, Tenkan-sen, Senkou-span and Chikou .
This study uses complete available Ichimoku Clouds trading methodology to provide trade confirmations. Its still in experimental phase so will be updated accordingly.
ADAPTIVE LENGTH PARAMETERS
Relative Volume Strength Index (MZ RVSI )
For adaptive length, I tried using Volume and for this purpose I used my Relative Volume Strength Index " RVSI " indicator. RVSI is the best way to detect if Volume is going for a breakout or not and based on that indication length changes.
RVSI breaking above provided value would indicate Volume breakout and hence dynamic length would accordingly make Ichimoku Clouds more over-fitted to better act as support and resistance . Similar case would happen if Volume goes down and dynamic length becomes more under-fit.
Original RVSI Library and study can be found here:
Volatility
Average true range is used as volatility measurement and detection tool. Dual ATR condition would decide over-fitting or under-fitting of curve.
Chikou Backward Trend Filter
Chikou is basically close value of ticker offset to close and it is a good for indicating if close value has crossed potential Support/Resistance zone from past. Chikou is usually used with 26 period.
Chikou filter uses a lookback length calculated from provided lookback percentage and checks if trend was bullish or bearish within that lookback period.
Original Chikou Filter library and study can be found here:
ADAPTIVE ICHIMOKU CLOUD
Tenkan-Sen (Conversion Line)
Tenkan-sen is a moving average that is calculated by taking the average of the high and the low for the last nine periods conventionally but in this study its length is dynamically adapted based on Volume, Volatility and Chikou filter. Default adaption range is set to 9-30 which I found universally applicable to almost every market on all time-frames.
Kijun-Sen (Base Line)
The Kijun-Sen is usually considered a support/resistance line which also acts as an indicator of price movements in the future and takes a longer period into consideration, usually 26 periods compared to Tenkan-Sen’s nine periods is used conventionally. In this study, its length is set to vary in range of 20-60 based on adaptive parameters.
Senkou-Span (Leading Span)
Senkou-Span A : Senkou Span A is the average of the highs and lows of Tenkan-Sen and Kijun-Sen so it automatically adapts accroding to dynamic lengths of Tenkan and Kijun.
Senkou-Span B : Senkou Span B is usually calculated by averaging highs and lows of the past 52 periods and plotting it 26 points to the right but this study uses adaptive parameters to adapt its dynamic length in range of 50-120 which makes Kumo (Ichimoku Cloud) a better area for support and resistance. I don’t consider its necessary to adapt Kumo’s displacement to the right, so I used conventional 26 period as offset.
Chikou -Span (Lagging Span)
The Chikou Span, also known as the lagging span is formed by taking the price source and offsetting it back 26 periods to the left but I used adaptive length in range 26-50 which makes this tool a better option to check for Chikou -Price cross check in wide range.
TRADE SIGNALS & CONFIRMATIONS
Volume : RVSI used to detect volume breakout about given point. By default, On Balance Volume based RVSI is selected for all dynamic length adaption and also for trade confirmations.
Cross(Tenkan,Kijun) : Easiest way to detect trend as if Tenkan is above Kijun then market is uptrend and vice versa.
Volatility : High volatility is a good way to confirm if price is on the move or not.
Tenkan = Kijun : Because of a wide range of Tenkan and Kijun length; their value can become equal before reversal.
Chikou > Source : A very conventional way to detect price momentum as if Chikou is above price then market is in uptrend and vice versa.
Chikou Momentum : Another simpler way to represent Chikou > Source as if momentum of price source is uptrend then price will tend to follow.
Source > Kumo : Using the best tool of Ichimoku Clouds i.e. Kumo. If price crosses both Senkou-Span A & B then market has broken potential resistance leading to a good uptrend and vice versa.
Source > Tenkan : Better way to detect price trend in short term.
Chikou Backward Trend Filter : Different from Chikou >Source in a way that Chikou filter makes sure that price crosses highest/lowest within defined period.
CHARTING
Bars Coloring : Bars coloring is set as following :
src > tenkan-Sen and src > kijun-Sen : Strong uptrend detection and shown by green bars.
src < tenkan-Sen and src < kijun-Sen : Strong downtrend detection and shown by green bars.
src > tenkan-Sen and src < kijun-Sen : Better way to detect bottom reversals as if price comes above tenkan but remains below kijun; that’s early signs of recovery. Light red bars are used for this by default.
src < tenkan-Sen and src > kijun-Sen : Better way to detect top reversals as if price comes below tenkan but remains above kijun; that’s early signs of losing potential in uptrend. Dark Grey bars are used for this by default.
Kumo Coloring : Following steps are used to derive Kumo’s dynamic color:
Average of Senkou-span A and B is calculated.
RSI with 14 period of that average is calculated.
Gradient color based on calculated RSI values with 0-100 range is derived which is final Kumo color.
Chikou Span Coloring : Dynamic coloring from Chikou Filter is used as Indicator’s Chikou ’s color.
Signals Overlay : Red and Green small triangles are used as signals overlay.

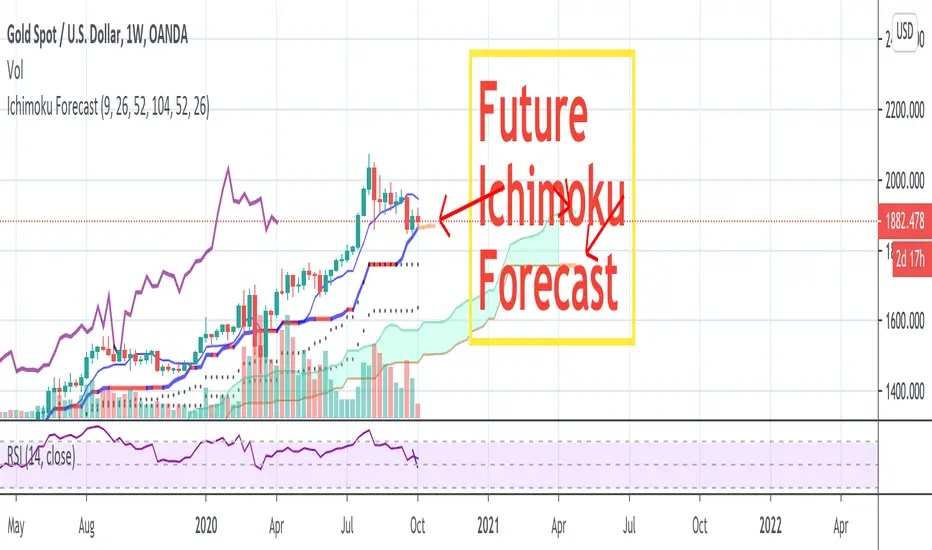
Future Ichimoku Forecast by AP +3FUTURE ICHIMOKU FORECAST by AP Demo+3
Hi every Ichimoku Users,
Ichimoku is one of my favorite indicators, it helps me define market trends, find entry and follow. But sometime, I must predict how its lines (clouds, tenkan, kijun) will go? by handmade with lot of try and time!
Are you agree with me?
In order to forecast future Ichimoku to help your trade more easy and profitable, I create the FUTURE ICHIMOKU FORECAST by AP Demo+3 indicator free for everyone.
FUTURE ICHIMOKU FORECAST strengths:
- Forecast future +3 candles will make clouds, tenkan, kijun go!
- Help you indentify easy trend when clouds change, kijun go up or down!
- Flexible to change colors, displacement, hide/show lines in its.
- Flexible and good for every timeframe: W, D, 4H, 1H and shorter.
- Flexible and good for every currencies, gold , future and more.
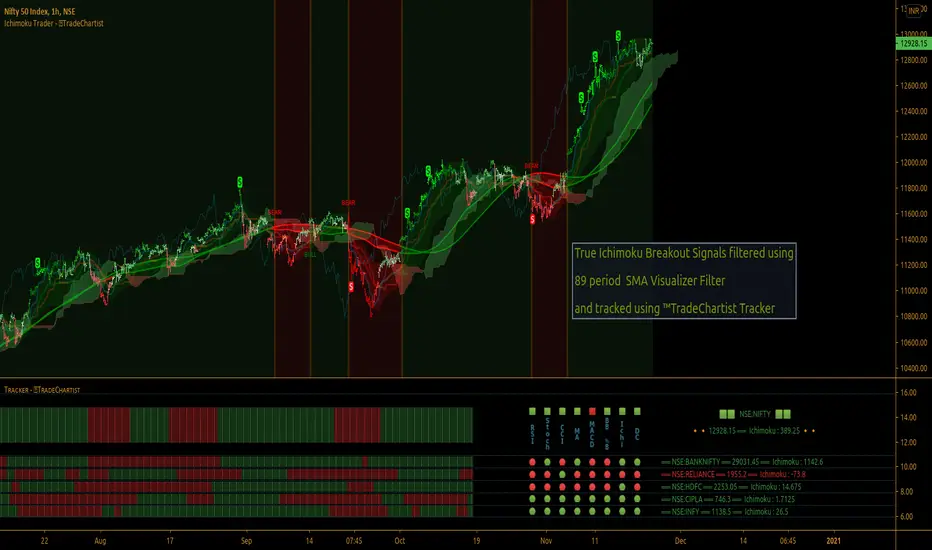
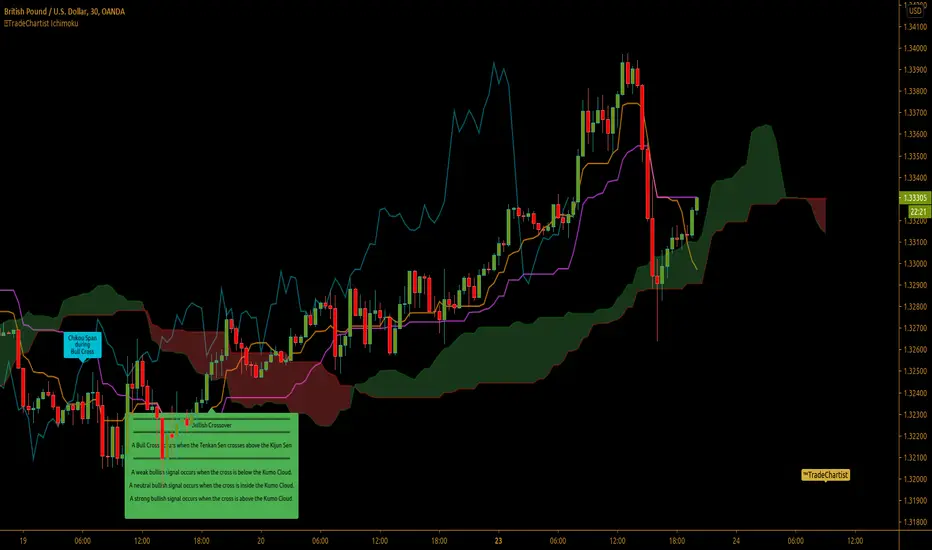
TradeChartist Ichimoku Trader ™TradeChartist Ichimoku Trader is an elegant and functional breakouts trading indicator that generates trade signals based on two types of breakouts - True Ichimoku Kumo Breakouts and Ichimoku Trade Bands Breakouts, which can be further filtered using ™TradeChartist MA Visualizer and/or using an external Filter.
===================================================================================================================
╔════════ 𝗖𝗹𝗼𝘂𝗱 𝗦𝗲𝘁𝘁𝗶𝗻𝗴𝘀 ═════════╗
Cloud Settings form the fundamental factor for this indicator to detect the breakouts. The settings for the Ichimoku Cloud is Automatic by default, but this can be changed based on the user preference from the settings under 𝐂𝐥𝐨𝐮𝐝 𝐓𝐲𝐩𝐞, which also includes a manual input option. Ichimoku traders can experiment different settings combinations under manual settings to suit their trading frequency and timeframe traded.
Ichimoku Cloud with its components can be displayed or hidden by enabling/disabling 𝐃𝐢𝐬𝐩𝐥𝐚𝐲 𝐈𝐜𝐡𝐢𝐦𝐨𝐤𝐮 𝐂𝐥𝐨𝐮𝐝. Also, Sʜᴏᴡ Iᴄʜɪᴍᴏᴋᴜ Cʀᴏssᴇs from the Cloud Settings plots tiny crosses on chart.
===================================================================================================================
╔═════════ 𝗕𝗮𝗻𝗱𝘀 𝗦𝗲𝘁𝘁𝗶𝗻𝗴𝘀 ════════╗
Even though the Ichimoku Trade Bands are derived from the Cloud Parameters, the Bᴀɴᴅ Wɪᴅᴛʜ (0.236 - 1) and Lᴏᴏᴋʙᴀᴄᴋ (5 - 200) influences the sensitivity and the width of the bands, which has an effect on the risk and reward expected from Ichimoku Trade Bands Breakout trade.
Trade Bands can be displayed or hidden by enabling/disabling 𝐃𝐢𝐬𝐩𝐥𝐚𝐲 𝐈𝐜𝐡𝐢𝐦𝐨𝐤𝐮 𝐓𝐫𝐚𝐝𝐞 𝐁𝐚𝐧𝐝𝐬. Also, the Bands mean line can be enabled or disabled using 𝐃𝐢𝐬𝐩𝐥𝐚𝐲 𝐓𝐫𝐚𝐝𝐞 𝐁𝐚𝐧𝐝𝐬 𝐌𝐞𝐚𝐧 𝐋𝐢𝐧𝐞 check box and its line width can be changed using Tʀᴀᴅᴇ Bᴀɴᴅs Mᴇᴀɴ Lɪɴᴇ Wɪᴅᴛʜ dropdown.
===================================================================================================================
╔═════════ 𝗠𝗔 𝗩𝗶𝘀𝘂𝗮𝗹𝗶𝘇𝗲𝗿 ═════════╗
MA Visualizer is a powerful and very useful original ™TradeChartist visual method to plot Moving Averages of the close price of the security for user specified look back period in a visually appealing style in the form of colour coded bands. MA Visualizer not only helps the trader spot the price action of the security relative to the moving average, but also paints a visual picture of the trend strength, which must be seen and used on chart to appreciate its elegance. One of 15 different types of Moving Averages can be used to visualize the price action.
Activate 𝗠𝗔 𝗩𝗶𝘀𝘂𝗮𝗹𝗶𝘇𝗲𝗿 and choose the MA type from MA Vɪsᴜᴀʟɪᴢᴇʀ Tʏᴘᴇ dropdown and entering the lookback period in MA Vɪsᴜᴀʟɪᴢᴇʀ ᴘᴇʀɪᴏᴅ input box. MA Visualizer colour theme can be be changed from MA Vɪsᴜᴀʟɪᴢᴇʀ Cᴏʟᴏʀ Sᴄʜᴇᴍᴇ dropdown.
The faster of the two set of bands that form the MA Visualizer reacts to price action faster and can be clearly seen from its change of colour from Bull Colour to Bear Colour or viceversa earlier than the slower set of bands. The fill colour between the bands also helps the user stay in a trade or exit a trade based on other confirmators.
===================================================================================================================
╔═══════ 𝗦𝗶𝗴𝗻𝗮𝗹𝘀 𝗮𝗻𝗱 𝗙𝗶𝗹𝘁𝗲𝗿𝘀 ═══════╗
Signal Type
True Ichimoku Kumo Breakout
Ichimoku traders mostly use the Kumo breakouts for trading based on several Bullish and Bearish conditions. For the sake of effective trade entries, trade entry plots for specific cloud events like Kumo twists, Tenkan Sen crossing Kijun Sen, price crossing cloud components etc have been intentionally ignored as Ichimoku traders often tend to visually trade them effectively.
Ichimoku Trade Bands Breakout
In addition to the True Kumo Breakouts, users of this script will be able to trade Ichimoku Trade Bands Breakouts. Ichimoku Trade Bands is an original ™TradeChartist model designed to detect early trend changes based on the Ichimoku settings. These bands are comprised of three plots - an upper band, a lower band and a mean line, namely and all are derived from the Ichimoku settings. The bands act as a filter and a breakout from bands' extreme boundaries signals a change in trend. The settings of the bands can be derived automatically or using manual input based on Ichimoku Cloud parameters, accessed from the indicator settings.
The Breakout Trade Entries can be further filtered by use of MA Visualizer or by using an external filter connected to the script.
===================================================================================================================
╔═════════ 𝗙𝗶𝗹𝘁𝗲𝗿 𝗦𝗲𝘁𝘁𝗶𝗻𝗴𝘀 ═════════╗
Filters are normally used to reduce noise in the Trade Entry Signals and they can be quite effective in helping the trader stay in trade and to minimize unproductive trade entries. Ichimoku Trader enables the user to use upto two trade filters - MA Visualizer and /or External Filter respectively.
Moving Averages are very effective trade filters and if the right Moving Average is used with right lookback period based on trade type and timeframe traded, they can be very effective in filtering trades.
Enabling 𝐔𝐬𝐞 𝐌𝐀 𝐕𝐢𝐬𝐮𝐚𝐥𝐢𝐳𝐞𝐫 𝐚𝐬 𝐓𝐫𝐚𝐝𝐞 𝐅𝐢𝐥𝐭𝐞𝐫 filters breakouts only when MA Visualizer agrees with the trend (which can be visualized using the fill colour between the MA Visualizer plots.
Enabling Fɪʟᴛᴇʀ Eᴀʀʟʏ Vɪsᴜᴀʟɪᴢᴇʀ Bʀᴇᴀᴋᴏᴜᴛs in addition filters breakouts even if price closed above the upper MA Visualizer plot without having to agree with fill colour.
In addition to MA Visualizer Filter, and external filter like RSI, MACD etc. can also be used by connecting to Ichimoku Trader under ╔═══ 𝗣𝗹𝘂𝗴 𝗙𝗶𝗹𝘁𝗲𝗿 𝗵𝗲𝗿𝗲 ═══ 🔌 dropdown by enabling 𝐔𝐬𝐞 𝐄𝐱𝐭𝐞𝐫𝐧𝐚𝐥 𝐅𝐢𝐥𝐭𝐞𝐫 𝐚𝐬 𝐓𝐫𝐚𝐝𝐞 𝐅𝐢𝐥𝐭𝐞𝐫. The external filter can be used as the only filter or in addition to MA Visualizer filter.
To get the external filter to work, Sɪɢɴᴀʟ Tʏᴘᴇ must be set right. For plots that are not oscillatory like Moving Averages, Super Trend etc., choose type as Non Oscillatory and for Oscillators like RSI, CCI, MACD etc., choose type as Oscillatory .
For Oscillators, levels must be specified for Fɪʟᴛᴇʀ Lᴇᴠᴇʟ ғᴏʀ ʟᴏɴɢs and Fɪʟᴛᴇʀ Lᴇᴠᴇʟ ғᴏʀ sʜᴏʀᴛs , especially if the Oscillator doesnt have 0 as mid line, like RSI. Even for 0 mid oscillators like CCI, filter levels like 100/-100 work effectively to filter noise.
Use 𝐓𝐫𝐚𝐝𝐞 𝐙𝐨𝐧𝐞𝐬 𝐁𝐚𝐜𝐤𝐠𝐫𝐨𝐮𝐧𝐝 𝐅𝐢𝐥𝐥 under 𝗨𝘀𝗲𝗳𝘂𝗹 𝗘𝘅𝘁𝗿𝗮𝘀 to paint the trade zones background. It helps visually see the effect of filters on the breakout entries and also the trade performance.
===================================================================================================================
╔═════════ 𝗨𝘀𝗲𝗳𝘂𝗹 𝗘𝘅𝘁𝗿𝗮𝘀 ═════════╗
Ichimoku Trader also includes the following useful extras
𝐓𝐫𝐚𝐝𝐞 𝐙𝐨𝐧𝐞𝐬 𝐁𝐚𝐜𝐤𝐠𝐫𝐨𝐮𝐧𝐝 𝐅𝐢𝐥𝐥 paints the trade zones in green and red as mentioned above.
Sʜᴏᴡ Hɪɢʜs ᴀɴᴅ Lᴏᴡs plots the highest highs of the Bull Zone and the lowest lows of the Bear Zone to help spot the wicks, support and resistance.
Tᴀᴋᴇ Pʀᴏғɪᴛ Bᴀʀs helps detect the volatility exhaustion prices and plots $ signs to help the trader take profits or move stop loss levels to secure gains or to reduce losses.
Vɪsᴜᴀʟɪᴢᴇʀ Cᴏʟᴏʀ Bᴀʀs paints the price bars with trend intensity and the user can opt from one of two themes under Bᴀʀ Cᴏʟᴏʀ Sᴄʜᴇᴍᴇ (Chilli and Flame).
The bar colors can be inverted by enabling Iɴᴠᴇʀᴛ Bᴀʀ Cᴏʟᴏʀs to see reverse bias with respect to the current trade direction.
===================================================================================================================
╔═════════ 𝗔𝗹𝗲𝗿𝘁𝘀 ═════════╗
Alerts can be created for Long and Short entries by using Once Per Bar Close as Alert Frequency. Entries are generated on Real time bars based on Breakout and filter conditions. It is recommended to wait for bar close before taking a position based on Ichimoku Trader Trade Entries.
The indicator does not repaint and can be confidently used for alerts and trade entries without worrying about signals disappearing.
™TradeChartist Ichimoku Trader 𝗧𝗿𝗲𝗻𝗱 𝗜𝗱𝗲𝗻𝘁𝗶𝗳𝗶𝗲𝗿 can also be connected to ™TradeChartist Plug and Trade to generate entries along with Targets, Stop Loss plots etc. Target and Stop Loss alerts can be created using Plug and Trade's Alerts system.
===================================================================================================================
There are several combinations of settings that can be tested on the security traded based on timeframe and risk/reward expectations. The indicator can be used for trade entries with filter combinations or can be used as standalone Visualizer for trend confirmations, levels etc. Following are a few examples using the Visualizer.
╔════════ 𝗘𝘅𝗮𝗺𝗽𝗹𝗲 𝗖𝗵𝗮𝗿𝘁𝘀 ════════╗
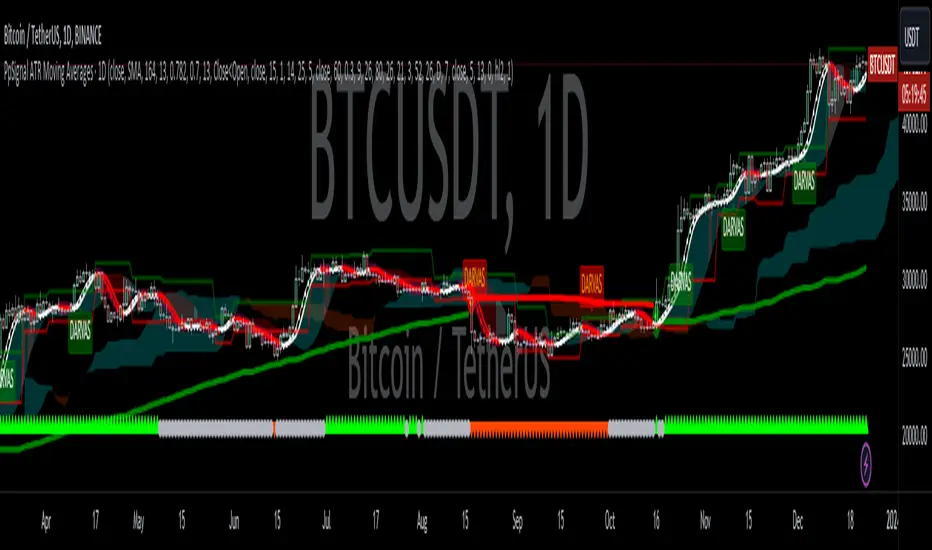
1. BTC-USDT 1hr True Ichimoku Kumo Breakout with no filters.
2. BTC-USDT 1hr Ichimoku Trade Bands (Default) Breakout with no filters.
3. BTC-USDT 1hr Ichimoku Trade Bands (Default) Breakout using 200 period Hull MA Visualizer filter.
4. AAPL 4hr Ichimoku Trade Bands (Default) Breakout using 200 period VIDYA MA Visualizer filter. Note: VIDYA is normally used for long term trades.
5. GBP-USD 5m True Ichimoku Kumo Breakout using 144 period TEMA MA Visualizer filter and Money Flow Index connected as external filter with 80/20 Filter values.
6. XAU-USD 1hr Ichimoku Trade Bands (Default) Breakout using 144 period TEMA MA Visualizer and Keltner Channels basis line as external non-oscillatory filter, connected to ™TradeChartist Plug and Trade using Ichimoku Trader 𝗧𝗿𝗲𝗻𝗱 𝗜𝗱𝗲𝗻𝘁𝗶𝗳𝗶𝗲𝗿.
7. SHITPERP 1hr Ichimoku Trade Bands (0.618 Band Width and Lookback 89 periods) using 50 period Zero-Lag EMA Visualizer Filter.
===================================================================================================================
Best Practice: Test with different settings first using Paper Trades before trading with real money
===================================================================================================================
This is not a free to use indicator. Get in touch with me (PM me directly if you would like trial access to test the indicator)
Premium Scripts - Trial access and Information
Trial access offered on all Premium scripts.
PM me directly to request trial access to the scripts or for more information.
===================================================================================================================
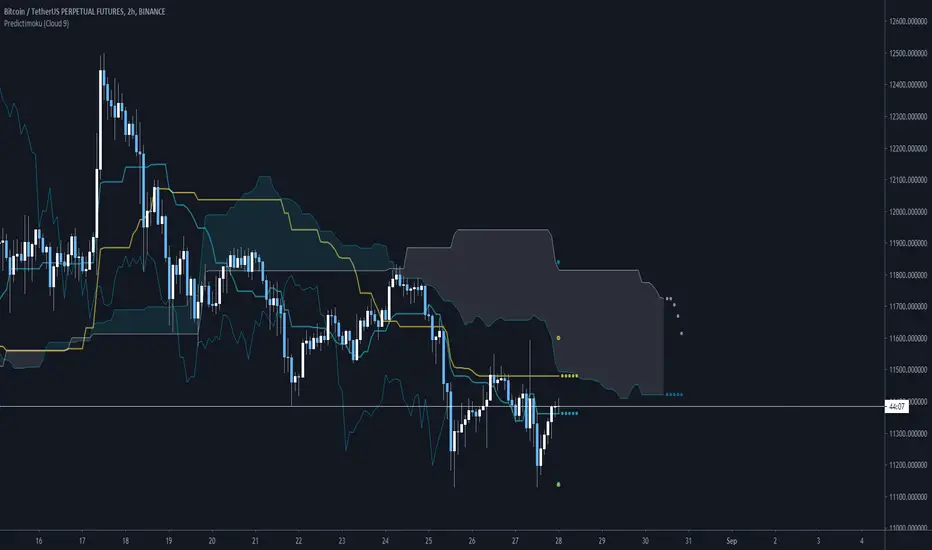
Predictimoku (Cloud 9) - Modified Ichimoku by Cryptorhythms [CR] Predictimoku (Cloud 9) - Modified Ichimoku by Cryptorhythms
📜Intro
New spin on the old standby ichimoku!
Predictimoku (Cloud 9): This indicator uses a proprietary algo to forecast the kijun tenkan & senkou spans accurately out into the future.
📋Background
Unfortunately you may have seen it around twitter as part of a paid for course with indicator set. These influencers claim its "their proprietary indicator". Well the truth is that the source code was stolen from me without payment by some folks who will remain nameless... Then they published the indicator as a private script to avoid moderation/ban (cowards!)
Lesson learned... this is why you never trust anyone until the money is in your hand. And if you see the indicator in the wild as part of some "guru's" overpriced course you will know who the thieves are!
But I wouldnt let that injustice or their shady behavior stand. So that now means you all will get access to it because I am providing it free for the public! :)
📋Features and How to Use
You use this indicator in all the same ways as you would use traditional ichimoku, the underlying structure is the same. Though the default settings are using doubled lookback lengths as per "crypto standard."
The extra functionality comes in the form of accurate and non repainting forecast of up to 17 bars for the kijun, tenkan and senkou spans! This can be useful in many ways for instance it can show you ahead of time when a kumo twist will happen, or a tenkan/kijun cross, etc!
💠Here is an example of the 17 bar forecast:
💠Here is an example of the Trading Range option to show you where price would need to go to force a recalculation of the forecasts. It also provides areas of interest for PA reactions.
💠Last an example of the fibonacci spread. By default the Auto Fib's lookback length is set to 60 to match the kijun lookback. This generally produces a nice framework for near future price action.
💠Look for some more new and unique ichimoku based indicators coming soon from us! :)
About Us
👍 We hope you enjoyed this indicator and find it useful! We post free crypto analysis, strategies and indicators regularly. This is our 84th script on Tradingview! Check signature for more information.
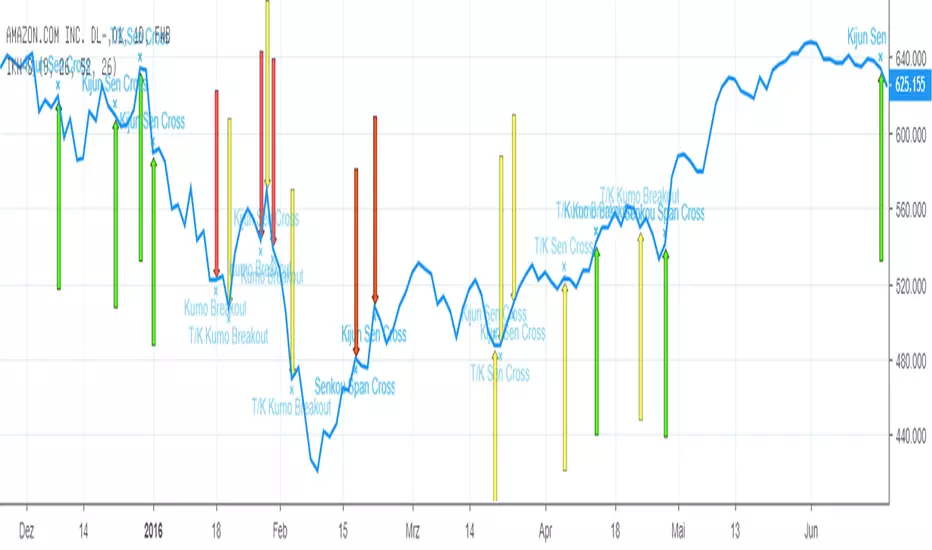
™TradeChartist - Show and Tell - Ichimoku Cloud™TradeChartist Show and Tell - Ichimoku Cloud is a free and easy to use script that helps anyone learn and understand the Ichimoku cloud by using the 'Show and Tell' option from the indicator settings and by choosing the Ichimoku component/Signal from the dropdown box. For individuals new to Ichimoku Cloud , Show and Tell option will help explain the components and signals of Ichimoku Cloud on the chart without having to navigate away from price action, thus making it easier to learn and understand Ichimoku cloud with respect to chart price action on the corresponding time frame.
The indicator automatically detects cryptocurrencies as it uses different settings specific to cryptocurrencies market - (20,60,120,30) respectively as opposed to classic - (9,26,52,26).
When 'Show and Tell' is unchecked from indicator settings, the script detects signals and important Ichimoku events like Bull/Bear crosses, Bullish/Bearish Kumo Twists, Bullish/Bearish Kumo Breakouts etc and plots labels on chart. To turn off this feature, just uncheck 'Labels' from the styles tab under the indicator settings.
This is a free to use indicator. Give a thumbs up or leave a comment if you like the script.
Ichimoku Cloud ForecastUsing doubled crypto settings, forecast Tenkan and Kijun lines, assuming price remains neutral (constant).
Tenkan - 14 periods
Kijun - 20 periods

Custom Ichimoku Cloud with Signals📊 OVERVIEW
This indicator generates trading signals based on Ichimoku Cloud breakouts and breakdowns. It identifies when price decisively moves through the cloud boundaries, filtering out false signals from consolidation periods.
📈 KEY FEATURES
- Transition-based signals only when price breaks through cloud
- Candle body must completely clear cloud (no touching)
- Alternating signal system prevents consecutive duplicate signals
- Built-in alerts for automated notifications
- Standard Ichimoku components included
⚙️ HOW IT WORKS
BUY SIGNAL: Triggered when candle body moves completely above cloud after being inside/below
SELL SIGNAL: Triggered when candle body moves completely below cloud after being inside/above
🎯 USE CASES
- Trend continuation trading
- Breakout trading strategies
- Cloud support/resistance analysis
- Multi-timeframe analysis
📝 PARAMETERS
- Adjustable Ichimoku periods (Conversion, Base, Lagging Span B)
- Customizable lookback period for transition detection
- Visual signal markers with alerts
⚠️ DISCLAIMER
This indicator is for educational purposes. Past performance doesn't guarantee future results. Always use proper risk management and combine with other analysis methods.
⚠️ DISCLAIMER & RISK WARNING
This indicator is provided for informational and educational purposes only and should not be considered as financial advice.
TRADING RISKS:
- Trading involves substantial risk of loss and is not suitable for all investors
- Past performance is not indicative of future results
- You can lose more than your initial investment
- Never trade with money you cannot afford to lose
NO GUARANTEES:
- This indicator does not guarantee profits or predict market movements with certainty
- Signals are based on mathematical calculations and may produce false signals
- Market conditions can change, making any strategy ineffective
- Success depends on multiple factors beyond this indicator
USER RESPONSIBILITY:
- You are solely responsible for your trading decisions
- Always conduct your own research and analysis
- Consider consulting with a qualified financial advisor
- Use proper risk management and position sizing
- Test thoroughly on demo accounts before live trading
TECHNICAL LIMITATIONS:
- Indicator may be subject to repainting in real-time conditions
- Historical results do not represent actual trading
- Signals are for analysis only, not automatic trade execution
- Performance varies across different timeframes and instruments
By using this indicator, you acknowledge that you understand these risks and accept full responsibility for your trading outcomes. The author assumes no liability for any losses incurred.
NOT FINANCIAL ADVICE - FOR EDUCATIONAL PURPOSES ONLY

PpSignal Ichimoku Kinko HyoWhat is the Ichimoku Kinko Hyo?
The Ichimoku Kinko Hyo, or Ichimoku for short, is a technical indicator that is used to gauge momentum along with future areas of support and resistance. The all-in-one technical indicator is comprised of five lines called the tenkan-sen, kijun-sen, senkou span A, senkou span B and chikou span.
Understanding Ichimoku Kinko Hyo
The Ichimoku Kinko Hyo indicator was originally developed by a Japanese newspaper writer to combine various technical strategies into a single indicator that could be easily implemented and interpreted. In Japanese, "ichimoku" translates to "one look," meaning traders only have to take one look at the chart to determine momentum, support, and resistance.
Ichimoku may look very complicated to novice traders that haven't seen it before, but the complexity quickly disappears with an understanding of what the various lines mean and why they are used.
The Ichimoku indicator is best used in conjunction with other forms of technical analysis despite its goal of being an all-in-one indicator.
Ichimoku Kinko Hyo Interpretation
There are five key components to the Ichimoku indicator:
Tenkan-sen: The tenkan-sen, or conversion line, is calculated by adding the highest high and the highest low over the past nine periods and then dividing the result by two. The resulting line represents a key support and resistance level, as well as a signal line for reversals.
Kijun-sen: The kijun-sen, or base line, is calculated by adding the highest high and the lowest low over the past 26 periods and dividing the result by two. The resulting line represents a key support and resistance level, a confirmation of a trend change, and can be used as a trailing stop-loss point.
Senkou Span A: The senkou span A, or leading span A, is calculated by adding the tenkan-sen and the kijun-sen, dividing the result by two, and then plotting the result 26 periods ahead. The resulting line forms one edge of the kumo - or cloud - that's used to identify future areas of support and resistance.
Senkou Span B: The senkou span B, or leading span B, is calculated by adding the highest high and the lowest low over the past 52 periods, dividing it by two, and then plotting the result 26 periods ahead. The resulting line forms the other edge of the kumo that's used to identify future areas of support and resistance.
Chikou Span: The chikou span, or lagging span, is the current period's closing price plotted 26 days back on the chart. This line is used to show possible areas of support and resistance.
Example of an Ichimoku Kinko Hyo Chart
The following is an example of an Ichimoku indicator plotted on a chart:
Indicator component
Alarm
Have alarm when price and Chicouspan cross Kumo cloud.
Have Alarm when tekn Sen 9 cross Kijusen 26.
Have Hiken ashi buy and sell alarm
Other tools
Mtf cloud.
Triple Timeframe IchimokuVi presento il Triple Timeframe Ichimoku.
Questo indicatore applica tre Ichimoku completi al vostro grafico usando fino a ben 3 timeframe diversi:
Timeframe Attuale (quello impostato sul grafico che state visualizzando)
Timeframe B (personalizzabile tra i seguenti TF : 1m, 5m, 15m, H1, H2, H4, D, W, M)
Timeframe C (personalizzabile tra i seguenti TF : 1m, 5m, 15m, H1, H2, H4, D, W, M)
Il risultato è quello di avere immediatamente sott'occhio l'andamento dei prezzi senza dover fare zapping tra i vari timeframe: tutto chiaro subito!
L'indicatore è completamente personalizzabile, potete infatti:
Decidere quanti (da 1 a 3) e quali Ichimoku visualizzare
Scegliere per ogni Ichimoku se visualizzare o meno le linee dell'indicatore (Tenkan, Kijun e Laggin)
Scegliere per ogni Ichimoku se visualizzare o meno le nuvole dell'indicatore (SSA, SSB e Kumo)
Personalizzare i colori di ogni singola linea di ogni singolo Ichimoku
L'indicatore è estremamente utile per strategie basare sull'indicatore Ichimoku che richiedono il controllo su diversi Timeframe.
Buon trading a tutti!

iMoku (Ichimoku Complete Tool) - The Quant Science iMoku™ is a professional all-in-one solution for the famous Ichimoku Kinko Hyo indicator.
The algorithm includes:
1. Backtesting spot
2. Visual tool
3. Auto-trading functions
With iMoku you can test four different strategies.
Strategy 1: Cross Tenkan Sen - Kijun Sen
A long position is opened with 100% of the invested capital ($1000) when "Tenkan Sen" crossover "Kijun Sen".
Closing the long position on the opposite condition.
There are 3 different strength signals for this strategy: weak, normal, strong.
Weak : the signal is weak when the condition is true and the price is above the 'Kumo'
Normal : the signal is normal when the condition is true and the price is within the 'Kumo'
Strong : the signal is strong when the condition is true and the price is below the 'Kumo'
Strategy 2: Cross Price - Kijun Sen
A long position is opened with 100% of the invested capital ($1000) when the price crossover the 'Kijun Sen'.
Closing the long position on the opposite condition.
There are 3 different strength signals for this strategy: weak, normal, strong.
Weak : the signal is weak when the condition is true and the price is above the 'Kumo'
Normal : the signal is normal when the condition is true and the price is inside the 'Kumo'
Strong : the signal is strong when the condition is true and the price is below the 'Kumo'
Strategy 3: Kumo Breakout
A long position is opened with 100% of the invested capital ($1000) when the price breakup the 'Kumo'.
Closing the long position with a percentage stop loss and take profit on the invested capital.
Strategy 4: Kumo Twist
A long position is opened with 100% of the invested capital ($1000) when the 'Kumo' goes from negative to positive (called "Twist").
Closing the long position on the opposite condition.
There are 2 different strength signals for this strategy: weak, and strong.
Weak : the signal is weak when the condition is true and the price is above the 'Kumo'
Strong : the signal is strong when the condition is true and the price is below the 'Kumo'
This script is compliant with algorithmic trading.
You can use this script with trading terminals such as 3Commas or CryptoHopper. Connecting this script is very easy.
1. Enter the user interface
2. Select and activate a strategy
3. Copy your bot's links into the dedicated fields
4. Create and activate alert
Disclaimer: algorithmic trading involves risk, the user should consider aspects such as slippage, liquidity and costs when evaluating an asset. The Quant Science is not responsible for any kind of damage resulting from use of this script. By using this script you take all the responsibilities and risks.

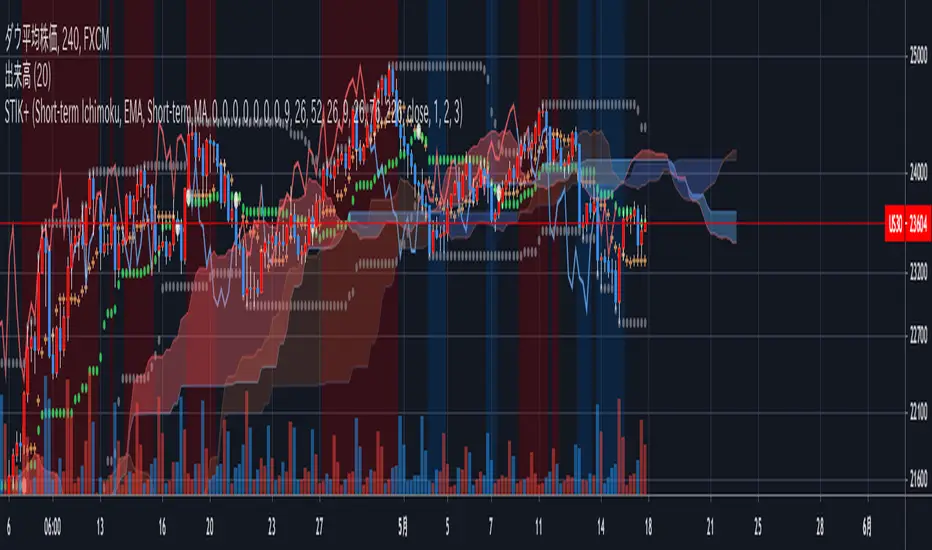
Short-Term Ichimoku Kinko-hyo+This Ichimoku Kinko-Hyo is an indicator which has been changed for short-term trading and, It has a “target price theory(one of three theory of Ichimoku Kinko-Hyo) function.”
Also, In this indicator, It can be plotting the “Span model”, “Super Bollinger Bands” which has Invented by a Japanese currency dealer Toshihiko Masaki, And Moving Average.
In addition, you can select setting only “clouds” and “Lagging span” or displaying Default Ichimoku Kinko-Hyo.
This indicator is modified original Ichimoku Kinko-Hyo, but It made based on the true usage of Ichimoku Kinko-Hyo.
For the evidence, I referred to the book supervised by Ichimoku-Sanjin the third generation.
Describe below about features↓↓↓.
- 2nd Cloud to check relation two Lead Lines and Lagging span.
- Background-color for discovering “Three Roles Improvement (In Japanese: 三役好転)” and “Three Roles Reversal (In Japanese: 三役逆転)”.
- Signal of Crossing Base Line and Conversion Line.
- mode selection of Ichimoku Kinko Hyo.
- Calculation feature for Target Price theory.
- A switch to replace Base Line and Conversion Line with 3 Moving Average lines.
- And others...
Hophop Ichimoku Cloud with Fibonacci RetracementThis indicator automatically draws Fibonacci retracement levels on top of the Ichimoku Cloud indicator
There are plenty of great Auto Fib generator indicators, particularly
by KIVANCfr3762 is the one I like a lot.
However if you use Ichimoku Cloud strategy with Fibonacci levels for the cloud settings this indicator will be quite handy on saving the hassle of adjusting the look back period of the auto fib with baseline of Ichimoku,
and also it will save you from using 1 indicators per chart limit which may be an issue for free plan users
BTC Tip: 39bwXN1chms1yHskBaYwz76UhDakc7grJ7
LTC Tip: MGD3U9dBCBVctwnoCa1grU8ompxG6hUhMk
ETH Tip: 0xEE9684a5aceE85036527aB48E596DeE4627bD84b
Bu indikator Ichimoku Cloud indikatoru uzerinde otomatik olarak Fibonacci retracement degerlerini cizmektedir,
Eger sadece otomatik Fibonacci retracement indikatoru ariyorsaniz, KIVANCfr3762 a ait olan indikatorunu cok basarili buluyorum ve onu kullanmanizi tavsiye ederim
Ancak siklikla Ichimoku Cloud ve Fibonacci Retracement kullaniyor iseniz her seferinde iki indikatorun ayarlarini degistirmekten kacinmak ve ayrica grafik uzerindeki indikator limitinden tasarruf etmek isterseniz bu indikatorun isinize yarayacagini dusunuyorum
Bu indikatorden faydalaniyor ve benzerleri uzerinde calismam icin destek olmak isterseniz
BTC Bahsis: 39bwXN1chms1yHskBaYwz76UhDakc7grJ7
LTC Bahsis: MGD3U9dBCBVctwnoCa1grU8ompxG6hUhMk
ETH Bahsis: 0xEE9684a5aceE85036527aB48E596DeE4627bD84b

CoG RSI Momenum Ichimoku CloudThis indicator is inspired by "RSI ICHIMOKU CLOUD".
Script plots price bars based on selected indicator with Ichimoku Cloud around it.
In my version I have added different oscillators for bar calculations.
Specifically you can choose from:
Center of Gravity(CoG)
Momentum
RSI

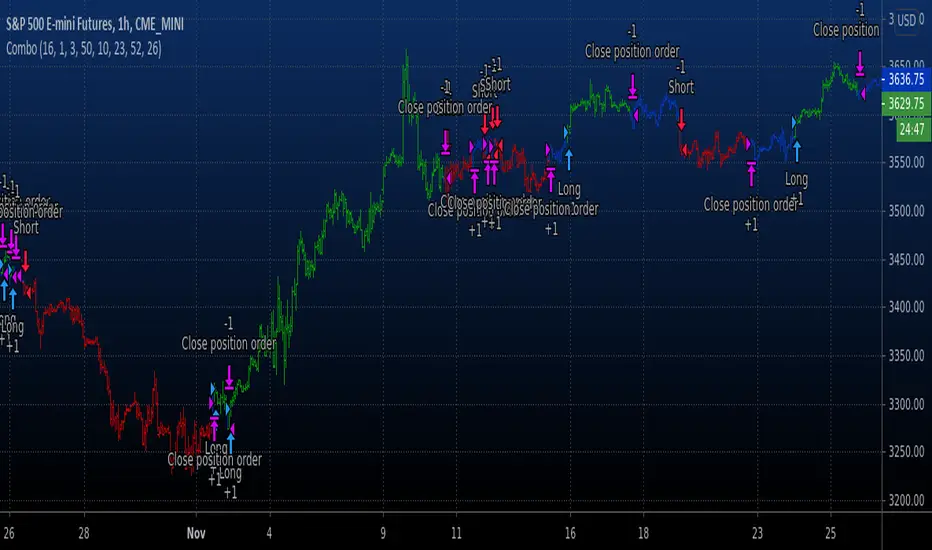
Combo Backtest 123 Reversal & Ichimoku2c This is combo strategies for get a cumulative signal.
First strategy
This System was created from the Book "How I Tripled My Money In The
Futures Market" by Ulf Jensen, Page 183. This is reverse type of strategies.
The strategy buys at market, if close price is higher than the previous close
during 2 days and the meaning of 9-days Stochastic Slow Oscillator is lower than 50.
The strategy sells at market, if close price is lower than the previous close price
during 2 days and the meaning of 9-days Stochastic Fast Oscillator is higher than 50.
Second strategy
Ichimoku Strategy
WARNING:
- For purpose educate only
- This script to change bars colors.

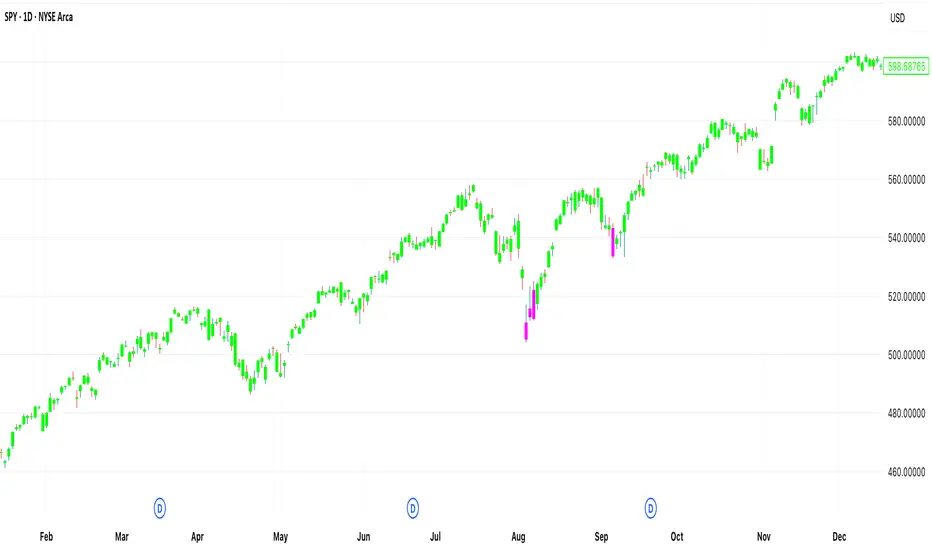
Ichimoku Lagging Background ColorThis script colors the background, 26 bars ago, based upon the lagging line being above or below the closing price of 26 bars ago. The lagging line is used as a confirmation for your current entry.
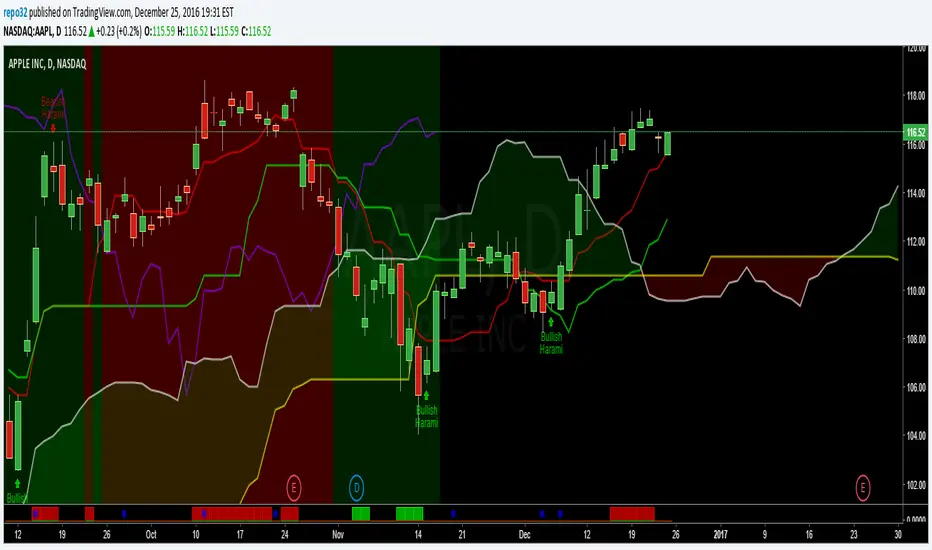
Ichimoku Kincho Hyo - Buy/Sell SignalsThe following (neutral/strong) signals are implemented:
Tenkan Sen/ Kijun Sen Komu Breakout
Tenkan Sen/ Kijun Sen Cross
Kijun Sen Cross
Kumo Breakout
Senkou Span Cross
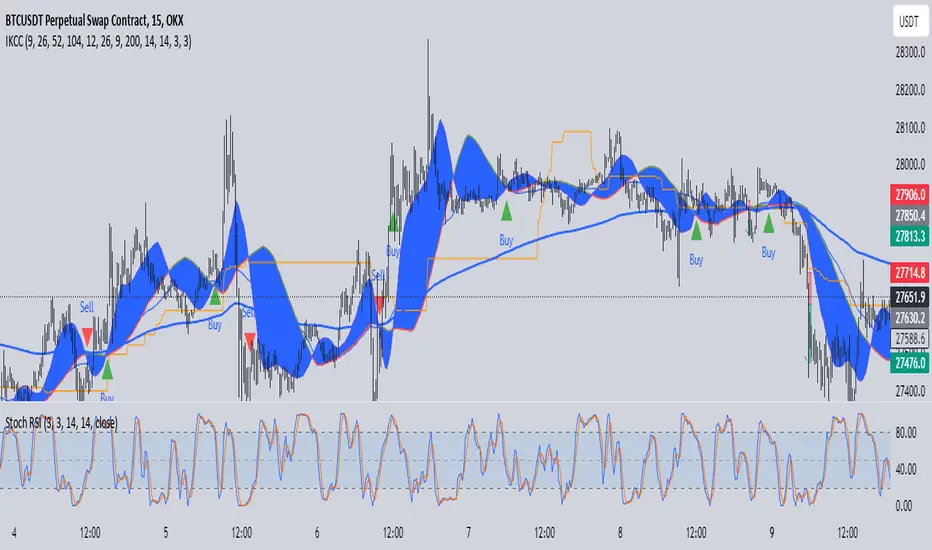
IchimokuBuy Sell With Stoch RSIIchimoku Kumo Cloud Crossover Indicator
The "Ichimoku Kumo Cloud Crossover" indicator is a custom technical analysis tool designed for use in the TradingView platform. This indicator is built to assist traders in identifying potential buy and sell signals based on a combination of Ichimoku Cloud analysis, Moving Average Convergence Divergence (MACD), Exponential Moving Average (EMA), Relative Strength Index (RSI), and Stochastic RSI.
Key Components and Parameters:
Ichimoku Kumo Cloud Calculation:
The Ichimoku Kumo Cloud is calculated using the Ichimoku Cloud's Conversion Line and Base Line.
Conversion Line, Base Line, Leading Span 1, and Leading Span 2:
These are key components of the Ichimoku Cloud, and they help identify trends and potential support/resistance levels in the market.
MACD Oscillator:
The Moving Average Convergence Divergence (MACD) is used to gauge the strength and direction of the trend.
EMA 200 (Exponential Moving Average):
The EMA 200 is a long-term moving average used to identify the overall trend direction.
RSI (Relative Strength Index):
The RSI is a momentum oscillator that measures the speed and change of price movements, helping to identify overbought and oversold conditions.
Stochastic RSI (Stoch RSI):
Stoch RSI is calculated based on the RSI values and helps to identify overbought and oversold conditions in a more dynamic manner.
Signal Generation:
The indicator generates buy and sell signals based on the following criteria:
Buy Signal (Long Position):
The Conversion Line crosses above the Base Line (Ichimoku Cloud crossover).
The closing price is above the EMA 200, indicating a bullish bias.
The RSI is between 50 and 70, suggesting the potential for an uptrend.
The MACD Histogram is positive, indicating increasing bullish momentum.
The high price is at least 25% above the EMA 200.
Sell Signal (Short Position):
The Conversion Line crosses below the Base Line (Ichimoku Cloud crossover).
The closing price is below the EMA 200, indicating a bearish bias.
The RSI is between 20 and 50, suggesting the potential for a downtrend.
The MACD Histogram is negative, indicating increasing bearish momentum.
The low price is at least 25% below the EMA 200.
Stoch RSI Filter:
Additionally, a filter based on Stoch RSI slope is applied. The indicator will only open a position if the Stoch RSI is declining for short positions (sell) and rising for long positions (buy).
Visualization:
Buy signals are marked with green triangles below the bars.
Sell signals are marked with red triangles above the bars.
The Ichimoku Cloud is plotted in the background, with cloud colors changing based on whether the Conversion Line or Base Line is higher.
This indicator can be a valuable tool for traders looking to combine multiple technical analysis techniques to make informed trading decisions in the financial markets.
[DEM] Ichimoku Bars Ichimoku Bars is designed to color price bars based on their relationship to the Ichimoku Cloud (Kumo) by comparing the current close price to both Leading Span A and Leading Span B from the traditional Ichimoku system, but with added smoothing modifications. The indicator calculates the standard Ichimoku components using Donchian midlines for the Conversion and Base lines, then creates smoothed versions of Leading Span A (20-period RMA of the average between Conversion and Base lines) and Leading Span B (20-period RMA of the 52-period Donchian midline), both displaced forward by the lagging span period. Bars are colored green when price is above both leading spans (indicating strong bullish conditions above the cloud), red when price is below both leading spans (indicating strong bearish conditions below the cloud), and magenta when price is within the cloud (indicating neutral or transitional conditions), providing traders with immediate visual feedback about price position relative to the Ichimoku equilibrium zone.
RSI Ichimoku-like (Subchart) tohungmcThe RSI Ichimoku-like (Subchart) indicator offers a novel approach to technical analysis by uniquely combining the Relative Strength Index (RSI) with the principles of the Ichimoku Kinko Hyo system. Unlike traditional Ichimoku, which is applied to price data, this indicator innovatively uses RSI values to construct Ichimoku components (Conversion Line, Base Line, Leading Span 1, Leading Span 2, and Cloud). Displayed on a separate subchart, it provides traders with a powerful tool to analyze momentum and trend dynamics in a single, intuitive view.
Unique Features
Innovative RSI-based Ichimoku System: By applying Ichimoku calculations to RSI instead of price, this indicator creates a momentum-driven trend analysis framework, offering a fresh perspective on market dynamics.
Cloud Visualization: The cloud (formed between Leading Span 1 and 2) highlights bullish (green) or bearish (red) momentum zones, helping traders identify trend strength and potential reversals.
Customizable Parameters: Adjust RSI and Ichimoku periods to suit various trading styles and timeframes.
Subchart Design: Keeps your price chart clean while providing a dedicated space for momentum and trend analysis.
Components
RSI Line: A 14-period RSI (customizable) plotted in blue, with overbought (70) and oversold (30) levels marked for quick reference.
Conversion Line: Average of the highest and lowest RSI over 9 periods, acting as a short-term momentum indicator.
Base Line: Average of the highest and lowest RSI over 26 periods, serving as a medium-term trend guide.
Leading Span 1: Average of Conversion and Base Lines, shifted forward 26 periods.
Leading Span 2: Average of the highest and lowest RSI over 52 periods, shifted forward 26 periods.
Cloud: The area between Leading Span 1 and 2, colored green (bullish) when Span 1 is above Span 2, and red (bearish) when Span 2 is above Span 1.
How to Use
Momentum Analysis:
Monitor the RSI line for overbought (>70) or oversold (<30) conditions to spot potential reversals.
A RSI crossing above 30 or below 70 can indicate shifts in momentum.
Trend Identification:
When the RSI is above the cloud and the cloud is green, it suggests bullish momentum.
When the RSI is below the cloud and the cloud is red, it indicates bearish momentum.
Crossovers:
RSI crossing above the Conversion or Base Line may signal bullish opportunities, especially if aligned with a green cloud.
RSI crossing below these lines may suggest bearish opportunities, particularly with a red cloud.
Cloud Breakouts:
A RSI breaking through the cloud can signal a potential trend change, with the cloud’s color indicating the direction.
Customization:
Adjust the RSI Period (default: 14), Conversion Line Period (default: 9), Base Line Period (default: 26), and Leading Span 2 Period (default: 52) to match your trading timeframe or strategy.
Settings
RSI Period: Default 14. Increase for smoother signals or decrease for higher sensitivity.
Conversion Line Period: Default 9. Adjust for short-term momentum sensitivity.
Base Line Period: Default 26. Modify for medium-term trend analysis.
Leading Span 2 Period: Default 52. Tune for long-term trend context.
Why Closed Source?
The unique methodology of applying Ichimoku calculations to RSI, combined with optimized subchart visualization, represents a proprietary approach to momentum and trend analysis. Protecting the source code ensures the integrity of this innovative concept while allowing traders worldwide to benefit from its functionality.
Notes
This indicator does not generate explicit Buy/Sell signals, giving traders flexibility to interpret signals based on their strategies.
Best used in conjunction with other technical tools (e.g., support/resistance, candlestick patterns) for confirmation.
Suitable for all timeframes, from intraday to long-term trading.

Weighted Ichimoku StrategyLSE:HSBA
The Ichimoku Kinko Hyo indicator is a comprehensive tool that combines multiple signals to identify market trends and potential buying/selling opportunities. My weighted variant of this strategy attempts to assign specific weights to each signal, allowing for a more nuanced and customizable approach to trend identification. The intent is to try and make a more informed trading decision based on the cumulative strength of various signals.
I've tried not to make it a mishmash of this and that + MACD + RSI and on and on; most people have their preferred indicator that focuses on just that that they can use in conjunction.
The signals used can be grouped into two groups the 'Core Ichimoku Signals' & the 'Additional Signals' (at the end you will find the signals and their assigned weights followed by the thresholds where they align).
The Core Ichimoku Signals are the primary signals used in Ichimoku analysis, including Kumo Breakout, Chikou Cross, Kijun Cross, Tenkan Cross, and Kumo Twist.
While the Additional Signals provide further insights and confirmations, such as Kijun Confirmation, Tenkan-Kijun Above Cloud, Chikou Above Cloud, Price-Kijun Cross, Chikou Span Signal, and Price Positioning.
Entries are triggered when the cumulative weight of bullish signals exceeds a specified buy threshold, indicating a strong uptrend or potential trend reversal.
Exits are initiated when the cumulative weight of bearish signals surpasses a specified sell threshold, or when additional conditions such as consolidation patterns or ATR-based targets are met.
There are various exit types that you can choose between, which can be used separately or in conjunction with one another. As an example you might want to exit on a different condition during consolidation periods than during other periods or just use ATR with some other backstop.
They are listed in evaluation order i.e. ATR trumps all, Consolidation exit trumps the regular Kumo sell and so on:
**ATR Sell**: Exits trades based on ATR-based profit targets and stop-losses.
**Consolidation Exit**: Exits trades during consolidation periods to reduce drawdown.
**Sell Below Kumo**: Exits trades when the price is below the Kumo, indicating a potential downtrend.
**Sell Threshold**: Exits trades when the cumulative weight of bearish signals surpasses a specified sell threshold.
There are various 'filters' which are really behavior modifiers:
**Kumo Breakout Filter**: Requires price to close above the Kumo for buy signals (essentially a entry delay).
**Whipsaw Filter**: Ensures trend strength over specified days to reduce false signals.
**Buy Cooldown**: Prevents new entries until half the Kijun period passes after an exit (prevents flapping).
**Chikou Filter**: Delays exits unless the previous close is below the Chikou Span.
**Consolidation Trend Filter**: Prevents consolidation exits if the trend is bullish (rare, but happens).
Then there are some debugging options. Ichimoku periods have some presets (personally I like 8/22/44/22) but are freely configurable, preset to the traditional values for purists.
The list of signals and most thresholds follow, play around with them. Thats all.
Cheers,
**Core Ichimoku Signals**
**Kumo Breakout**
- 30 (Bullish) / -30 (Bearish)
- Indicates a strong trend when the price breaks above (bullish) or below (bearish) the Kumo (cloud). This signal suggests a significant shift in market sentiment.
**Chikou Cross**
- 20 (Bullish) / -20 (Bearish)
- Shows the relationship between the Chikou Span (lagging span) and the current price. A bullish signal occurs when the Chikou Span is above the price, indicating a potential uptrend. Conversely, a bearish signal occurs when the Chikou Span is below the price, suggesting a downtrend.
**Kijun Cross**
- 15 (Bullish) / -15 (Bearish)
- Signals trend changes when the Tenkan-sen (conversion line) crosses above (bullish) or below (bearish) the Kijun-sen (base line). This crossover is often used to identify potential trend reversals.
**Tenkan Cross**
- 10 (Bullish) / -10 (Bearish)
- Indicates short-term trend changes when the price crosses above (bullish) or below (bearish) the Tenkan-sen. This signal helps identify minor trend shifts within the broader trend.
**Kumo Twist**
- 5 (Bullish) / -5 (Bearish)
- Shows changes in the Kumo's direction, indicating potential trend shifts. A bullish Kumo Twist occurs when Senkou Span A crosses above Senkou Span B, and a bearish twist occurs when Senkou Span A crosses below Senkou Span B.
**Additional Signals**
**Kijun Confirmation**
- 8 (Bullish) / -8 (Bearish)
- Confirms the trend based on the price's position relative to the Kijun-sen. A bullish signal occurs when the price is above the Kijun-sen, and a bearish signal occurs when the price is below it.
**Tenkan-Kijun Above Cloud**
- 5 (Bullish) / -5 (Bearish)
- Indicates a strong bullish trend when both the Tenkan-sen and Kijun-sen are above the Kumo. Conversely, a bearish signal occurs when both lines are below the Kumo.
**Chikou Above Cloud**
- 5 (Bullish) / -5 (Bearish)
- Shows the Chikou Span's position relative to the Kumo, indicating trend strength. A bullish signal occurs when the Chikou Span is above the Kumo, and a bearish signal occurs when it is below.
**Price-Kijun Cross**
- 2 (Bullish) / -2 (Bearish)
- Signals short-term trend changes when the price crosses above (bullish) or below (bearish) the Kijun-sen. This signal is similar to the Kijun Cross but focuses on the price's direct interaction with the Kijun-sen.
**Chikou Span Signal**
- 10 (Bullish) / -10 (Bearish)
- Indicates the trend based on the Chikou Span's position relative to past price highs and lows. A bullish signal occurs when the Chikou Span is above the highest high of the past period, and a bearish signal occurs when it is below the lowest low.
**Price Positioning**
- 10 (Bullish) / -10 (Bearish)
- Shows indecision when the price is between the Tenkan-sen and Kijun-sen, indicating a potential consolidation phase. A bullish signal occurs when the price is above both lines, and a bearish signal occurs when the price is below both lines.
**Confidence Level**: Highly Sensitive
- **Buy Threshold**: 50
- **Sell Threshold**: -50
- **Notes / Significance**: ~2–3 signals, very early trend detection. High sensitivity, may capture noise and false signals.
**Confidence Level**: Entry-Level
- **Buy Threshold**: 58
- **Sell Threshold**: -58
- **Notes / Significance**: ~3–4 signals, often Chikou Cross or Kumo Breakout. Very sensitive, risks noise (e.g., false buys in choppy markets).
**Confidence Level**: Entry-Level
- **Buy Threshold**: 60
- **Sell Threshold**: -60
- **Notes / Significance**: ~3–4 signals, Kumo Breakout or Chikou Cross anchors. Entry point for early trends.
**Confidence Level**: Moderate
- **Buy Threshold**: 65
- **Sell Threshold**: -65
- **Notes / Significance**: ~4–5 signals, balances sensitivity and reliability. Suitable for moderate risk tolerance.
**Confidence Level**: Conservative
- **Buy Threshold**: 70
- **Sell Threshold**: -70
- **Notes / Significance**: ~4–5 signals, emphasizes stronger confirmations. Reduces false signals but may miss some opportunities.
**Confidence Level**: Very Conservative
- **Buy Threshold**: 75
- **Sell Threshold**: -75
- **Notes / Significance**: ~5–6 signals, prioritizes high confidence. Minimizes risk but may enter trades late.
**Confidence Level**: High Confidence
- **Buy Threshold**: 80
- **Sell Threshold**: -80
- **Notes / Significance**: ~6–7 signals, very strong confirmations needed. Suitable for cautious traders.
**Confidence Level**: Very High Confidence
- **Buy Threshold**: 85
- **Sell Threshold**: -85
- **Notes / Significance**: ~7–8 signals, extremely high confidence required. Minimizes false signals significantly.
**Confidence Level**: Maximum Confidence
- **Buy Threshold**: 90
- **Sell Threshold**: -90
- **Notes / Significance**: ~8–9 signals, maximum confidence level. Ensures trades are highly reliable but may result in fewer trades.
**Confidence Level**: Ultra Conservative
- **Buy Threshold**: 100
- **Sell Threshold**: -100
- **Notes / Significance**: ~9–10 signals, ultra-high confidence. Trades are extremely reliable but opportunities are rare.
**Confidence Level**: Extreme Confidence
- **Buy Threshold**: 110
- **Sell Threshold**: -110
- **Notes / Significance**: All signals align, extreme confidence. Trades are almost certain but very few opportunities.

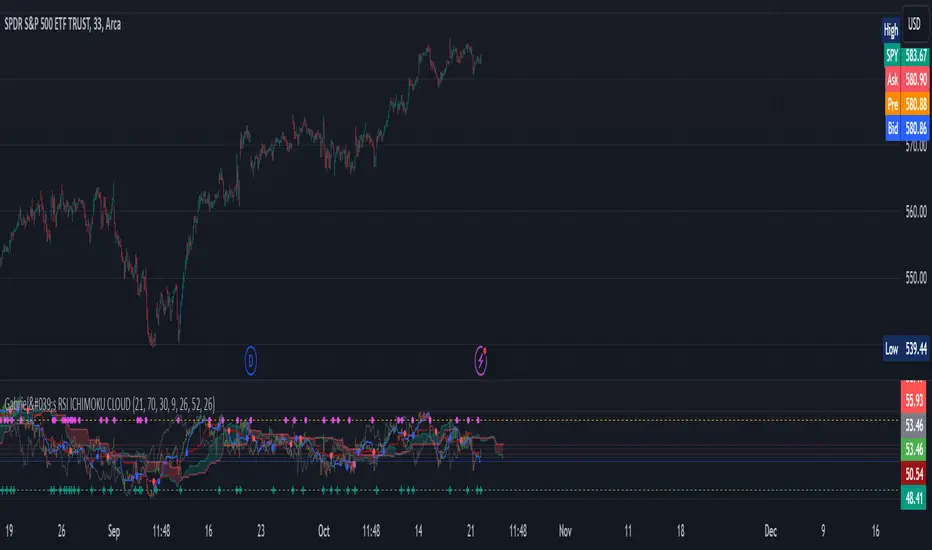
Gabriel's RSI ICHIMOKU CLOUDThe RSI Ichimoku Cloud combines the strengths of the Relative Strength Index (RSI) with the Ichimoku Cloud, offering a robust visualization of momentum and trend signals. This indicator helps traders identify potential trend reversals and key support/resistance levels by blending RSI with the Ichimoku Cloud components.
Key Features:
RSI Component:
Uses a customizable RSI length (default: 21) to detect overbought and oversold conditions.
Upper and Lower Bands (70 and 30) are plotted as dashed lines, highlighting critical zones of strength and weakness.
Bullish (green) and Bearish (red) cross signals are provided when RSI crosses key levels.
Ichimoku Cloud:
Conversion Line (Tenkan Sen): A 9-period Donchian channel (default), representing short-term price movements. Plotted in blue.
Base Line (Kijun Sen): A 26-period Donchian channel (default), representing mid-term price movements. Plotted in red.
Leading Span A (Senkou Span A): The average of the Conversion Line and Base Line, projected forward (displacement: 26). Plotted in green with transparency.
Leading Span B (Senkou Span B): A 52-period Donchian channel (default), projected forward (displacement: 26). Plotted in red with transparency.
The cloud fill between Senkou Span A and B changes color based on bullish (green) or bearish (red) cloud conditions.
Candlestick Overlay:
The indicator uses RSI values to color-code candlesticks. Bullish candles (RSI > Conversion Line) are green, and bearish candles (RSI < Conversion Line) are red.
Signal Crossovers:
RSI-Based Signals: Bullish and Bearish RSI crossovers with the Base Line trigger visual markers.
Ichimoku Signals: Bullish and Bearish crossovers between the Conversion Line and Base Line provide additional trade signals.
Alerts:
Alerts are triggered based on crossovers, allowing traders to set notifications for key trend changes.
This indicator is ideal for traders looking for a powerful blend of momentum (RSI) and trend-following (Ichimoku) tools in one place, with customizable settings for precise trade entry and exit signals.