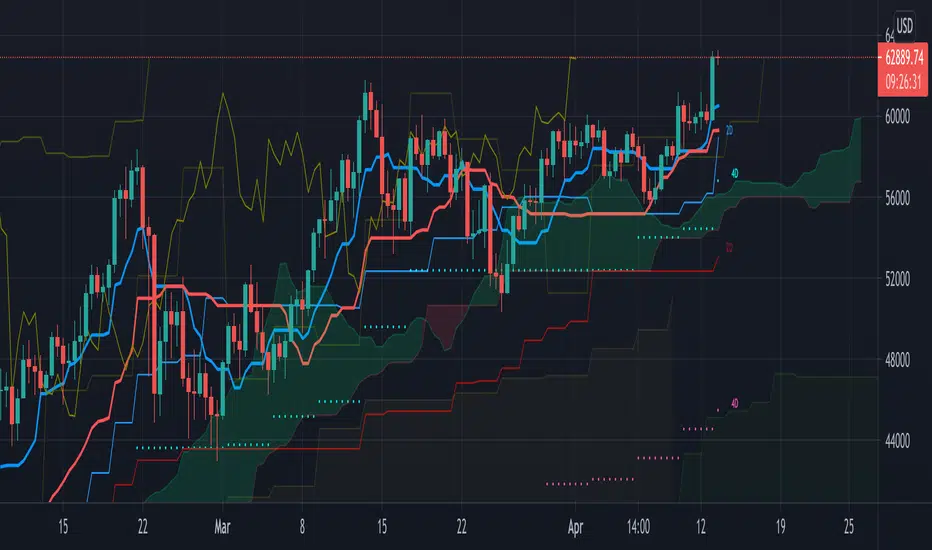
MTF Ichimoku CloudHere is my take on Ichimoku Cloud, Multiple Time Frames, based on the
most excellent work of "PineCoders" (MTF Selection Framework functions)!
The big advantage is that on 1 image you can easily see where
price is compared to Ichimoku Cloud patterns (each of different Time Frames).
This gives a lot of Support and Resistance area's!
I restricted the amount of MTF's at 2, more is just too messy
To make it more clear:
- Conversion line and Baseline in present timeframe : thick line
- Conversion line and Baseline in Higher Time Frame (HTF 1) : thin line
- Conversion line and Baseline in Higher Time Frame (HTF 2) : line with circles
All lines has labels at the right of the line with corresponding Time Frame
Since some prefer different settings with higher Time Frames,
each period in each Time Frame can be changed
The Time Frames itself can be chosen:
- or a multiple of present Time Frame
- or a fixed chosen Time Frame
Thanks!
Cerca negli script per "ichimoku"
inwCoin Ichimoku Risk% Strategy=========================
English
=========================
Ichimoku Cloud strategy,
Buy = Conversion Line cross Baseline up ( When price above cloud )
Sell = Conversion line cross baseline down
==========================
Thai
==========================
Ichimoku Cloud แต่ใช้หลักการเส้น Conversion Line กับ Baseline ตัดกัน ตอนราคาเหนือ cloud
กำหนดจุด stop จากใต้ low ย้อนหลังกี่แท่งก็เลือกได้ที่ Low/High candlestick option
ใช้ค่า Basic ไม่ได้ใช้ตามที่ชาวคริปโตเขาใช้กัน

Dual Ichimoku CloudDual Ichimoku cloud
Now you don't need to switch between time frames to see cloud support/resistance!
Configure cloud as you wish then set ratio.
Example Rations
3 Minutes to 15 Minutes = 5
15 Minutes to 1 Hour = 4
1 Day to 1 Week = 5

GR3Y IchimokuThe Ichimoku Cloud is a collection of technical indicators that show support and resistance levels, as well as momentum and trend direction. It does this by taking multiple averages and plotting them on the chart.

Volume Weighted High / Low IchimokuSame Idea as standard Ichimoku except using volume-weighted average high / low for the corresponding periods. adjustable displacement / time period inputs.

일목균형 시그널(Candle Color, Pattern). Ichimoku Cloud Buy Sell Sig. ⓙIt shows strong or weak (buy or sell) signal calculated by Ichimoku Cloud.
일목균형에 따른 시그널 표시입니다. (한글화)

Covengers Ichimoku Cloud ver 0.4Covegers Ichimoku Cloud ver 0.4 Released !
Middle Price Line Updated !
IF,
High Price Line head Downward = Sell
Low Price Line head Upward = Buy
EASY WORK.
//
코벤져스 일목구름 0.4 버전이 출시되었습니다.
중간값 선이 추가되었습니다.
만약,
고가의 중간선이 하향한다면 매도
저가의 중간선이 상향한다면 매수
정말 간단한 개념인데 결과가 재밌습니다.
0.41 버전이 추가업데이트 될 예정입니다.

umo Ichimoku CloudYou can see an Ichimoku Cloud in another time frame than the current time frame in which the bars are displayed.
When the cloud's time frame is larger than the bars', the cloud is not filled with solid color(I don't know why). Therefore the cloud is filled with bars instead.


Covengers Ichimoku Cloud ver0.3Covengers Ichimoku Cloud ver0.3
What's NEW?
ver 0.3 Plot Arrow When leadLine 1 and leadLine 2 CROSS
-END-
버전 0.3에서 변한 것
구름대 꼬임이 일어날 경우 화살표를 표시합니다.
끝

tvial/autoview-ha-ichimokuThis scripts leverages Heiken Hashi and Ichimoku signals.
Fully working with Autoview.

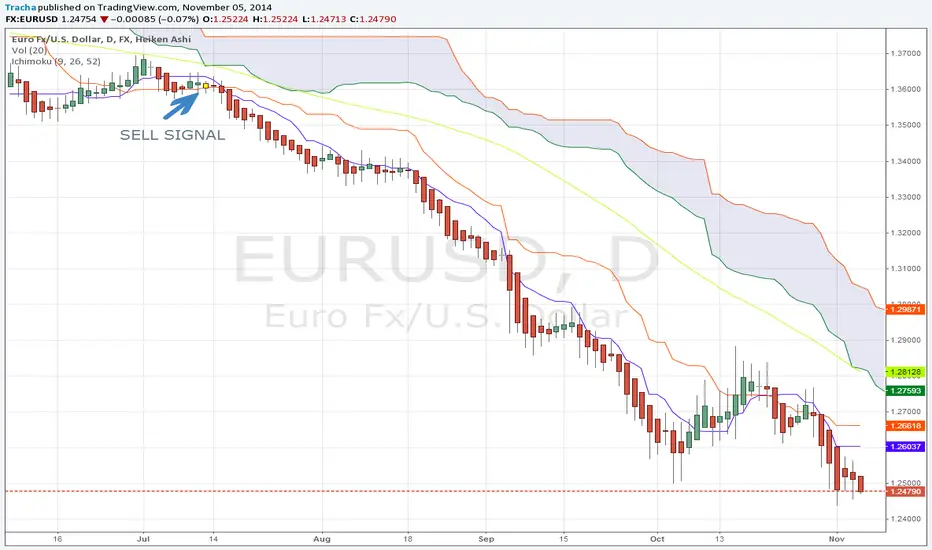
Heiken Ashi IchimokuWELCOME!
I want to share with you with my Heiken Ashi Ichimoku system
.
Remember to fallow me to get more startegy, or signals. Click like if u enjoy it :)
IMPORTANT:
System works with Heiken Ashi bars!!
The signals.
SELL SIGNAL:
1. When price is below:
a) cloud
b) blue line
2. When last bar was green, and now turn to red
3. When heiken ashi bar is close to SMA55, but its below SMA55
BUY SIGNAL:
1. When price is above:
a) cloud
b) blue line
2. When last bar was red, and now turn to green
3. When heiken ashi bar is close to SMA55, but its above SMA55
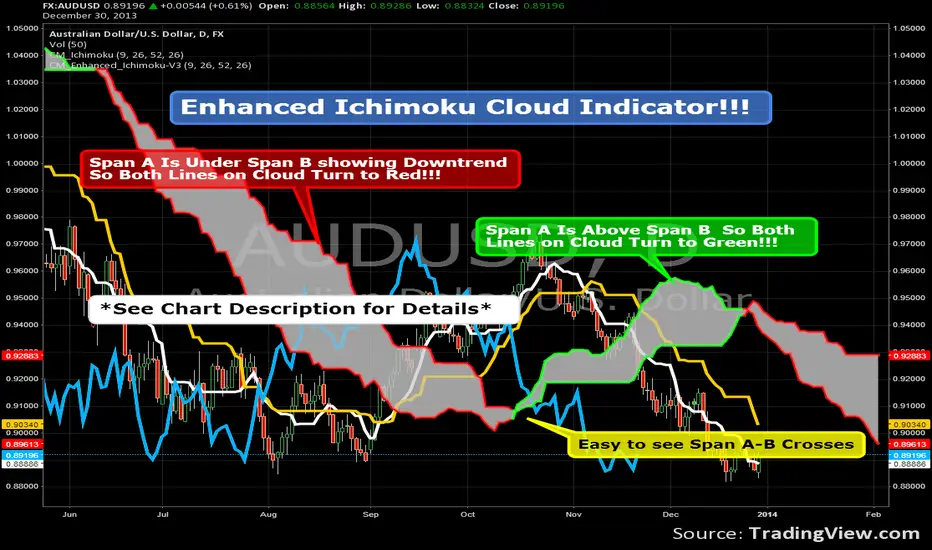
Enhanced Ichimoku Cloud Indicator!!!There are two Custom Ichimoku Indicators on the chart.
The one that is hidden is the Ichimoku Indicator with
The correct names for the lines Under the Style Tab.
The Indicator shown is coded so when the cloud is in
a down trend both lines turn Red.
When the Cloud is rising both lines turn to Green.
Because of the code used in order to switch the colors of
Both Lines at the same time I couldn't name Senkou Span A
and Senkou Span B in the "Styles" Tab.
You can still modify the colors to customize chart.
Ichimoku with Correct DisplacementThe default Ichimoku Cloud by TradingView is strange. The kumo is only displaced 25 periods forward, and the chikou is displaced 25 periods back. This is because TradingView had the correct value for displacement (26), but they decided to subtract this displacement by 1 when actually drawing the kumo and add 1 when drawing the chikou. This script fixes this and allows for easier customization of each line in the Ichimoku.

Open Source Ichimoku Kinkō hyō Keizen 改善Open Source Ichimoku Kinkō hyō Keizen 改善
First of all, thank you for using my work, making changes and continuing to share it for free.
I chose as indicator name Ichimoku Kinkō hyō Keizen logically simply by
what the word Keizen reflects a Japanese method which means continuous improvement and quality.
The goal here is to correct already any offset faults that should not be present and to try
to bring the indicator of new things that can serve and advance
and provide additional support for the decision.
A continuation will surely be planned which will bring its batch of new elements which will come
naturally be grafted to this tool.
Possibility of adding or not adding new lines Jun (76), Kan (226), Junkan A, B (676).
- Junakan To be calculated on the average of Jun / Kan 151 periods.
- Junkan B calculate over the 676 periods.
- Possibility of adding or not adding a new kinkohoyo calculate on Jun (76) and Kan (226).
- Possibility of adding or not adding a new Kumo calculate over 676 periods.
- Possibility of coloring or not the kumos or the kinkohyos.
- Possibility of adding or not Chikō 9,26,52,76,226,676.
- Ability to display or not passive lines in the future, 5 shots ahead of the movement of lines, provided that the extremes are not broken.
Thank you:
Thanks to TomQSD to have tested all the different versions of this project and to have contributed his criticism that helped me a lot to develop the tool.
Thanks to Herveo for having agreed to share his code
on the passive lines.
Remarks:
Not all options are activated at the same time.
Please do not uncheck the boxes in style, only change the colors.
To enable or disable lines, go to input parameters.
//////////////////////////////////////////////////////////////////////////////////////////////////////////////////////////////////////////////////////////////////////////////////////////////////////////////////////////////////
Open Source Ichimoku Kinkō hyō Keizen 改善
Tous d'abord, merci d'utiliser mon travail, d'apporter des modification et de continuer à le partager gratuitement.
J'ai choisi comme nom d’indicateur Ichimoku Kinkō hyō Keizen en toute logique tout simplement par
ce que le mot Keizen reflète une méthode Japonaise qui veut dire amélioration en continue et qualité.
Le but ici est de corriger déjà tout les défauts de décalage qui ne devraient pas être présents et d’essayer
d’apporter sans trop charger l’indicateur des choses nouvelles qui peuvent servir et faire progresser
et apporter une aide supplémentaire à la décision.
Une suite sera sûrement prévue qui apportera son lot d'éléments nouveaux qui viendront
naturellement se greffer à cet outil.
- Possibilité d’ajout ou non de nouvelles lignes Jun (76) , Kan (226) , Junkan A,B (676).
- Junakan A calculer sur la moyenne de Jun/Kan 151 périodes.
- Junkan B calculer sur les 676 périodes.
- Possibilité d’ajout ou non d’un nouveau kinkohoyo calculer sur le Jun (76) et le Kan (226).
- Possibilité d’ajout ou non d’un nouveau Kumo calculer sur 676 périodes.
- Possibilité de colorier ou non le ou les kumos et le ou les kinkohyos.
- Possibilité d’ajout ou non de Chikō 9,26,52,76,226,676.
- Possibilité d’afficher ou non de lignes passives dans le future, 5 coups d’avance sur les déplacement des lignes, a condition que les extrêmes ne soient pas rompu.
Remerciement :
Merci à TomQSD d'avoir tester toutes les différentes versions de ce projet et d’avoir apporter sa critique qui m'a beaucoup aidé à développer l’outil.
Merci à Herveo pour sont accord d’avoir bien voulu partager son code
sur les lignes passives.
Remarques:
Toutes les options ne sont pas toutes à activer en même temps.
Merci de ne pas décocher les cases dans style, modifiez seulement les couleurs.
Pour activer ou désactiver des lignes, allez dans paramètres en entrée.

Cracking Cryptocurrency - IchimokuCracking Cryptocurrency Ichimoku
The Ichimoku Cloud is designed to measure both momentum and trend. This script is optimized for **Cryptocurrency** by default but the settings can easily be adjusted from the Input Window to trade on any asset.
The core of the Ichimoku Strategy can be broken down into two facets, depending on whether you prefer to trade short-term or long-term. The Ichimoku is a trending indicator by default, it will not catch bottoms or tops. It is a momentum indicator .
Features & Functions
Multiple Time Frames Feature: With this feature, you can view the Ichimoku of a different time frame than you are currently viewing. This is very useful for looking at daily support and resistance (Kumo, Chikou) but wishing to trade a different strategy (Price Action, Moving Averages, etc.) on a lower time frame.
Short-Term Strategy
Revolves around Tenkan and Kijun crosses. Should the Tenkan crossover the Kijun, that is a bullish indication, and a signal to buy or go long.
Conversely, should the Tenkan crossunder the Kijun that is a bearish indication, and a signal to sell or go short.
In the settings, you can choose to plot Tenkan/Kijun crosses. With this option selected, several things will occur when Tenkan/Kijun crosses happen.
1. The current bar will change colors depending on whether the signal is a buy or a sell. Buy = Aqua, Sell = Fuchsia
2. A dot will appear on the Tenkan. Buy = Green, Sell = Red
3. A label will appear above or below bar indicating the correct decision. Buy = Buy, Sell = Sell.
Long-Term Strategy
Revolves around price closing above or below the Kumo Cloud itself. Should price close above a bearish Kumo Cloud, that is a bullish indication, and a signal to buy or go long.
Conversely, should price close below a bullish Kumo Cloud, that is a bearish indication, and a signal to sell or go short.
In either case, it's important to understand what the cloud breaks are representing. They are representing a potential shift in the dominant trend. Ichimoku attempts to identify when that shift happens, so we can get on the side of the emerging trend.
In the settings, you can choose to plot Kumo Cloud Breaks. With this option selected, several things will occur when Kumo Cloud breaks happen.
1. The current bar will change colors depending on whether the signal was a buy or a sell. Buy = Aqua, Sell = Fuchsia
2. A label will appear above or below bar indicating the correct decision. Buy = Buy, Sell = Sell.
---
Please note, that the Kumo Cloud Breaks indicate stronger signals, and thus more weight should be given to them than TK Crosses. However, depending on what time frame you are trading on, Kumo Cloud breaks are a rarer occurrence than TK Crosses.
---
Additional Features
---
The Chikou (Lagging) Spam is run through a Zero Lag filter. The reason for this is aesthetic. The smoothing can be disabled in the input windows.
The purpose of the Chikou Span is to identify Support and Resistance.
If you have any questions, success or failure stories, or seek advice feel free to send me a private message here on Trading View. Trade safely.

Ichimoku Cloud Indicator [TradingFinder] Kinko Hyo Cross Alerts🔵 Introduction
The Ichimoku Cloud (Ichimoku Kinko Hyo) is one of the most powerful and complete trading indicators in technical analysis. Originally developed by Japanese journalist Goichi Hosoda, the Ichimoku system combines multiple tools in one indicator, providing traders with instant insights into trend direction, support and resistance levels, and momentum. Unlike simple moving averages (SMA – Simple Moving Average), the Ichimoku Cloud (Kumo – Cloud) integrates dynamic elements that help traders forecast potential price action with greater clarity.
The Ichimoku Indicator (Ichimoku Signal System) is widely used across global markets, from Forex trading (FX – Foreign Exchange) to stocks, indices, and even cryptocurrencies. Its popularity comes from its ability to generate clear buy signals and sell signals based on the interaction of its components: Tenkan Sen (Conversion Line), Kijun Sen (Base Line), Senkou Span A, Senkou Span B, and Chikou Span (Lagging Line). When combined, these lines create the Ichimoku Cloud, which visually represents the balance between price action and market structure.
Ichimoku Cloud Lines Formulas :
Conversion Line (Tenkan Sen / Conversion Line) : Average of the highest high and lowest low over the past 9 periods => (9-PH + 9-PL) ÷ 2
Base Line (Kijun Sen / Base Line) : Average of the highest high and lowest low over the past 26 periods => (26-PH + 26-PL) ÷ 2
Leading Span A (Senkou Span A / Leading Span A) : Average of the Conversion Line and Base Line, plotted 26 periods ahead => (Tenkan Sen + Kijun Sen) ÷ 2
Leading Span B (Senkou Span B / Leading Span B) : Average of the highest high and lowest low over the past 52 periods, plotted 26 periods ahead => (52-PH + 52-PL) ÷ 2
Lagging Span (Chikou Span / Lagging Span) : Current closing price, plotted 26 periods behind.
One of the biggest advantages of the Ichimoku Trading Strategy (Ichimoku Cloud Trading System) is that it allows traders to identify the market condition at a glance. When the price is above the Kumo (Cloud), it indicates a bullish trend (uptrend). When the price is below the Kumo, the market is in a bearish trend (downtrend). And when the price is inside the cloud, the market is ranging (sideways trend). This simplicity and visual clarity make Ichimoku an essential indicator for both beginner traders and professional analysts.
The Ichimoku Cloud Indicator (Ichimoku Technical Analysis Tool) continues to be one of the most reliable charting methods. Traders often consider it superior to basic moving averages (MA – Moving Average) or exponential moving averages (EMA – Exponential Moving Average), because it not only shows trend direction but also highlights potential future support and resistance levels. With its unique combination of trend analysis, price forecasting, and trading signals, Ichimoku remains a core strategy in modern trading systems.
🔵 How to Use
The Ichimoku Cloud is more than just a set of lines; it’s a complete trading system that helps traders identify trends, momentum, and key support and resistance levels. By combining its five lines Conversion Line, Base Line, Leading Span A, Leading Span B, and Lagging Span traders can develop clear buy and sell strategies.
🟣 Identifying Trend Direction
Bullish Trend (Uptrend) : Price is above the cloud (Kumo), and the cloud is green. Leading Span A is above Leading Span B, signaling strong upward momentum.
Bearish Trend (Downtrend) : Price is below the cloud, and the cloud is red. Leading Span A is below Leading Span B, confirming a downward momentum.
Ranging / Sideways Market : Price is inside the cloud, indicating indecision and consolidation. Traders often avoid opening strong positions during these periods.
🟣 Buy Strategies
Conversion/Base Line Crossover : A buy signal occurs when the Conversion Line (Tenkan Sen) crosses above the Base Line (Kijun Sen). The signal is strongest when this crossover happens above the cloud.
Price Above Base Line : If the price moves above the Base Line while in an uptrend, it confirms bullish momentum and provides a favorable entry point.
Cloud Support Pullback : During a pullback in an uptrend, the price may touch or slightly enter the cloud. Traders can use the cloud as a dynamic support zone for buying opportunities.
Lagging Span Confirmation : Ensure the Lagging Span (Chikou Span) is above the price of 26 periods ago to confirm the strength of the bullish trend.
🟣 Sell Strategies
Conversion/Base Line Crossover : A sell signal is generated when the Conversion Line (Tenkan Sen) crosses below the Base Line (Kijun Sen). This signal is strongest when it occurs below the cloud.
Price Below Base Line : If the price falls below the Base Line in a downtrend, it confirms bearish momentum and strengthens the sell setup.
Cloud Resistance Pullback : During a bounce in a downtrend, the cloud acts as a resistance zone. Traders can enter sell positions when price approaches or touches the cloud from below.
Lagging Span Confirmation : The Lagging Span should be below the price of 26 periods ago, confirming downward momentum.
🟣 Cloud Breakout Signals
A strong buy occurs when the price breaks above the cloud from below, signaling a potential trend reversal.
A strong sell occurs when the price breaks below the cloud from above, indicating a shift toward a bearish trend.
🟣 Combining Signals for Stronger Entries
For higher probability trades, combine multiple signals : trend direction (cloud color and position), crossovers (Tenkan/Kijun), and Lagging Span position.
Avoid trading against the overall trend. For example, avoid buying when price is below a red cloud or selling when price is above a green cloud.
🔵 Setting
Tenkan Sen Period : Lookback period for Conversion Line (default: 9).
Kijun Sen Period : Lookback period for Base Line (default: 26).
Span B Period : Lookback period for Leading Span B, forms one Cloud boundary (default: 52).
Shift Lines : Periods forward for Cloud / backward for Lagging Span (default: 26).
Cross Tenkan/Kijun Alert : Alert on Conversion/Base Line crossover.
Cross Price/Tenkan Alert : Alert when price crosses Tenkan Sen.
Cross Price/Kijun Alert : Alert when price crosses Kijun Sen
🔵 Conclusion
The Ichimoku Cloud (Ichimoku Kinko Hyo) is much more than a simple indicator it is a complete trading system that combines trend detection, momentum analysis, and support/resistance identification in one view. By interpreting the position of price relative to the cloud, the interaction between Tenkan Sen (Conversion Line) and Kijun Sen (Base Line), the leading spans (Senkou Span A and B), and the Chikou Span (Lagging Line), traders can identify potential buy and sell opportunities with higher confidence.
The main advantage of the Ichimoku Cloud is its ability to provide a “one-look equilibrium” snapshot of the market. It highlights bullish trends when the price is above the cloud, bearish conditions when the price is below it, and indecision or transition when the price is inside the cloud. Crossovers, cloud breakouts, and confirmations by the Chikou Span strengthen the trading signals.
However, traders should keep in mind the limitations of the Ichimoku system. It is based on historical data and should not be used in isolation. Combining it with other tools such as RSI, volume analysis, or candlestick patterns can significantly improve accuracy and reduce false signals.

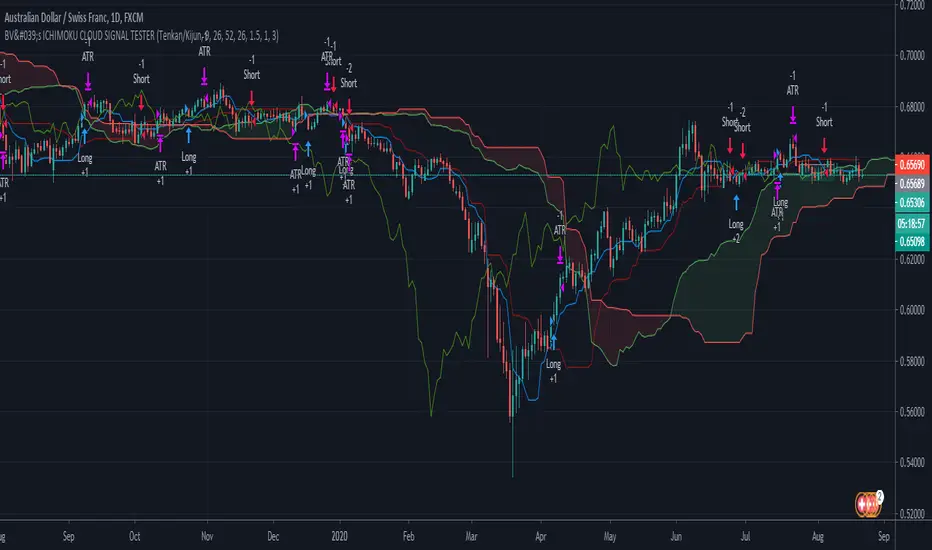
BV's ICHIMOKU CLOUD - All Signalshello traders,
With this script you will be able to test the different signals offered by the ichimoku cloud system.
Crossover Tenkan Kijun
Crossover Tenkan Kijun above Kumo
Crossover Price Kijun
Crossover Price Kijun above Kumo
Crossover Price Tenkan
Crossover Prince Tenkan aboce Kumo
Crossover price Kumo
Kumo Color Change
Remember to check the JPYPAIR checkbox if you test a JPY/xxx pair, this will adjust the stop loss and take profit calculation.
You can also adjust the TP and SL values in the parameters to change their ratio. I had good results in 1.5:1 with the :
SL = 2.25 x ATR(14)
TP = 1.5 x ATR(14)
At your tests, don't hesitate to share your results.
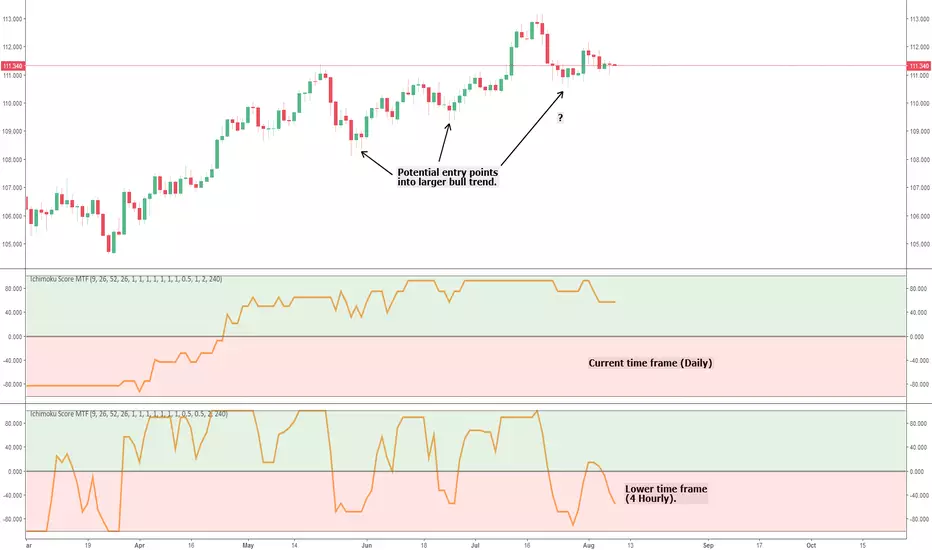
Ichimoku Cloud Score MTFThis is a simple multi time frame (MTF) conversion of the Ichimoku Cloud Score indicator.
All credit goes to the following users for the initial implementations:
- User @dashed :
- User @sjb933 :
This script calculates the Cloud Score based on the sjb933 version; all I've done is convert the script to Pinescript version 3 (to ensure the security function works as intended) and add MTF capability.
I'm a big fan of MTF analysis when using indicators (particularly oscillators). Using a higher time frame runs into the issue of the indicator repainting until the relevant higher time frame candle closes (this is inevitable and logical - so don't comment saying it repaints!). However, for lagging indicators such as this one, adding a lower time frame provides potential entry and exit signals into the larger trend, and also provides early warning of large trend shifts before the current time frame will. This can give you more control over your trades, and in my experience helps lagging indicators such as Ichimoku stay relevant in high volatility markets that are vastly different from when the indicators were conceived.
Any queries please let me know.
Cheers,
RJR
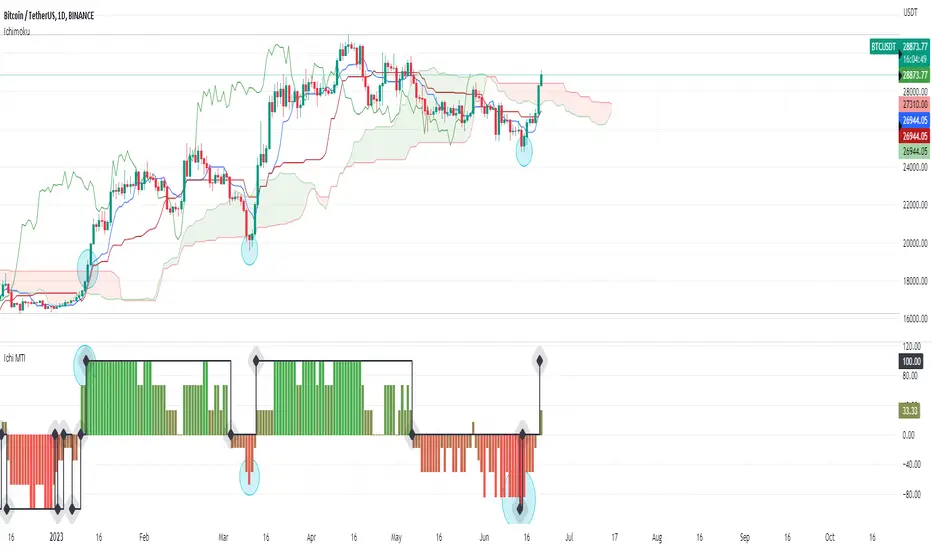
Ichimoku Cloud Momentum & Trend Indicator «NoaTrader»If you like Ichimoku cloud and use it in your analysis, or you are new to it and sometimes gets tricky to figure out all the details, this indicator tries to simplify that and visualize the change of trend and momentum relative to the past based on ichimoku.
The RED/GREEN columns are showing momentum strength while the black diamond line suggests the trend change. The conditions are simple enough to check them out on the script.
As you can see highlighted cyan circles on the chart as major important signals on the chart of Bitcoin daily timeframe.
This script tries to be complementary to the ichimoku cloud itself and cannot replace the levels represented by the cloud on chart.
Ichimoku Score Indicator [tanayroy]The Ichimoku Cloud is a comprehensive indicator that provides a clear view of market states through five key components. By analyzing the interaction between these components and the asset's price, traders can gain insights into trend direction, momentum, and potential reversals.
Introducing the Ichimoku Score System
I have developed a scoring system that quantifies these interactions, offering an objective method to evaluate market conditions. The score is calculated based on the relative positioning of Ichimoku components, with adjustable weightings via user input.
Scoring Criteria
Each component contributes to the overall score as follows:
Price vs. Cloud (Kumo) & Other Components
Price vs. Kumo → 2 Points
Price vs. Kumo Shadow → 0.5 Points
Tenkan vs. Kijun
Tenkan vs. Kijun → 2 Points
Tenkan vs. Kumo → 0.5 Points
Kijun vs. Kumo → 0.5 Points
Tenkan Slope → 0.5 Points
Kijun Slope → 0.5 Points
Chikou Span Interactions
Price vs. Chikou → 2 Points
Chikou vs. Kumo → 0.5 Points
Chikou Consolidation → 0.5 Points
Senkou Span Analysis
Senkou A vs. Senkou B → 2 Points
Senkou Slope → 0.5 Points
Price vs. Key Levels
Price vs. Tenkan → 2 Points
Price vs. Kijun → 2 Points
Interpreting the Score
The aggregate score functions as an oscillator, fluctuating between a range of ±16.0.
A higher score indicates strong bullish momentum.
A lower score suggests bearish market conditions.
To enhance readability and smooth fluctuations, a 9-period SMA is applied to the score.
Application in Algorithmic Trading
This scoring system helps integrate Ichimoku Cloud principles into algorithmic trading strategies by providing a structured and quantifiable method for assessing market conditions.
Would love to hear your feedback! 🚀 Let me know how this system works for you.

Multi Timeframe Silent IchimokuMulti Timeframe Silent Ichimoku
Is an upgrade on my previous Silent Ichimoku indicator witch attempts to filter out the noise from the Ichimoku indicator By only coloring the bars
Green if the Ichimoku spots an uptrend
Red if Ichimoku spots a downtrend
And Gray if Ichimoku spots consolidation
This Indicator adds the ability to filter out some bad signals by taking the Ichimoku from the higher time frame into consideration and providing a visual back test
Huge shout out to fareidzulkifli for the Quick Backtest Framework Awesome tool to add to your framework
